. 2023 Apr 29;24(9):8071.
doi: 10.3390/ijms24098071.

The Combination of Natural Molecules Naringenin, Hesperetin, Curcumin, Polydatin and Quercetin Synergistically Decreases SEMA3E Expression Levels and DPPIV Activity in In Vitro Models of Insulin Resistance

Affiliations

The Combination of Natural Molecules Naringenin, Hesperetin, Curcumin, Polydatin and Quercetin Synergistically Decreases SEMA3E Expression Levels and DPPIV Activity in In Vitro Models of Insulin Resistance

Emanuele-Salvatore Scarpa et al. Int J Mol Sci. .

Abstract

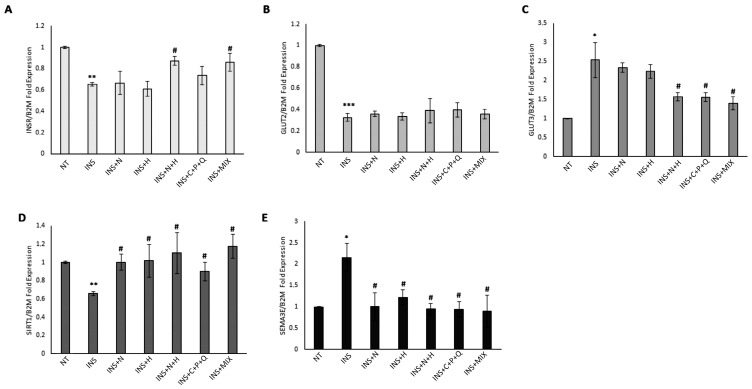
Type 2 diabetes mellitus (T2DM) is a disease characterized by a prolonged hyperglycemic condition caused by insulin resistance mechanisms in muscle and liver, reduced insulin production by pancreatic β cells, and a chronic inflammatory state with increased levels of the pro-inflammatory marker semaphorin 3E. Phytochemicals present in several foods have been used to complement oral hypoglycemic drugs for the management of T2DM. Notably, dipeptidyl peptidase IV (DPPIV) inhibitors have demonstrated efficacy in the treatment of T2DM. Our study aimed to investigate, in in vitro models of insulin resistance, the ability of the flavanones naringenin and hesperetin, used alone and in combination with the anti-inflammatory natural molecules curcumin, polydatin, and quercetin, to counteract the insulin resistance and pro-inflammatory molecular mechanisms that are involved in T2DM development. Our results show for the first time that the combination of naringenin, hesperetin, curcumin, polydatin, and quercetin (that mirror the nutraceutical formulation GliceFen®, Mivell, Italy) synergistically decreases expression levels of the pro-inflammatory gene SEMA3E in insulin-resistant HepG2 cells and synergistically decreases DPPIV activity in insulin-resistant Hep3B cells, indicating that the combination of these five phytochemicals is able to inhibit pro-inflammatory and insulin resistance molecular mechanisms and could represent an effective innovative complementary approach to T2DM pharmacological treatment.

Keywords: DPPIV; INSR; SEMA3E; caspase 1; insulin resistance; natural molecules.


Conflict of interest statement

The authors declare no conflict of interest. The funders had no role in the design of the study, in the collection, analysis, or interpretation of data, in the writing of the manuscript, or in the decision to publish the results.

Figures

Figure 1
Figure 1
Dose-response curves of HepG2 and Hep3B cell viability after NAR, HES, N + H, C + P + Q, and MIX treatments. HepG2 (AC) and Hep3B (DF) cells were treated with different concentrations of NAR (0–240 µM), HES (0–240 µM), N + H (30 µM NAR + 30 µM HES), C + P + Q (1 μM CUR + 10 μM POL + 0.5 μM QRC), MIX (N + H + C + P + Q), or 0.4% DMSO alone as a control for 24 h. Results are expressed as a percentage of cell viability compared to the cell viability of 0.4% DMSO-treated cells (CTRL, set to 100%) and presented as mean value ± SD from three independent experiments performed in quadruplicate. * p < 0.05, ** p < 0.01; *** p < 0.001.
Figure 2
Figure 2
Modulation of INSR, GLUT2, GLUT3, SIRT1, and SEMA3E expression levels in HepG2 cells. Cells were treated for 72 h with 500 nM insulin (INS) alone or for 72 h with 500 nM INS with the addition of 30 µM NAR, 30 µM HES, N + H (30 µM NAR + 30 µM HES), C + P + Q (1 μM CUR + 10 μM POL + 0.5 μM QRC), and MIX (N + H + C + P + Q) for 24 h. Cells treated with 0.4% DMSO alone for 24 h were used as controls (NT). (A) RTqPCR data of the relative expression of INSR in HepG2 cells. (B) RTqPCR data of the relative expression of GLUT2 in HepG2 cells. (C) RTqPCR data of the relative expression of GLUT3 in HepG2 cells. (D) RTqPCR data of the relative expression of SIRT1 in HepG2 cells. (E) RTqPCR data of the relative expression of SEMA3E in HepG2 cells. Results are presented as the mean value ± SD from three independent experiments performed in triplicate. * p < 0.05; ** p < 0.01; *** p < 0.001 when compared with the control (NT) sample; # p < 0.05; ## p < 0.01 when compared with the INS-treated (INS) sample.
Figure 3
Figure 3
Modulation of INSR, GLUT2, GLUT3, SIRT1, and SEMA3E expression levels in Hep3B cells. Cells were treated for 72 h with 500 nM insulin (INS) alone or for 72 h with 500 nM INS with the addition of 30 µM NAR, 30 µM HES, N + H (30 µM NAR + 30 µM HES), C + P + Q (1 μM CUR + 10 μM POL + 0.5 μM QRC), and MIX (N + H + C + P + Q) for 24 h. Cells treated with 0.4% DMSO alone for 24 h were used as controls (NT). (A) RTqPCR data of the relative expression of INSR in Hep3B cells. (B) RTqPCR data of the relative expression of GLUT2 in Hep3B cells. (C) RTqPCR data of the relative expression of GLUT3 in Hep3B cells. (D) RTqPCR data of the relative expression of SIRT1 in Hep3B cells. (E) RTqPCR data of the relative expression of SEMA3E in Hep3B cells. Results are presented as the mean value ± SD from three independent experiments performed in triplicate. * p < 0.05; ** p < 0.01; *** p < 0.001 when compared with the control (NT) sample; # p < 0.05 when compared with the INS-treated (INS) sample.
Figure 4
Figure 4
Modulation of INSR and semaphorin 3E protein levels in HepG2 and Hep3B cells. Cells were treated for 72 h with 500 nM insulin (INS) alone or for 72 h with 500 nM INS with the addition of 30 µM NAR, 30 µM HES, N + H (30 µM NAR + 30 µM HES), C + P + Q (1 μM CUR + 10 μM POL + 0.5 μM QRC), and MIX (N + H + C + P + Q) for 24 h. Cells treated with 0.4% DMSO alone for 24 h were used as controls. (A) Representative western blot analysis showing INSR and semaphorin 3E protein levels in HepG2 cells not treated (NT) or treated with INS, INS + N, INS + H, INS + N + H, INS + C + P + Q, and INS + MIX; β-actin levels were used as loading controls. (B) Graphical representation of western blot data of INSR protein levels, normalized to β-actin protein levels, in HepG2 cells. (C) Graphical representation of western blot data of semaphorin 3E protein levels, normalized to β-actin protein levels, in HepG2 cells. (D) Representative western blot analysis showing INSR and semaphorin 3E protein levels in Hep3B cells not treated (NT) or treated with INS, INS + N, INS + H, INS + N + H, INS + C + P + Q, and INS + MIX; β-actin levels were used as loading controls. (E) Graphical representation of western blot data of INSR protein levels, normalized to β-actin protein levels, in Hep3B cells. (F) Graphical representation of western blot data of semaphorin 3E protein levels, normalized to β-actin protein levels, in Hep3B cells. Results are presented as mean value ± SD from three independent experiments. * p < 0.05, ** p < 0.01 when compared with the not-treated (NT) sample; # p < 0.05, ## p < 0.01 when compared with the INS sample.
Figure 5
Figure 5
Regulation of caspase 1 catalytic activity in HepG2 and Hep3B cells. Cells were treated for 72 h with 500 nM insulin (INS) alone or for 72 h with 500 nM INS with the addition of 30 µM NAR, 30 µM HES, N + H (30 µM NAR + 30 µM HES), C + P + Q (1 μM CUR + 10 μM POL + 0.5 μM QRC), and MIX (N + H + C + P + Q) for 24 h. Cells treated with 0.4% DMSO alone for 24 h were used as controls (NT). (A) Caspase 1 activity levels in HepG2 cells. (B) Caspase 1 activity levels in Hep3B cells. Results are presented as mean values ± SD from three independent experiments performed in duplicate. * p < 0.05; ** p < 0.01 when compared with the not-treated (NT) sample; # p < 0.05 when compared with the INS-treated sample.
Figure 6
Figure 6
Regulation of DPPIV catalytic activity in HepG2 and Hep3B cells. Cells were treated for 72 h with 500 nM insulin (INS) alone or for 72 h with 500 nM INS with the addition of 30 µM NAR, 30 µM HES, N + H (30 µM NAR + 30 µM HES), C + P + Q (1 μM CUR + 10 μM POL + 0.5 μM QRC), and MIX (N + H + C + P + Q) for 24 h. Cells treated with 0.4% DMSO alone for 24 h were used as controls (NT). (A) DPPIV activity levels in HepG2 cells. (B) DPPIV activity levels in Hep3B cells. Results are presented as the mean value ± SD from three independent experiments performed in triplicate. * p < 0.05 when compared with the not-treated (NT) sample; # p < 0.05 when compared with the INS-treated sample.

References

    1. DeMarsilis A., Reddy N., Boutari C., Filippaios A., Sternthal E., Katsiki N., Mantzoros C. Pharmacotherapy of type 2 diabetes: An update and future directions. Metabolism. 2022;137:155332. doi: 10.1016/j.metabol.2022.155332. - DOI - PubMed
    1. Suárez R., Chapela S.P., Álvarez-Córdova L., Bautista-Valarezo E., Sarmiento-Andrade Y., Verde L., Frias-Toral E., Sarno G. Epigenetics in Obesity and Diabetes Mellitus: New Insights. Nutrients. 2023;15:811. doi: 10.3390/nu15040811. - DOI - PMC - PubMed
    1. Shaikh S., Lee E.-J., Ahmad K., Ahmad S.-S., Lim J.-H., Choi I. A Comprehensive Review and Perspective on Natural Sources as Dipeptidyl Peptidase-4 Inhibitors for Management of Diabetes. Pharmaceuticals. 2021;14:591. doi: 10.3390/ph14060591. - DOI - PMC - PubMed
    1. Singh A.K., Patel P.K., Choudhary K., Joshi J., Yadav D., Jin J.Q. Quercetin and Coumarin Inhibit Dipeptdyl peptidase-IV and Exhibits Antioxidant properties; In Silico, In Vitro, Ex Vivo. Biomolecules. 2020;10:207. doi: 10.3390/biom10020207. - DOI - PMC - PubMed
    1. Jiménez-Cortegana C., Iglesias P., Ribalta J., Vilariño-García T., Montañez L., Arrieta F., Aguilar M., Durán S., Obaya J.C., Becerra A., et al. Nutrients and Dietary Approaches in Patients with Type 2 Diabetes Mellitus and Cardiovascular Disease: A Narrative Review. Nutrients. 2021;13:4150. doi: 10.3390/nu13114150. - DOI - PMC - PubMed

MeSH terms