. 2023 Apr 30;24(9):8102.
doi: 10.3390/ijms24098102.

Alternative Splicing Changes Promoted by NOVA2 Upregulation in Endothelial Cells and Relevance for Gastric Cancer

Affiliations

Alternative Splicing Changes Promoted by NOVA2 Upregulation in Endothelial Cells and Relevance for Gastric Cancer

Anna Di Matteo et al. Int J Mol Sci. .

Abstract

Angiogenesis is crucial for cancer progression. While several anti-angiogenic drugs are in use for cancer treatment, their clinical benefits are unsatisfactory. Thus, a deeper understanding of the mechanisms sustaining cancer vessel growth is fundamental to identify novel biomarkers and therapeutic targets. Alternative splicing (AS) is an essential modifier of human proteome diversity. Nevertheless, AS contribution to tumor vasculature development is poorly known. The Neuro-Oncological Ventral Antigen 2 (NOVA2) is a critical AS regulator of angiogenesis and vascular development. NOVA2 is upregulated in tumor endothelial cells (ECs) of different cancers, thus representing a potential driver of tumor blood vessel aberrancies. Here, we identified novel AS transcripts generated upon NOVA2 upregulation in ECs, suggesting a pervasive role of NOVA2 in vascular biology. In addition, we report that NOVA2 is also upregulated in ECs of gastric cancer (GC), and its expression correlates with poor overall survival of GC patients. Finally, we found that the AS of the Rap Guanine Nucleotide Exchange Factor 6 (RapGEF6), a newly identified NOVA2 target, is altered in GC patients and associated with NOVA2 expression, tumor angiogenesis, and poor patient outcome. Our findings provide a better understanding of GC biology and suggest that AS might be exploited to identify novel biomarkers and therapeutics for anti-angiogenic GC treatments.

Keywords: RNA binding proteins; alternative splicing; angiogenesis; cancer biomarkers; gastric cancer; tumor vasculature.


Conflict of interest statement

Author C.G. has been involved as a consultant in Company Gene Tools, LLC. The funding sponsor had no role in the design of the study, in the collection, analysis or interpretation of data and in the writing of the manuscript and the decision to publish it. All other authors declare no conflict of interest.

Figures

Figure 1
Figure 1
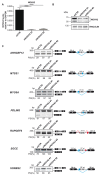
Novel AS events identified upon NOVA2 upregulation in mouse ECs. (A) Left panel: HA-tagged NOVA2 mRNA levels in empty vector control (HA) or NOVA2 (HA-NOVA2)-overexpressing mouse ECs (moEC). Data represent the mean ± SEM (n = 3 independent experiments) *** p ≤ 0.001. Unpaired Student’s t-test. Right panel: Immunoblotting using anti-HA antibody in HA and HA-NOVA2 moEC. Vinculin is used as loading control. (B) RT-PCR analysis of selected NOVA2 splicing targets in moEC-overexpressing HA-tagged NOVA2. Transcripts generated from skipping/inclusion of the AS exon are represented near the corresponding RT-PCR bands. The percentages of exon inclusion (PSI) are also indicated. For each AS event, the genomic region containing the AS exon and the flanking sequences are represented; grey boxes: AS exons; black boxes: constitutive exons; blue/red dots: YCAY clusters predicted to function as NOVA silencer/enhancer; blue/red bars: NOVA-silenced/enhanced exon inclusion events.
Figure 2
Figure 2
Validation of NOVA2-mediated AS events in human ECs knockdown for NOVA2. (A) NOVA2 mRNA levels in HUVEC hTERT transfected with control (siCTR) or two different NOVA2 siRNAs (siNOVA2 #1, siNOVA2 #2). Data represent the mean ± SEM (n = 3 independent experiments) **** p ≤ 0.0001. One-way ANOVA with multiple Tukey’s comparisons test. (B) NOVA2 immunoblotting in siCTR, siNOVA2 #1 and siNOVA2 #2 HUVEC hTERT. (C) RT-PCR analysis of selected NOVA2 targets in siCTR, siNOVA2 #1 and siNOVA2 #2 HUVEC hTERT. Transcripts generated from skipping/inclusion of the AS exon are represented near the corresponding RT-PCR bands. The percentages of exon inclusion (PSI) are also indicated. For each AS event, the genomic region containing the AS exon and the flanking regions are represented; grey boxes: AS exons; black boxes: constitutive exons; blue/red dots: YCAY clusters predicted to function as NOVA silencer/enhancer; blue/red bars: NOVA silenced/enhanced exon inclusion events.
Figure 3
Figure 3
NOVA2 expression levels are increased in GC and associated with poor overall patients’ survival. (A) Expression of NOVA2 mRNA levels (mean ± SEM) in normal and GC samples from TCGA-STAD project (from TSVdb); Unpaired Student t-test with Welch’s correction (p = 0.0099). ** p ≤ 0.01. (B) Fold change of NOVA2 expression in normal and GC samples from Wang dataset (GSE19826) and DErrico dataset (GSE13911) (probe: 206477_s_t, p = 0.0145 (* p ≤ 0.05) and p = 0.0003 (*** p < 0.001, respectively) with Unpaired Student’s t-test. (C) Kaplan–Meier plot of overall survival in GC patients from TCGA-STAD project classified according to NOVA2 expression (cutoff: median) (red curve, high expression; black curve, low expression). Log-rank (Mantel–Cox) test (p = 0.0415). (D) Kaplan–Meier plot of overall survival in GC patients from GSE14210, GSE15459, GSE22377, GSE29272; GSE38749, GSE51105, GSE62254 datasets classified according to NOVA2 expression (cutoff: median; probe: 206477_s_t; Log-rank (Mantel–Cox) test p = 1.2 × 10⁻⁹) (red curve, high expression; black curve, low expression).
Figure 4
Figure 4
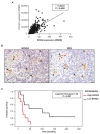
Expression of NOVA2 in gastric cancer vessels. (A) Correlation analysis showing a significant association between COL4A1 and NOVA2 expression levels from TGCA-STAD project (Pearson r = 0.6372, p < 0.0001). (B) Serial sections of GC samples (n = 27) stained for NOVA2 (left panel) or ERG (right panel). Arrows indicate NOVA2-positive nuclei of ECs. No immunoreactivity is present in the nuclei of tumor cells. Arrowheads indicate ERG-positive nuclei of ECs in the same area on a consecutive section of tissue. Scale bar: 20 μm. (C) Kaplan–Meier plot of overall survival in our cohort of GC patients classified according to NOVA2 expression (red curve, high expression; black curve, low expression).
Figure 5
Figure 5
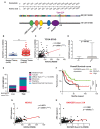
Expression of RapGEF6 exon 21A in the TCGA-STAD dataset. (A) Coding transcript and protein domains of RapGEF6 adapted from DoChaP web tool. Black lines with numbers show the position in the transcript (nucleotides) and protein (amino acids). Different exons are represented in different colors; exon 21A is highlighted. RapGEF6 protein (NP_001157858) is depicted as a black line, with elliptical shapes representing functional domains: cyclic-nucleotide-binding domain (green); N-terminal domain for RasGEF-like protein domain (orange); post-synaptic density protein, disc large tumor suppressor, zonula occludens-1 protein (PDZ) domain (yellow); ras-associating domain (blue); ras-like guanine nucleotide exchange factor domain (purple). DR stands for disordered region encoded by exon 21A. (B) RapGEF6 exon 21A in healthy donor (blue) and tumor patient (red) samples of TCGA-STAD dataset. p value was calculated with unpaired student t-test with Welch’s correlation. (C) Correlation between NOVA2 and RapGEF6 exon21A expression in TCGA-STAD samples. Linear regression (red line) and Pearson r coefficient with two-tailed p value are reported. (D) RapGEF6 exon 21A expression in RSEM stratified as upper and lower quartiles according to tumor size (T1 and >T1). Unpaired student t-test. (E) Histotype distribution of STAD-GC tumors for low and high RapGEF6 exon 21A expression (comparing lower and upper quartile). Fisher’s exact test. (F) Kaplan–Meier analysis of 10-year overall survival for STAD patients stratified for RapGEF6 exon 21A expression in high (upper quartile, red line), medium (medium quartile, black line) and low (lower quartile, green line) levels. Log-rank (Mantel–Cox) test. p value legend: * p  <  0.05; ** p < 0.01; *** p < 0.001; **** p  <  0.0001. (G,H) NOVA2 and RapGEF6 exon 21A correlation with a gastric angiogenesis-related gene (ARG) signature.

References

    1. Potente M., Gerhardt H., Carmeliet P. Basic and Therapeutic Aspects of Angiogenesis. Cell. 2011;146:873–887. doi: 10.1016/j.cell.2011.08.039. - DOI - PubMed
    1. Lopes-Coelho F., Martins F., Pereira S.A., Serpa J. Anti-Angiogenic Therapy: Current Challenges and Future Perspectives. Int. J. Mol. Sci. 2021;22:3765. doi: 10.3390/ijms22073765. - DOI - PMC - PubMed
    1. Martin J.D., Seano G., Jain R.K. Normalizing Function of Tumor Vessels: Progress, Opportunities, and Challenges. Annu. Rev. Physiol. 2019;81:505–534. doi: 10.1146/annurev-physiol-020518-114700. - DOI - PMC - PubMed
    1. Baralle M., Baralle F.E. The Splicing Code. Biosystems. 2018;164:39–48. doi: 10.1016/j.biosystems.2017.11.002. - DOI - PubMed
    1. Pan Q., Shai O., Lee L.J., Frey B.J., Blencowe B.J. Deep Surveying of Alternative Splicing Complexity in the Human Transcriptome by High-Throughput Sequencing. Nat. Genet. 2008;40:1413–1415. doi: 10.1038/ng.259. - DOI - PubMed