. 2023 May 7;24(9):8407.
doi: 10.3390/ijms24098407.

A Predictive Model of Adaptive Resistance to BRAF/MEK Inhibitors in Melanoma

Affiliations

A Predictive Model of Adaptive Resistance to BRAF/MEK Inhibitors in Melanoma

Emmanuelle M Ruiz et al. Int J Mol Sci. .

Abstract

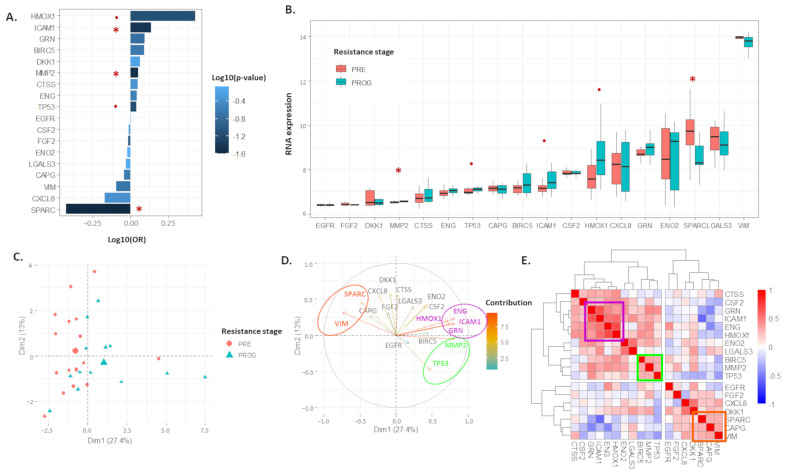
The adaptive acquisition of resistance to BRAF and MEK inhibitor-based therapy is a common feature of melanoma cells and contributes to poor patient treatment outcomes. Leveraging insights from a proteomic study and publicly available transcriptomic data, we evaluated the predictive capacity of a gene panel corresponding to proteins differentially abundant between treatment-sensitive and treatment-resistant cell lines, deciphering predictors of treatment resistance and potential resistance mechanisms to BRAF/MEK inhibitor therapy in patient biopsy samples. From our analysis, a 13-gene signature panel, in both test and validation datasets, could identify treatment-resistant or progressed melanoma cases with an accuracy and sensitivity of over 70%. The dysregulation of HMOX1, ICAM, MMP2, and SPARC defined a BRAF/MEK treatment-resistant landscape, with resistant cases showing a >2-fold risk of expression of these genes. Furthermore, we utilized a combination of functional enrichment- and gene expression-derived scores to model and identify pathways, such as HMOX1-mediated mitochondrial stress response, as potential key drivers of the emergence of a BRAF/MEK inhibitor-resistant state in melanoma cells. Overall, our results highlight the utility of these genes in predicting treatment outcomes and the underlying mechanisms that can be targeted to reduce the development of resistance to BRAF/MEK targeted therapy.

Keywords: BRAF/MEK inhibitors; aggressiveness; biomarkers; melanoma; resistance; risk stratification.


Conflict of interest statement

The authors declare no conflict of interest.

Figures

Figure 1
Figure 1
The 18 proteomic panel was deregulated in human melanoma resistant model (GSE99898). (A). Barplot representing odd ratio (OR) of a linear regression analysis of 18 proteomic genes according to resistance stage. (B). Boxplot representing expression distribution of 18 genes according to resistance stage. (C,D). Principal component analysis of 18 genes explaining heterogeneity observed across samples with individual/samples (C) and variables/genes (D) plots. Red asterisk (*) p-value < 0.05, red dot (.) p-value < 0.1. (E). Heatmap representing hierarchical clustering of Spearman’s correlation matrix of 18 proteomic genes.
Figure 2
Figure 2
An optimized 13-risk panel predicts resistance stage. (A). Protein–protein interaction (PPI) and relationship network between 13 genes (network obtained from STRING database). (B,C). Boxplot representing value distribution of 13-risk score according to resistance stage in GSE99898 (B) and other databases (C), with paired samples fold change highlighted. (D). Barplot representing odd ratio (OR) of linear regression analysis of 13-risk score according to resistance stage. (E). Area under curves of Receiver operative curves analysis of 13-risk score to predict resistance stage in different databases analyzed. (F). Dotplots representing value of 13-risk score in PRE samples, differentiated through their score fold change.
Figure 3
Figure 3
This study’s 13-risk score is highly differentiated according to resistance stage. (A,B,D,E). Principal component analysis of 13-risk panel explaining heterogeneity observed in GSE99898 (A,B) and FiveDatabases (D,E) samples, with individuals/samples (A,D) and variable/genes (B,E,C,F). Heatmap representing hierarchical clustering of Spearman’s correlation matrix of 13-risk genes panel observed in GSE99898 (C) and FiveDatabases (F) samples. (G,H) Boxplot representing distribution of 13-risk genes according to 13-risk score fold change, stratified as Down, Slightly up, and Up. Black dot (.), p-value < 0.1 for Up vs. Slightly up comparison; black asterisk (*), p-value < 0.05 for Up vs. Slightly up comparison; red dot (.), p-value < 0.1 for Up vs. Down/Slightly up comparison; and red asterisk (*), p-value < 0.05 for Up vs. Down/Slightly up comparison.
Figure 4
Figure 4
A subset of pathway signaling is 13-risk score-dependent to modulate therapeutic sensitivity of human melanoma GSE99898 samples. (A) Dotplots representing enrichment p-value of 12 pathways that present a similar significant correlation with 13-risk score in GSE99898 and FiveDatabases samples. (B) Principal component analysis (PCA) of 13 pathways’ scores (right) explaining variance observed in GSE99898 samples (left), differentiated through their resistance stage. (C) Hierarchical clustering of previous PCA identifying three clusters of samples (left) and pathway scores according to clusters samples (right). (D) A 13-risk score expression according to pathways PCA clusters (top) and score (bottom) in samples. (E) A 13-risk score fold change (FC) according to pathways PCA clusters (left) and score (right) in PRE (top) and PROG (bottom) samples. Kruskal–Wallis p-value (significant < 0.05) for boxplots, and Spearman’s correlation coefficient with corresponding p-value for dotplots.
Figure 5
Figure 5
Pathways score distribution according to 13-Risk score and 13-risk score fold change (FC), stratified as downregulated, slightly upregulated, and upregulated in the PROG GSE99898 samples. Spearman’s correlation with corresponding p-values and Kruskal–Wallis tests for the 13-Risk score FC comparison (p-value significant < 0.05).
Figure 6
Figure 6
A total of 105 genes involved in selected pathways are dependent on 13-risk score to modulate therapeutic sensitivity of melanoma samples. (A). Hierarchical clustering of Spearman’s correlation matrix between 19 selected pathway scores and 13-risk genes panel. (B). Hierarchical clustering of normalized expression of 105 DEGs selected in GSE99898 samples. Annotations described correlation and Kruskal p-values for genes and pathways according to 13-risk score and 13-risk score fold change. (C). Protein interaction network obtained from NetworkAnalyst platform between 105 genes and 13-risk genes panels. Only correlation > |0.3| were collected.
Figure 7
Figure 7
KEGG pathway model illustrating main genes involved in 13-risk score dependent BRAF inhibitor resistance process. GF, growth factor; CPC, chromosome passage protein complex; MCM, minichromosomal maintenance; MOMP, mitochondrial outer membrane permeabilization; and MLCP, myosin light chain phosphatase.

References

    1. Arnold M., Singh D., Laversanne M., Vignat J., Vaccarella S., Meheus F., Cust A.E., de Vries E., Whiteman D.C., Bray F. Global Burden of Cutaneous Melanoma in 2020 and Projections to 2040. JAMA Dermatol. 2022;158:495. doi: 10.1001/jamadermatol.2022.0160. - DOI - PMC - PubMed
    1. Davey R.J., van der Westhuizen A., Bowden N.A. Metastatic melanoma treatment: Combining old and new therapies. Crit. Rev. Oncol. Hematol. 2016;98:242–253. doi: 10.1016/j.critrevonc.2015.11.011. - DOI - PubMed
    1. Kozar I., Margue C., Rothengatter S., Haan C., Kreis S. Many ways to resistance: How melanoma cells evade targeted therapies. Biochim. Biophys. Acta Rev. Cancer. 2019;1871:313–322. doi: 10.1016/j.bbcan.2019.02.002. - DOI - PubMed
    1. Bayan C.A.Y., Lopez A.T., Gartrell R.D., Komatsubara K.M., Bogardus M., Rao N., Saenger Y.M. The Role of Oncolytic Viruses in the Treatment of Melanoma. Curr. Oncol. Rep. 2018;20:80. doi: 10.1007/s11912-018-0729-3. - DOI - PMC - PubMed
    1. Gellrich F.F., Schmitz M., Beissert S., Meier F. Anti-PD-1 and Novel Combinations in the Treatment of Melanoma—An Update. J. Clin. Med. 2020;9:223. doi: 10.3390/jcm9010223. - DOI - PMC - PubMed

MeSH terms

Substances