

Redox-Cycling "Mitocans" as Effective New Developments in Anticancer Therapy
- PMID: 37176145
- PMCID: PMC10179378
- DOI: 10.3390/ijms24098435
Redox-Cycling "Mitocans" as Effective New Developments in Anticancer Therapy
Abstract
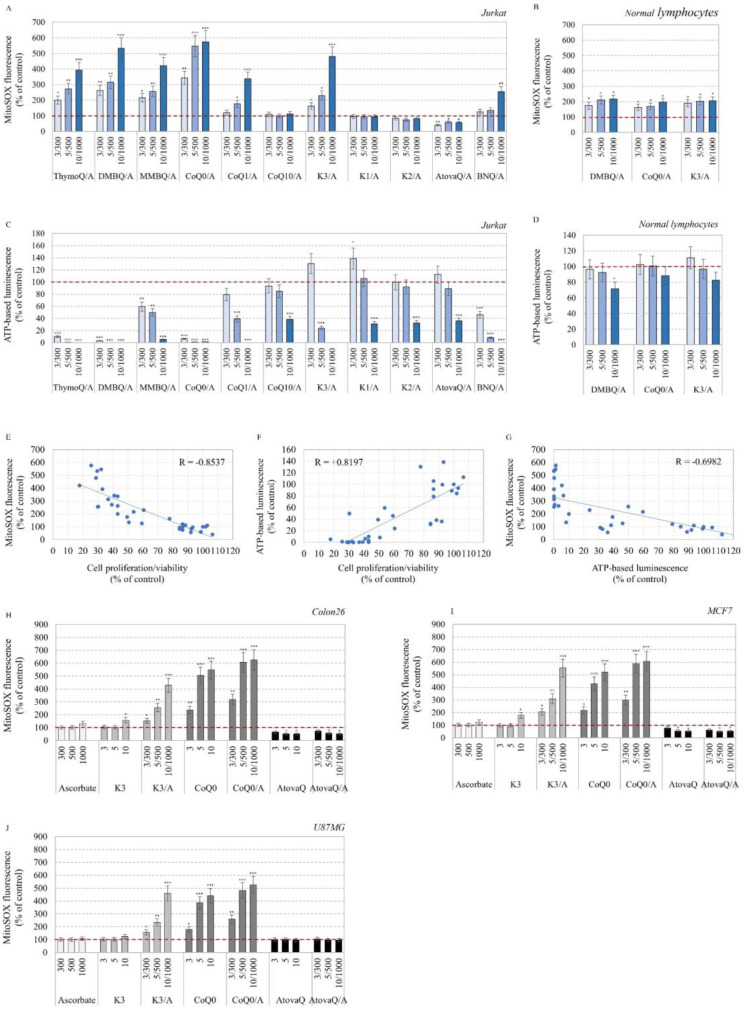
Our study proposes a pharmacological strategy to target cancerous mitochondria via redox-cycling "mitocans" such as quinone/ascorbate (Q/A) redox-pairs, which makes cancer cells fragile and sensitive without adverse effects on normal cells and tissues. Eleven Q/A redox-pairs were tested on cultured cells and cancer-bearing mice. The following parameters were analyzed: cell proliferation/viability, mitochondrial superoxide, steady-state ATP, tissue redox-state, tumor-associated NADH oxidase (tNOX) expression, tumor growth, and survival. Q/A redox-pairs containing unprenylated quinones exhibited strong dose-dependent antiproliferative and cytotoxic effects on cancer cells, accompanied by overproduction of mitochondrial superoxide and accelerated ATP depletion. In normal cells, the same redox-pairs did not significantly affect the viability and energy homeostasis, but induced mild mitochondrial oxidative stress, which is well tolerated. Benzoquinone/ascorbate redox-pairs were more effective than naphthoquinone/ascorbate, with coenzyme Q0/ascorbate exhibiting the most pronounced anticancer effects in vitro and in vivo. Targeted anticancer effects of Q/A redox-pairs and their tolerance to normal cells and tissues are attributed to: (i) downregulation of quinone prenylation in cancer, leading to increased mitochondrial production of semiquinone and, consequently, superoxide; (ii) specific and accelerated redox-cycling of unprenylated quinones and ascorbate mainly in the impaired cancerous mitochondria due to their redox imbalance; and (iii) downregulation of tNOX.
Keywords: ascorbate; cancer; mitochondria; oxidative stress; prenylation; quinones; redox-cycling.
Conflict of interest statement
The authors declare no conflict of interest.
Figures


Similar articles
-
Tolerable treatment of glioblastoma with redox-cycling 'mitocans': a comparative study in vivo.Redox Rep. 2023 Dec;28(1):2220531. doi: 10.1080/13510002.2023.2220531. Redox Rep. 2023. PMID: 37581329 Free PMC article.
-
Docosahexaenoic Acid Potentiates the Anticancer Effect of the Menadione/Ascorbate Redox Couple by Increasing Mitochondrial Superoxide and Accelerating ATP Depletion.Anticancer Res. 2023 Mar;43(3):1213-1220. doi: 10.21873/anticanres.16268. Anticancer Res. 2023. PMID: 36854499
-
Selective Targeting of Cancerous Mitochondria and Suppression of Tumor Growth Using Redox-Active Treatment Adjuvant.Oxid Med Cell Longev. 2020 Nov 2;2020:6212935. doi: 10.1155/2020/6212935. eCollection 2020. Oxid Med Cell Longev. 2020. PMID: 33204397 Free PMC article.
-
Redox-active quinones and ascorbate: an innovative cancer therapy that exploits the vulnerability of cancer cells to oxidative stress.Anticancer Agents Med Chem. 2011 Feb;11(2):213-21. doi: 10.2174/187152011795255902. Anticancer Agents Med Chem. 2011. PMID: 21395522 Review.
-
Molecular mechanisms of quinone cytotoxicity.Chem Biol Interact. 1991;80(1):1-41. doi: 10.1016/0009-2797(91)90029-7. Chem Biol Interact. 1991. PMID: 1913977 Review.
Cited by
-
Tolerable treatment of glioblastoma with redox-cycling 'mitocans': a comparative study in vivo.Redox Rep. 2023 Dec;28(1):2220531. doi: 10.1080/13510002.2023.2220531. Redox Rep. 2023. PMID: 37581329 Free PMC article.
-
High-dose vitamin C as a metabolic treatment of cancer: a new dimension in the era of adjuvant and intensive therapy.Clin Transl Oncol. 2025 Apr;27(4):1366-1382. doi: 10.1007/s12094-024-03553-x. Epub 2024 Sep 11. Clin Transl Oncol. 2025. PMID: 39259387 Review.
-
Ecto-NOX Disulfide-Thiol Exchanger 2 (ENOX2/tNOX) Is a Potential Prognostic Marker in Primary Malignant Melanoma and May Serve as a Therapeutic Target.Int J Mol Sci. 2024 Nov 4;25(21):11853. doi: 10.3390/ijms252111853. Int J Mol Sci. 2024. PMID: 39519404 Free PMC article.
-
Identification of Antioxidant Methyl Derivatives of Ortho-Carbonyl Hydroquinones That Reduce Caco-2 Cell Energetic Metabolism and Alpha-Glucosidase Activity.Int J Mol Sci. 2024 Jul 30;25(15):8334. doi: 10.3390/ijms25158334. Int J Mol Sci. 2024. PMID: 39125904 Free PMC article.
References
-
- Chen K., Lu P., Beeraka N.M., Sukocheva O.A., Madhunapantula S.V., Liu J., Sinelnikov M.Y., Nikolenko V.N., Bulygin K.V., Mkhaleva L.M., et al. Mitochondrial mutations and mitoepigenetics: Focus on regulation of oxidative stress-induced response in breast cancers. Semin. Cancer Biol. 2022;83:556–559. doi: 10.1016/j.semcancer.2020.09.012. - DOI - PubMed
-
- Ralf S.J., Low P., Dong L., Lawen A., Neuzil J. Mitocans: Mitochondrial targeted anti-cancer drugs as improved therapies and related patient documents. Recent Pat. Anticancer Drug. Discov. 2006;1:327–346. - PubMed
-
- Verrax J., Beck R., Dejeans R.B., Glorieux C., Sid B., Curi Pedrosa R., Benites J., Vasquez D., Valderrama J.A., Buc Calderon P. Redox-active quinones and ascorbate: An innovative cancer therapy that exploits the vulnerability of cancer cells to oxidative stress. Anticancer Agents Med. Chem. 2011;11:213–221. doi: 10.2174/187152011795255902. - DOI - PubMed
-
- Otto A., Hahlbrock T., Eich K., Karaaslan F., Jurgens C., Germer C.-T., Wiegering A., Kammerer U. Antiproliferative and antimetabolic effects behind the anticancer property of fermented wheat germ extract. BMC Complement. Altern. Med. 2016;16:160. doi: 10.1186/s12906-016-1138-5. - DOI - PMC - PubMed
MeSH terms
Substances
Grants and funding
LinkOut - more resources
Full Text Sources
Medical
Research Materials
