. 2023 May 8;24(9):8459.
doi: 10.3390/ijms24098459.

Blood Metabolite Profiling of Antarctic Expedition Members: An 1H NMR Spectroscopy-Based Study

Affiliations

Blood Metabolite Profiling of Antarctic Expedition Members: An 1H NMR Spectroscopy-Based Study

Laura Del Coco et al. Int J Mol Sci. .

Abstract

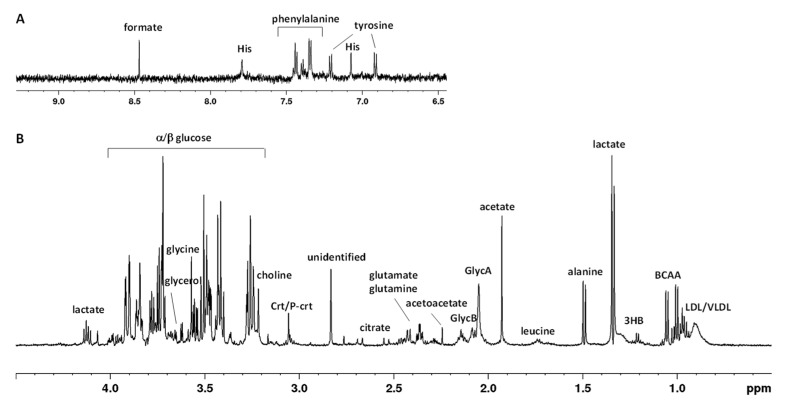
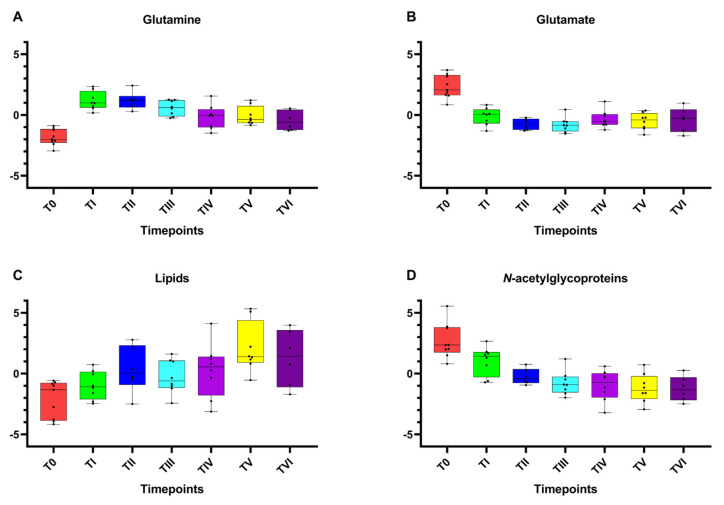
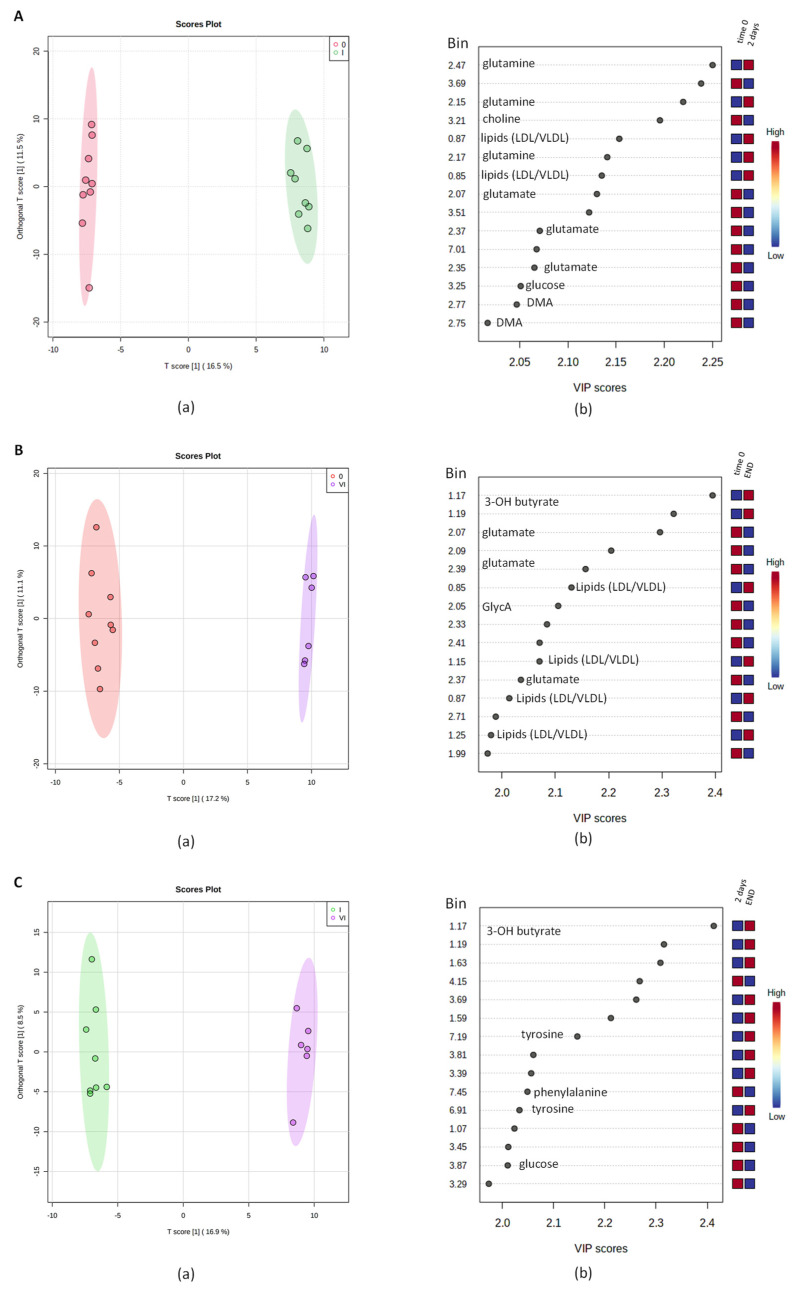
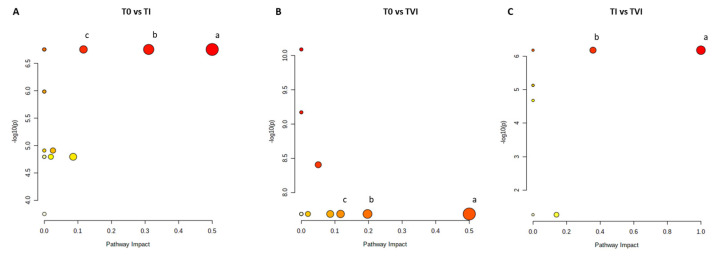
Serum samples from eight participants during the XV winter-over at Concordia base (Antarctic expedition) collected at defined time points, including predeparture, constituted the key substrates for a specific metabolomics study. To ascertain acute changes and chronic adaptation to hypoxia, the metabolic profiles of the serum samples were analyzed using NMR spectroscopy, with principal components analysis (PCA) followed by partial least squares and orthogonal partial least squares discriminant analyses (PLS-DA and OPLS-DA) used as supervised classification methods. Multivariate data analyses clearly highlighted an adaptation period characterized by an increase in the levels of circulating glutamine and lipids, mobilized to supply the body energy needs. At the same time, a reduction in the circulating levels of glutamate and N-acetyl glycoproteins, stress condition indicators, and proinflammatory markers were also found in the NMR data investigation. Subsequent pathway analysis showed possible perturbations in metabolic processes, potentially related to the physiological adaptation, predominantly found by comparing the baseline (at sea level, before mission onset), the base arrival, and the mission ending collected values.

Keywords: Antarctica; Concordia base; NMR; adaptation; hypoxia; metabolomics; winter-over.


Conflict of interest statement

The authors declare no conflict of interest.

Figures

Figure 1
Figure 1
Typical 600 MHz 1H CPMG (Carr–Purcell–Meiboom–Gill) NMR spectrum of human serum in the aromatic (A) and aliphatic (B) regions. Abbreviations used: BCCA—branched chain amino acids (valine, isoleucine, leucine); 3HB—3-hydroxybutyrate; His—histidine; LDL/VLDL—low-/very-low-density lipoprotein; GlycA/GlycB—N-acetyl glycoprotein; Crt/P-crt—creatine/phosphocreatine.
Figure 2
Figure 2
Box and whisker plots of the significantly altered metabolites (spectral bins) according to NMR data analysis. Y axes are represented as relative units. Data were mean-centered and normalized to the total spectral area. Due to the mean-centering and normalization process, we obtained a negative scale in the Y-axis of the bins (Metaboanalyst program analysis). The bar plots show the normalized values (mean +/− standard deviation). The boxes range from the 25% and the 75% percentiles; the 5% and 95% percentiles are indicated as error bars; single data points are indicated by black dots. The variations between the timepoints considered of (A) glutamine, (B) glutamate, (C) lipids, and (D) N-acetylglycoproteins are shown.
Figure 3
Figure 3
Pairwise OPLS-DA models scores plots (a) and VIP scores for metabolites related to buckets with different relative concentrations among the two considered groups (b), obtained for predeparture (T0) vs. TI (A), predeparture (T0) vs. TVI (B) and TI vs. TVI (C) time points.
Figure 4
Figure 4
Metabolic pathways. Color intensity (white to red) reflects increasing statistical significance, and circle diameter varies with the pathway impact. The graph was obtained by plotting on the y-axis the −log10 transforms of p-values from the pathway enrichment analysis and on the x-axis the pathway impact values derived from the pathway topology analysis. The most significant pathways (p-value < 0.05; pathway impact > 0.1) are depicted (A) (a) D-glutamine and D-glutamate metabolism; (b) alanine, aspartate, and glutamate metabolism; (c) arginine biosynthesis. (B) (a) D-glutamine and D-glutamate metabolism; (b) alanine, aspartate, and glutamate metabolism; (c) arginine biosynthesis. (C): (a) phenylalanine, tyrosine, and tryptophan biosynthesis; (b) phenylalanine metabolism.

Similar articles

Cited by

References

    1. Eswaran V. A Diffusion Wave out of Africa. Curr. Anthropol. 2002;43:749–774. doi: 10.1086/342639. - DOI
    1. Bigham A.W. Natural Selection and Adaptation to Extreme Environments: High Latitudes and Altitudes. In: O’Rourke D.H., editor. A Companion to Anthropological Genetics. Wikley; Hoboken, NJ, USA: 2019. p. 219. Chapter 15.
    1. Kaleel Rahman N.R., Chung A. Pathophysiology of respiratory disease and its significance to anaesthesia. Anaesth. Intensive Care Med. 2022;23:674–680. doi: 10.1016/j.mpaic.2022.08.006. - DOI
    1. Chen P.S., Chiu W.T., Hsu P.L., Lin S.C., Peng I.C., Wang C.Y., Tsai S.J. Pathophysiological implications of hypoxia in human diseases. J. Biomed. Sci. 2020;27:63. doi: 10.1186/s12929-020-00658-7. - DOI - PMC - PubMed
    1. López-Barneo J., González-Rodríguez P., Gao L., Fernández-Agüera M.C., Pardal R., Ortega-Sáenz P. Oxygen sensing by the carotid body: Mechanisms and role in adaptation to hypoxia. Am. J. Physiol. Cell Physiol. 2016;310:C629–C642. doi: 10.1152/ajpcell.00265.2015. - DOI - PubMed

LinkOut - more resources