. 2023 Apr 22;12(9):1737.
doi: 10.3390/plants12091737.

Response to Hypersalinity of Four Halophytes Growing in Hydroponic Floating Systems: Prospects in the Phytomanagement of High Saline Wastewaters and Extreme Environments

Affiliations

Response to Hypersalinity of Four Halophytes Growing in Hydroponic Floating Systems: Prospects in the Phytomanagement of High Saline Wastewaters and Extreme Environments

Meri Barbafieri et al. Plants (Basel). .

Abstract

Hypersaline environments occur naturally worldwide in arid and semiarid regions or in artificial areas where the discharge of highly saline wastewaters, such as produced water (PW) from oil and gas industrial setups, has concentrated salt (NaCl). Halophytes can tolerate high NaCl concentrations by adopting ion extrusion and inclusion mechanisms at cell, tissue, and organ levels; however, there is still much that is not clear in the response of these plants to salinity and completely unknown issues in hypersaline conditions. Mechanisms of tolerance to saline and hypersaline conditions of four different halophytes (Suaeda fruticosa (L.) Forssk, Halocnemum strobilaceum (Pall.) M. Bieb., Juncus maritimus Lam. and Phragmites australis (Cav.) Trin. ex Steudel) were assessed by analysing growth, chlorophyll fluorescence and photosynthetic pigment parameters, nutrients, and sodium (Na) uptake and distribution in different organs. Plants were exposed to high saline (257 mM or 15 g L-1 NaCl) and extremely high or hypersaline (514, 856, and 1712 mM or 30, 50, and 100 g L-1 NaCl) salt concentrations in a hydroponic floating culture system for 28 days. The two dicotyledonous S. fruticosa and H. strobilaceum resulted in greater tolerance to hypersaline concentrations than the two monocotyledonous species J. maritimus and P. australis. Plant biomass and major cation (K, Ca, and Mg) distributions among above- and below-ground organs evidenced the osmoprotectant roles of K in the leaves of S. fruticosa, and of Ca and Mg in the leaves and stem of H. strobilaceum. In J. maritimus and P. australis the rhizome modulated the reduced uptake and translocation of nutrients and Na to shoot with increasing salinity levels. S. fruticosa and H. strobilaceum absorbed and accumulated elevated Na amounts in the aerial parts at all the NaCl doses tested, with high bioaccumulation (from 0.5 to 8.3) and translocation (1.7-16.2) factors. In the two monocotyledons, Na increased in the root and rhizome with the increasing concentration of external NaCl, dramatically reducing the growth in J. maritimus at both 50 and 100 g L-1 NaCl and compromising the survival of P. australis at 30 g L-1 NaCl and over after two weeks of treatment.

Keywords: fluorescence parameters; hypersaline environment; nutrient absorption; organ element distribution; photosynthetic pigments; phytodesalinization; sodium content.


Conflict of interest statement

The authors declare no conflict of interest.

Figures

Figure 1
Figure 1
Biomass partitioning (DW, g plant−1) in different organs (leaf or shoot, (A); stem or rhizome, (B); root, (C); whole plant, (D)) of the four halophyte plant species treated with 0 (control), 15, 30, 50, and 100 g L−1 NaCl (corresponding to 0, 257, 514, 856, and 1712 mM NaCl, respectively) for 28 days. Values are the means ± standard error (SE) of four plants (n = 4). Results of the two-way ANOVA (p ≤ 0.05) for the effect of NaCl treatments and species and of their interaction are shown (F and p values). When the interaction between factors was significant, the Fisher LSD-test (p ≤ 0.05) was applied: significantly different data are followed by different letters in the histogram columns of the same graph. DW, dry weight.
Figure 2
Figure 2
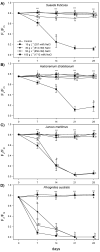
Maximum PSII photochemical efficiency (Fv/Fm) (dark-adapted leaves) in S. fruticosa (A), H. strobilaceum (B), J. maritimus (C), and P. autralis (D) exposed for 28 days to increasing NaCl concentrations (0—control, 15, 30, 50, and 100 g L−1, corresponding to 0, 257, 514, 856, and 1712 mM, respectively). Data reported in the graphs are the mean values ± SE (n = 4). For each time point, the results of a one way-ANOVA (NaCl-treated plants against the controls) are indicated (*, p ≤ 0.05; ***, p ≤ 0.001). Different letters correspond to significant differences for the Fisher’s LSD post-hoc test (p ≤ 0.05).
Figure 3
Figure 3
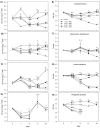
Actual efficiency of PSII photochemistry in the light (ΦPSII) and non-photochemical fluorescence quenching (NPQ) in S. fruticosa (A,E), H. strobilaceum (B,F), J. maritimus (C,G), and P. autralis (D,H) exposed for 28 days to increasing NaCl concentrations (0—control, 15, 30, 50, and 100 g L−1, corresponding to 0, 257, 514, 856, and 1712 mM, respectively). Data reported in the graphs are the mean values ± SE (n = 4). For each time point, the results of a one way-ANOVA (NaCl-treated plants against the controls) are indicated (*, p ≤ 0.05; **, p ≤ 0.01; ***, p ≤ 0.001; n.s., not significant). Different letters correspond to significant differences for the Fisher’s LSD post-hoc test (p ≤ 0.05).
Figure 4
Figure 4
Total chlorophyll (Chl a + b, mg g−1 DW) and the chlorophyll a to b ratio (Chl a/b) in leaves of S. fruticosa (A,E), H. strobilaceum (B,F), J. maritimus (C,G), and P. autralis (D,H) exposed for 28 days to increasing NaCl concentrations (0—control, 15, 30, 50, and 100 g L−1, corresponding to 0, 257, 514, 856, and 1712 mM, respectively). Data reported in the graphs are the mean values ± SE; each mean refers to three or four extractions or replications derived from leaf material of one plant or bulked material of two plants (n = 3–4) for each species and NaCl treatment. For each time point, the results of a one way-ANOVA (NaCl-treated plants against the controls) are indicated (*, p ≤ 0.05; **, p ≤ 0.01; ***, p ≤ 0.001; n.s., not significant). Different letters correspond to significant differences for the Fisher’s LSD post-hoc test (p ≤ 0.05).
Figure 5
Figure 5
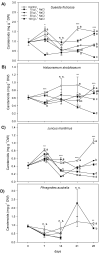
Carotenoids (mg g−1 DW) in the leaves of S. fruticosa (A), H. strobilaceum (B), J. maritimus (C), and P. autralis (D) exposed for 28 days to increasing NaCl concentrations (0—control, 15, 30, 50, and 100 g L−1, corresponding to 0, 257, 514, 856, and 1712 mM, respectively). Data (mean values ± SE) reported in the graphs refers to three or four extractions or replications derived from leaf material of one plant or bulked material of two plants (n = 3–4) for each species and NaCl treatment. For each time point, the results of a one way-ANOVA (NaCl-treated plants against the controls) are indicated (*, p ≤ 0.05; **, p ≤ 0.01; ***, p ≤ 0.001; n.s., not significant). Different letters correspond to significant differences for the Fisher’s LSD post-hoc test (p ≤ 0.05).
Figure 6
Figure 6
Calcium (Ca) and magnesium (Mg) concentrations (mg g−1 DW) in different organs (leaf or shoot—(A,D); stem or rhizome—(B,E); root—(C,F)) of S. fruticosa, H. strobilaceum, J. maritimus and P. australis treated with 0 (control), 15, 30, 50, and 100 g L−1 NaCl (corresponding to 0, 257, 514, 856, and 1712 mM NaCl, respectively) for 28 days. Values are the means ± standard deviation (SD) of two or three extractions (n = 2–3) derived from the bulked vegetal material of four plants for each species and NaCl treatment. Results of the two-way ANOVA (p ≤ 0.05) for the effects of NaCl treatments (NaCl) and species (S) and of their interaction (NaCl × S) are shown (F and p values). When the interaction between factors was significant, the Fisher LSD-test (p ≤ 0.05) was applied. Significantly different data are followed by different letters on the histogram columns of the same graph.
Figure 7
Figure 7
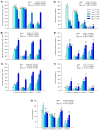
Sodium (Na) concentration (mg g−1 DW, (AC)) and content or removal (mg plant−1, (DG)) in different organs (leaf or shoot—(A,D); stem or rhizome—(B,E); root—(C,F); whole plant, (G)) of S. fruticosa, H. strobilaceum, J. maritimus, and P. australis treated with 0 (control), 15, 30, 50, and 100 g L−1 NaCl (corresponding to 0, 257, 514, 856, and 1712 mM NaCl, respectively) for 28 days. Values are the means ± SD of two or three extractions (n = 2–3) derived from the bulked vegetal material of four plants for each species and NaCl treatment. Results of the two-way ANOVA (p ≤ 0.05) for the effects of NaCl treatments (NaCl) and species (S) and of their interaction (NaCl × S) are shown (F and p values). When the interaction between factors was significant, the Fisher LSD-test (p ≤ 0.05) was applied. Significantly different data are followed by different letters on the histogram columns of the same graph. TR, total removal.
Figure 8
Figure 8
Scheme of the experimental set-up for the hydroponic floating test. For each halophytic species (Suaeda fruticosa, Halocnemum strobilaceum, Juncus maritimus, and Phragmites australis), two mesocosms with two plants inside were used for each NaCl treatment. The single plant was the biological replicate, with four replicates per NaCl treatment (n = 4), two mesocosms per treatment, and ten mesocosms per species.

References

    1. Paul V.G., Mormile M.R. A case for the protection of saline and hypersaline environments: A microbiological perspective. FEMS Microbiol. Ecol. 2017;93:fix091. doi: 10.1093/femsec/fix091. - DOI - PubMed
    1. Tweedley J.R., Dittmann S.R., Whitfield A.K., Withers K., Hoeksema S.D., Potter I.C. Hypersalinity: Global distribution, causes, and present and future effects on the biota of estuaries and lagoons. In: Wolanski E., Day J.W., Elliott M., Ramachandran R., editors. Coasts and Estuaries: The Future. Elsevier; Amsterdam, The Netherlands: 2019. pp. 523–546. - DOI
    1. Zaman M., Shahid S.A., Heng L. Guideline for Salinity Assessment, Mitigation and Adaptation Using Nuclear and Related Techniques, Joint FAO/IAEA Programme Nuclear Techniques in Food and Agriculture. Springer Nature Switzerland AG; Cham, Switzerland: 2018. - DOI
    1. Jimoh A.A., Ikhimiukor O.O., Adeleke R. Prospects in the bioremediation of petroleum hydrocarbon contaminants from hypersaline environments: A review. Environ. Sci. Pollut. Res. Int. 2022;29:35615–35642. doi: 10.1007/s11356-022-19299-4. - DOI - PubMed
    1. FAO Food and Agriculture: Key to Achieving the 2030, Agenda for Sustainable Development. [(accessed on 19 December 2022)]. Job No. I5499, Food and Agriculture Organization of the United Nations 2016, Rome, 23. Available online: https://www.fao.org/3/i5499e/i5499e.pdf.

Grants and funding

LinkOut - more resources