. 2023 Apr 29;12(9):1840.
doi: 10.3390/plants12091840.

An In Vitro and In Vivo Assessment of Antitumor Activity of Extracts Derived from Three Well-Known Plant Species

Affiliations

An In Vitro and In Vivo Assessment of Antitumor Activity of Extracts Derived from Three Well-Known Plant Species

Octavia Gligor et al. Plants (Basel). .

Abstract

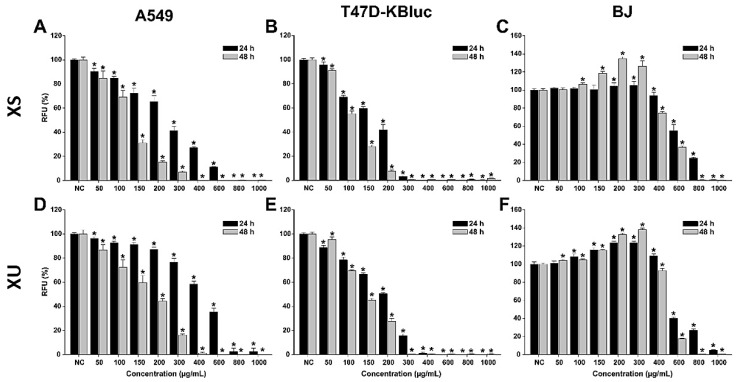
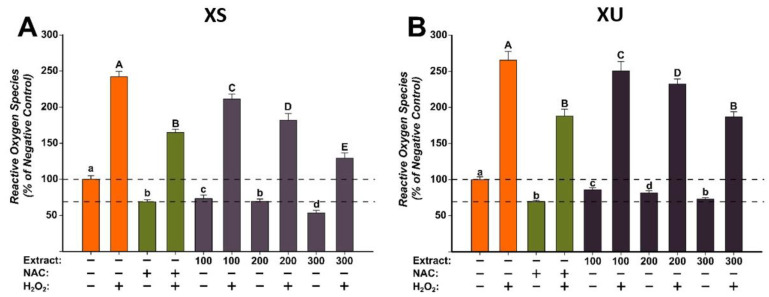
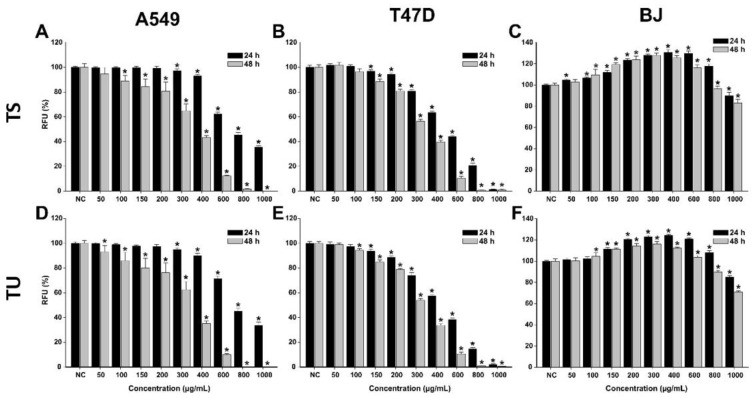
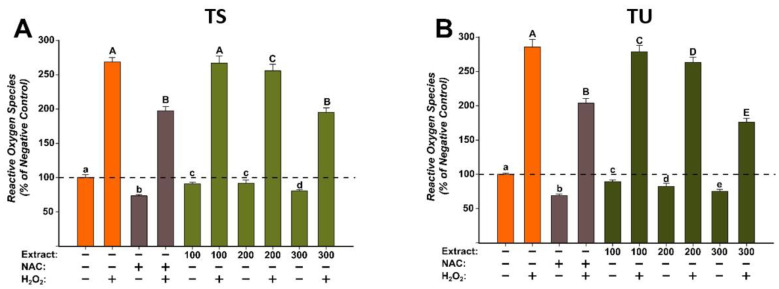
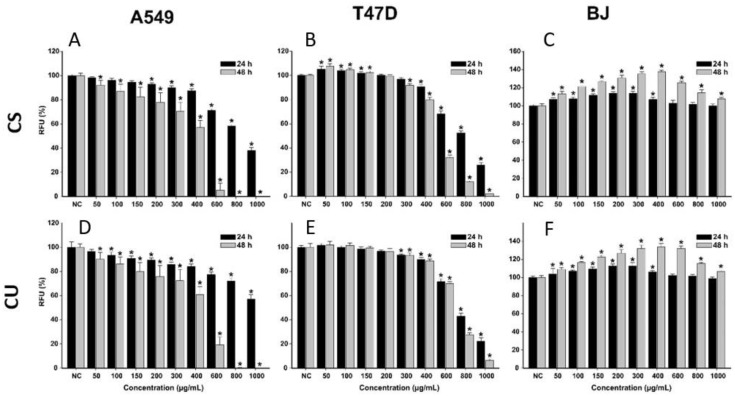
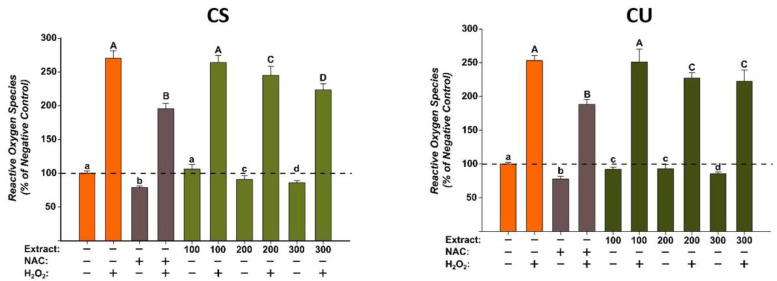
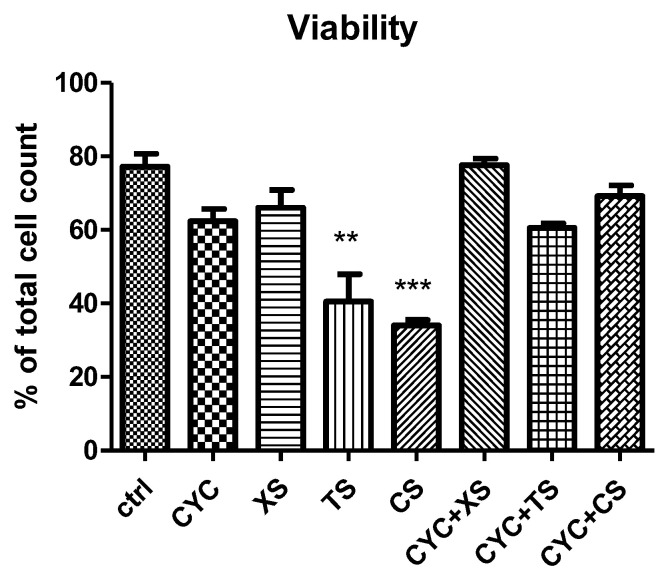
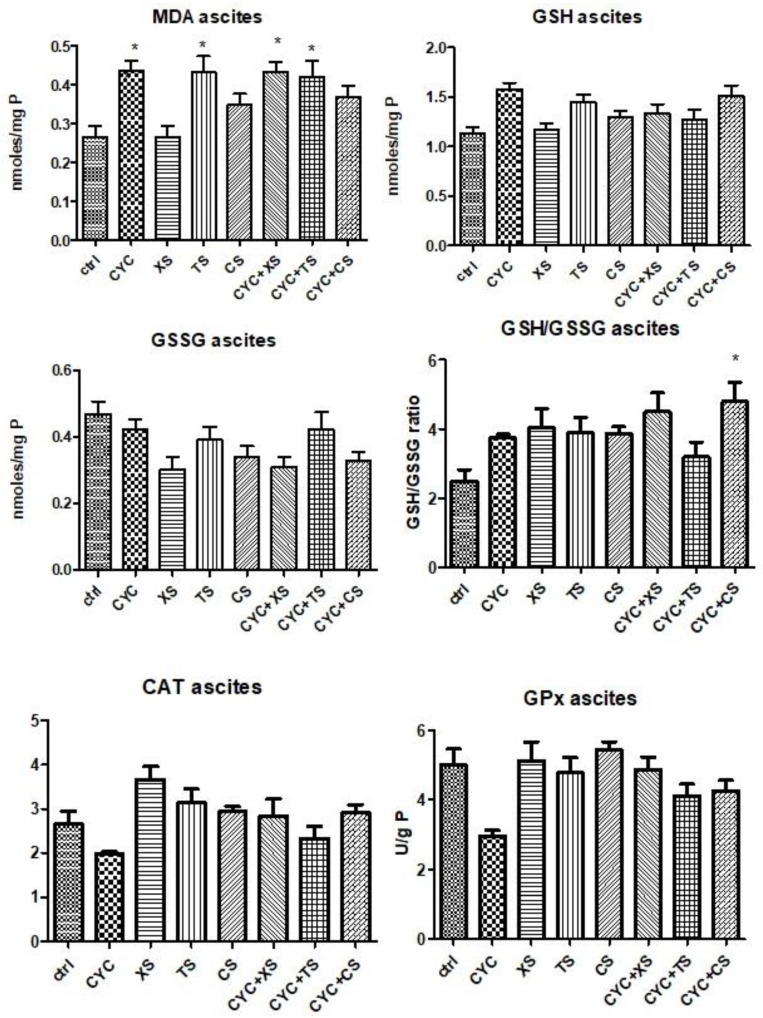
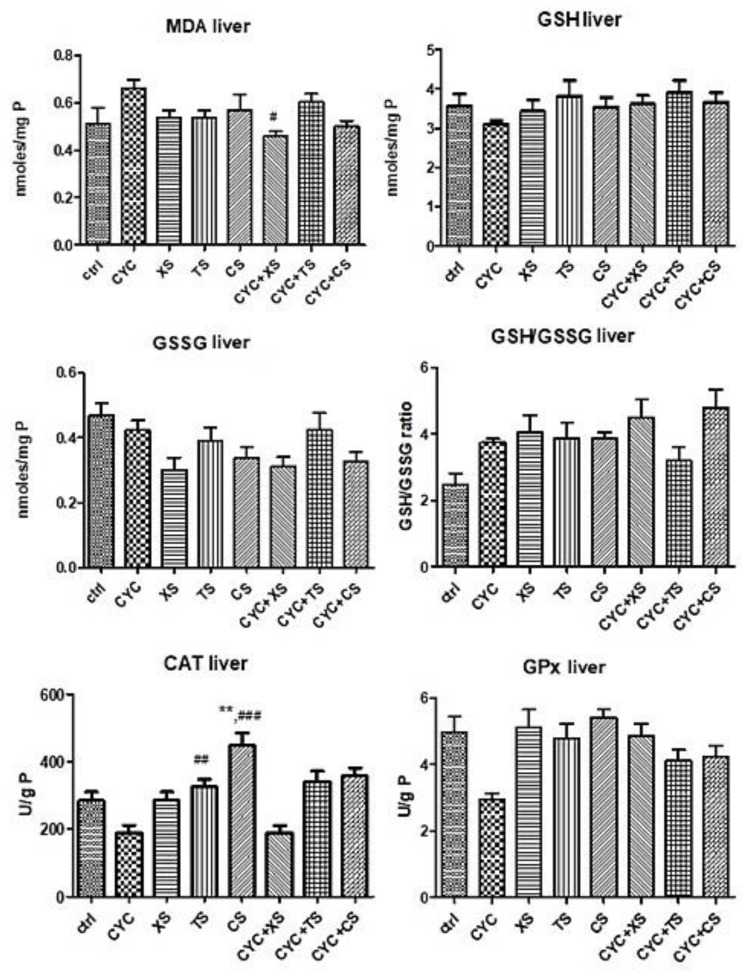
One of the objectives of this study consists of the assessment of the antitumor activity of several extracts from three selected plant species: Xanthium spinosum L., Trifolium pratense L., and Coffea arabica L. and also a comparative study of this biological activity, with the aim of establishing a superior herbal extract for antitumor benefits. The phytochemical profile of the extracts was established by HPLC-MS analysis. Further, the selected extracts were screened in vitro for their antitumor activity and antioxidant potential on two cancer cell lines: A549-human lung adenocarcinoma and T47D-KBluc-human breast carcinoma and on normal cells. One extract per plant was selected for in vivo assessment of antitumor activity in an Ehrlich ascites mouse model. The extracts presented high content of antitumor compounds such as caffeoylquinic acids in the case of X. spinosum L. (7.22 µg/mL-xanthatin, 4.611 µg/mL-4-O-caffeoylquinic acid) and green coffee beans (10.008 µg/mL-cafestol, 265.507 µg/mL-4-O-caffeoylquinic acid), as well as isoflavones in the case of T. pratense L. (6806.60 ng/mL-ononin, 102.78 µg/mL-biochanin A). Concerning the in vitro results, the X. spinosum L. extracts presented the strongest anticancerous and antioxidant effects. In vivo, ascites cell viability decreased after T. pratense L. and green coffee bean extracts administration, whereas the oxidative stress reduction potential was important in tumor samples after T. pratense L. Cell viability was also decreased after administration of cyclophosphamide associated with X. spinosum L. and T. pratense L. extracts, respectively. These results suggested that T. pratense L. or X. spinosum L. extracts in combination with chemotherapy can induce lipid peroxidation in tumor cells and decrease the tumor viability especially, T. pratense L. extract.

Keywords: Trifolium pratense; Xanthium spinosum; antioxidant activity; antitumor activity; caffeoylquinic acid; green coffee beans; isoflavones; xanthanolides.


Conflict of interest statement

The authors declare no conflict of interest.

Figures

Figure 1
Figure 1
Cytotoxic effects of the XS (AC) and XU (DF) XU extracts observed on A549 (A,D), T47D-KBluc (B,E), and BJ (C,F) cells using the Alamar Blue Assay. The results are presented as relative means ± standard deviations of three biological replicates, where the negative control (NC) is 100%. Asterisks (*) indicate a statistically significant difference (p < 0.05) in comparison with the NC. RFU—relative fluorescence units.
Figure 2
Figure 2
The antioxidant effect of the X. spinosum L. extracts was evaluated using DCFH-DA assay on BJ cells: (A)—Xanthium spinosum L. Soxhlet extract (XS); (B)—Xanthium spinosum L. UAE extract (XU). Cells were pre-exposed to the extracts (100, 200, and 300 µg/mL) or NAC (20 mM) for 24 h, and further incubated with 50 µM DCFH-DA. The antioxidant effect of the XS extracts was evaluated after 2 h in non-stimulated (HBSS) and stimulated conditions (250 µM H2O2). The data are expressed as relative means ± standard deviations (six technical replicates for each of the three biological replicates) where the negative control is 100%. Different letters (a–d refers to comparisons on non-stimulated conditions, whereas A–E refers to comparisons in stimulated conditions) indicate significant differences (ANOVA + Holm-Sidak post hoc, p < 0.05).
Figure 3
Figure 3
Cytotoxic effect of the TS (AC) and TU (DF) observed using Alamar Blue assay on A549 (A,D), T47D-KBluc (B,E), and BJ (C,F) cells. The results are expressed as relative means ± standard deviations (six technical replicates for each of the three biological replicates), where the negative control (DMSO 0.2%) is 100%. Asterisks (*) indicate a significant difference (p < 0.05) in comparison with the negative control. RFU—relative fluorescence units.
Figure 4
Figure 4
The antioxidant effect of the T. pratense L.: (A)—Trifolium pratense L. Soxhlet extract (TS) and (B)—Trifolium pratense L. UAE extract (TU) was evaluated using DCFH-DA assay on BJ cells. Cells were pre-exposed to the extracts (100, 200, and 300 µg/mL) or NAC (20 mM) for 24 h, and further incubated with 50 µM DCFH-DA. The antioxidant effect of the T. pratense L. extracts was evaluated after 2 h in non-stimulated (HBSS) and stimulated conditions (250 µM H2O2). The data are expressed as relative means ± standard deviations (6 technical replicates for each of the three biological replicates) where the negative control is 100%. Different letters (a–e refers to comparisons on non-stimulated conditions, whereas A–E refers to comparisons in stimulated conditions) indicate significant differences (ANOVA + Holm-Sidak post hoc, p < 0.05).
Figure 5
Figure 5
Cytotoxic effect of the CS (AC) and CU (DF) on A549 (A,D), T47D-KBluc (B,E), and BJ (C,F) cells. Data are presented as relative means ± standard deviations (6 technical replicates for each of the three biological replicates), where the negative control (NC) is 100%. Asterisks (*) mark a significant difference (p < 0.05) in comparison with the NCRFU–relative fluorescence units.
Figure 6
Figure 6
The antioxidant effect of the CS and CU extracts was evaluated using DCFH-DA assay on normal fibroblast cells (BJ). Cells pre-exposed for 24 h to the extracts (100, 200, and 300 µg/mL) or NAC (20 mM), were further incubated with 50 µM DCFH-DA. The antioxidant properties of the CA extracts were measured after 2 h in non-stimulated (HBSS) and stimulated conditions (250 µM H2O2). The data are presented as relative means ± standard deviations of three biological replicates (six technical replicates/biological replicate) in comparison with the negative control (100%). Different letters (non-stimulated conditions (a–d) and stimulated conditions (A–D)) mark significant differences (ANOVA + Holm-Sidak post hoc, p < 0.05).
Figure 7
Figure 7
Cell viability. Values are means ± SD. Statistical analysis was performed using a one-way ANOVA, with Tukey’s multiple comparisons post-test (** p < 0.01 and *** p < 0.001 vs. control group).
Figure 8
Figure 8
Oxidative stress markers (MDA levels, GSG/GSSG ratio, CAT, and GPx activities) from the mice ascites samples after a 10-day treatment with CYC, XS, TS, CS, and associations of CYC and each of the separate extracts (Values are means ± SD. Statistical analysis was performed using a one-way ANOVA, with Tukey’s multiple comparisons post-test (* p < 0.05 vs. control group).
Figure 9
Figure 9
Oxidative stress markers (MDA levels, GSG/GSSG ratio, CAT, and GPx activities) from the mice liver samples after a 10-day treatment with CYC, XS, TS, CS, and associations of CYC and each of the separate extracts (Values are means ± SD. Statistical analysis was performed using a one-way ANOVA, with Tukey’s multiple comparisons post-test (** p < 0.01 vs. control group, and # p < 0.05, ## p < 0.01, ### p < 0.001 vs. CYC group).

References

    1. Hanahan D. Hallmarks of cancer: New dimensions. Cancer Discov. 2022;12:31–46. doi: 10.1158/2159-8290.CD-21-1059. - DOI - PubMed
    1. Chhikara B.S., Parang K. Global Cancer Statistics 2022: The trends projection analysis. [(accessed on 27 March 2023)];Chem. Biol. Lett. 2023 10:451. Available online: https://pubs.thesciencein.org/cbl.
    1. Esmeeta A., Adhikary S., Dharshnaa V., Swarnamughi P., Ummul Maqsummiya Z., Banerjee A., Pathak S., Duttaroy A.K. Plant-derived bioactive compounds in colon cancer treatment: An updated review. Biomed. Pharmacother. 2022;153:113384. doi: 10.1016/j.biopha.2022.113384. - DOI - PubMed
    1. do Carmo M.A.V., Pressete C.G., Marques M.J., Granato D., Azevedo L. Polyphenols as potential antiproliferative agents: Scientific trends. Curr. Opin. Food Sci. 2018;24:26–35. doi: 10.1016/j.cofs.2018.10.013. - DOI
    1. Liu W., Li J., Zhang X., Zu Y., Yang Y., Liu W., Xu Z., Gao H., Sun X., Jiang X., et al. Current advances in naturally occurring caffeoylquinic acids: Structure, bioactivity, and synthesis. J. Agric. Food Chem. 2020;68:10489–10516. doi: 10.1021/acs.jafc.0c03804. - DOI - PubMed

LinkOut - more resources