Review
. 2023 May 7;15(9):2214.
doi: 10.3390/polym15092214.

Nafion: New and Old Insights into Structure and Function

Affiliations
Review

Nafion: New and Old Insights into Structure and Function

Barry W Ninham et al. Polymers (Basel). .

Abstract

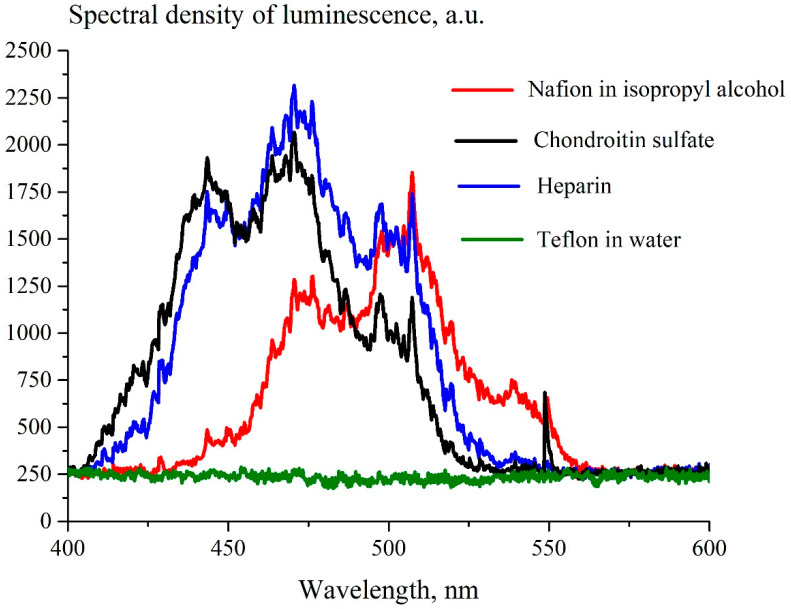
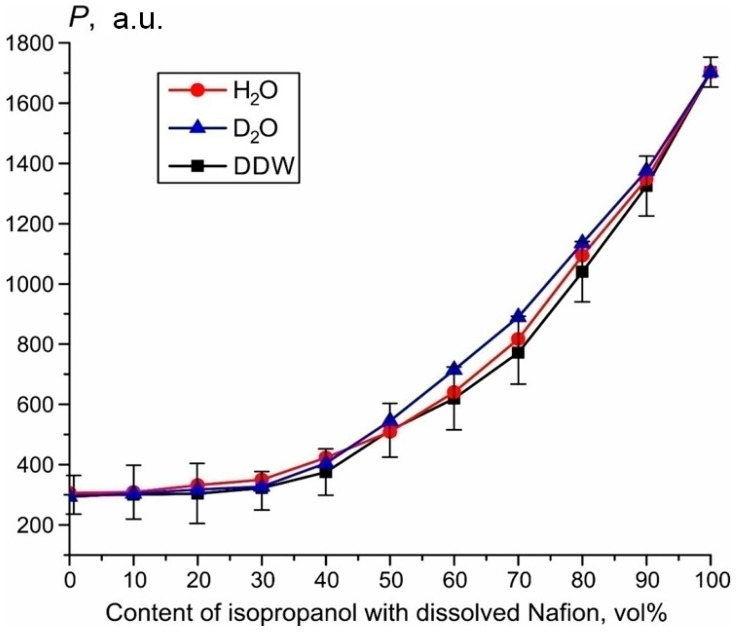
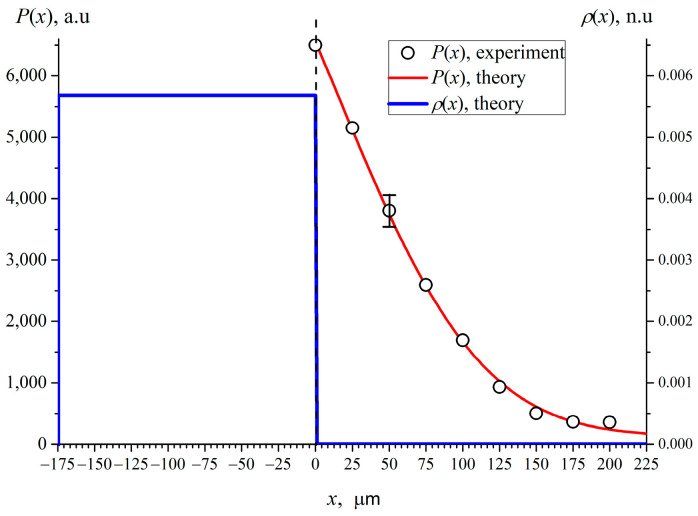
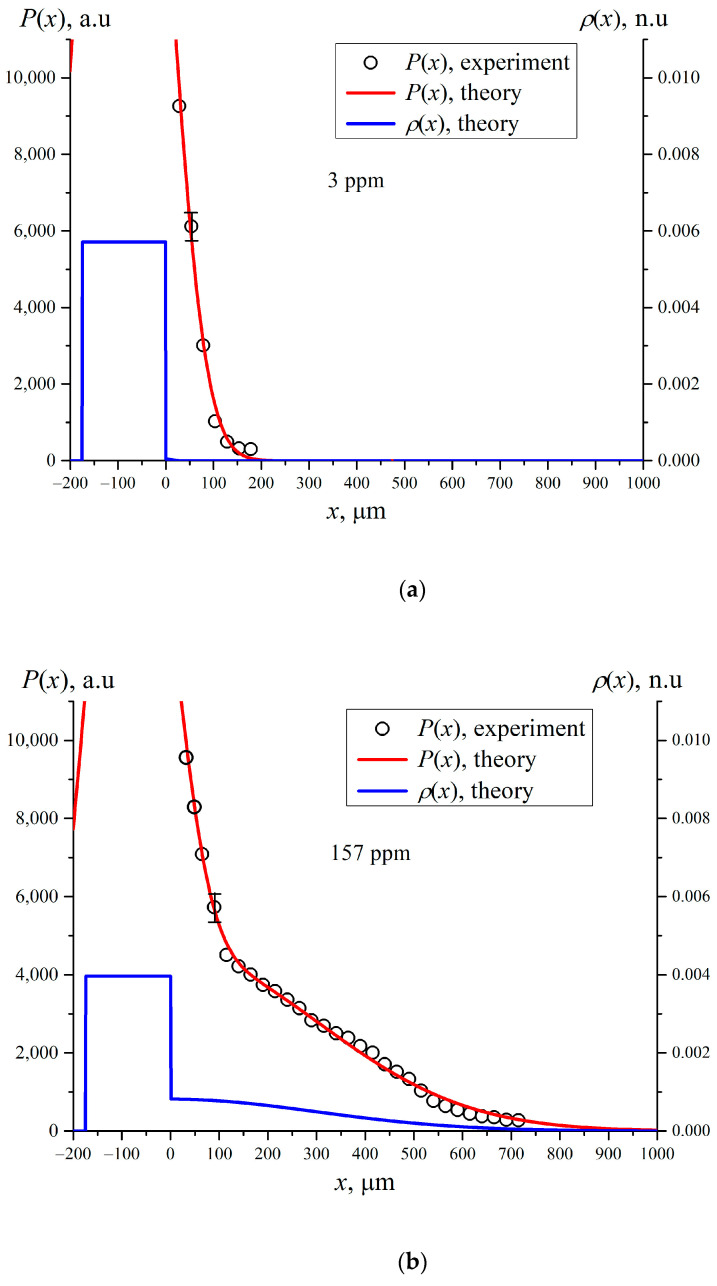
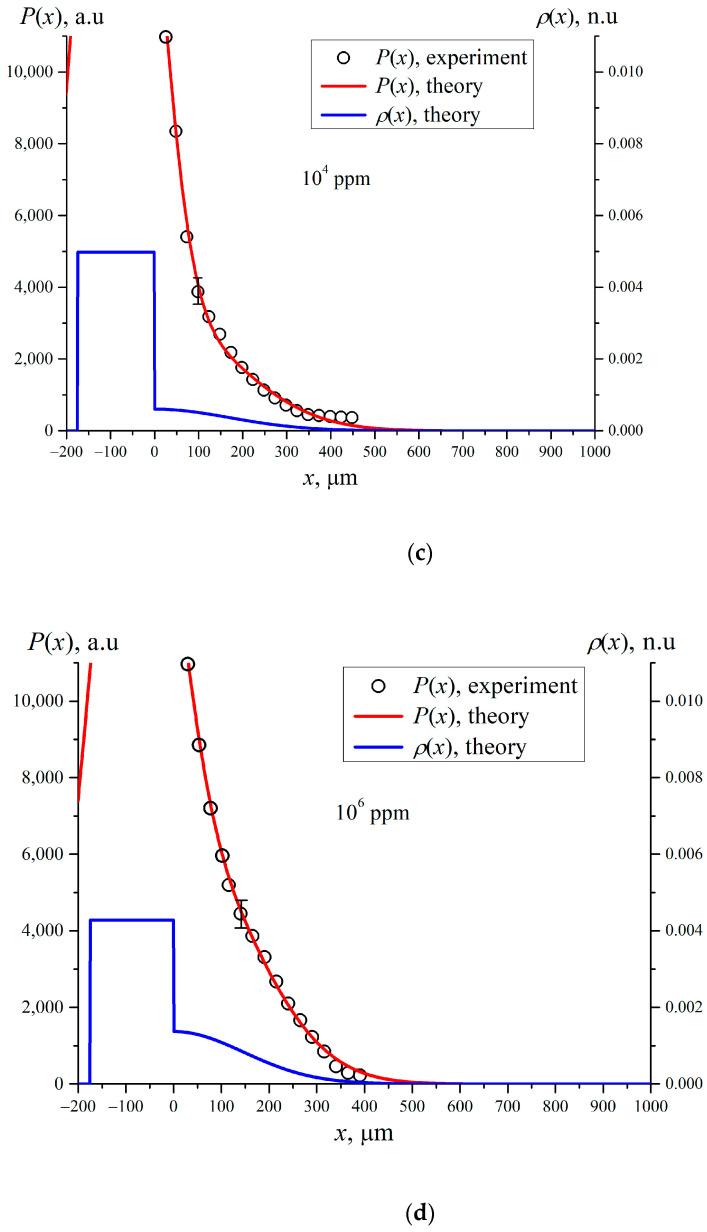
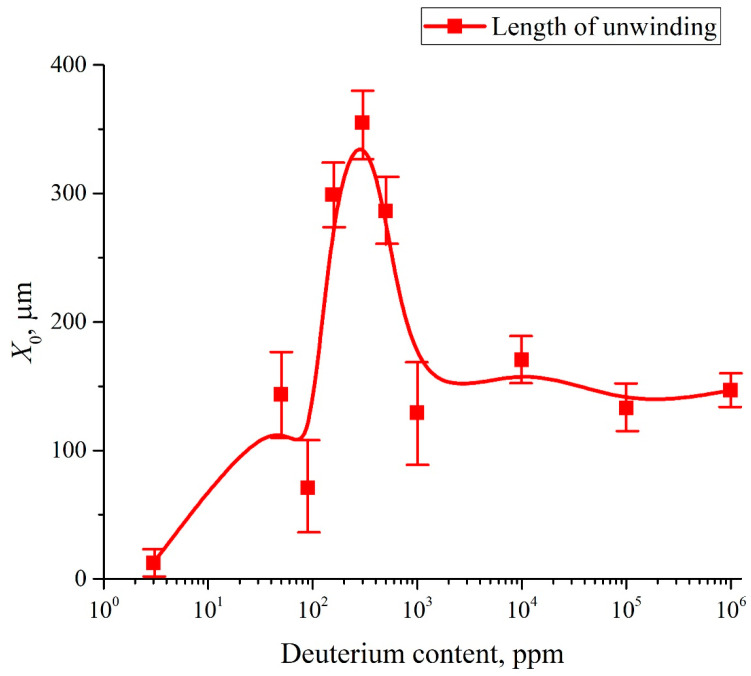
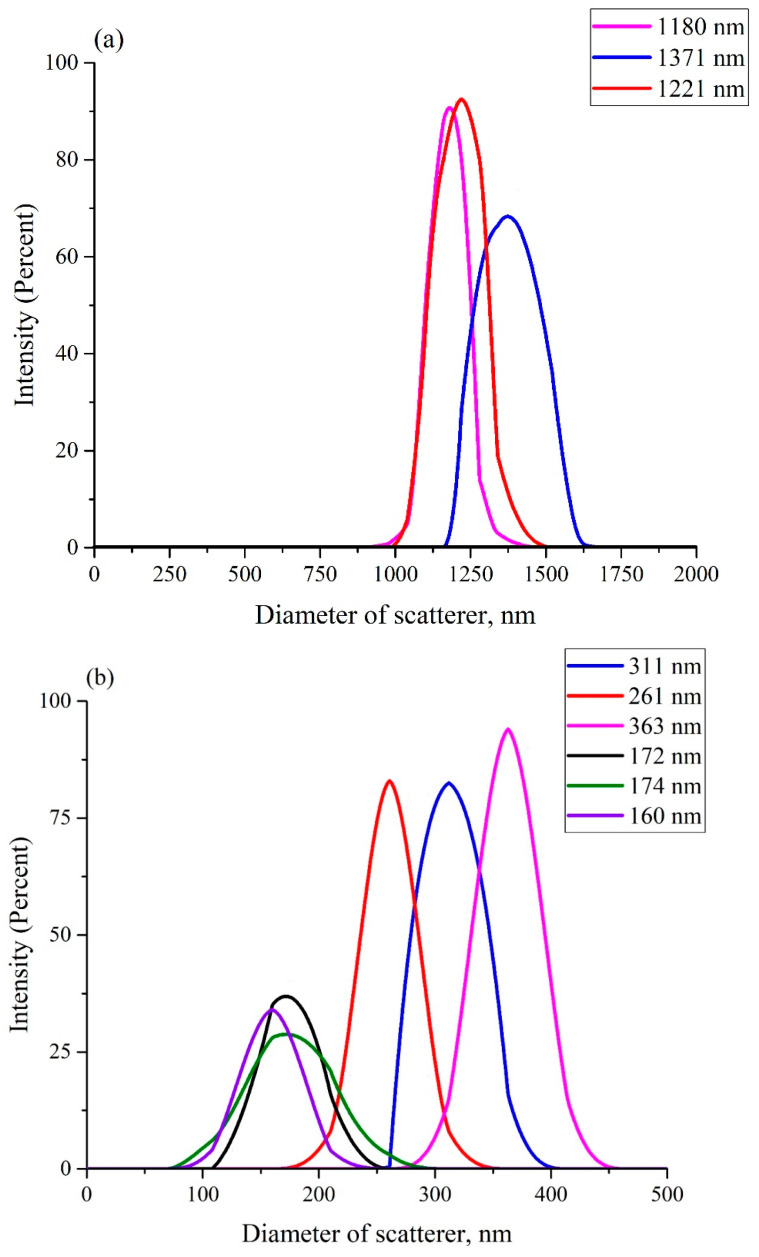
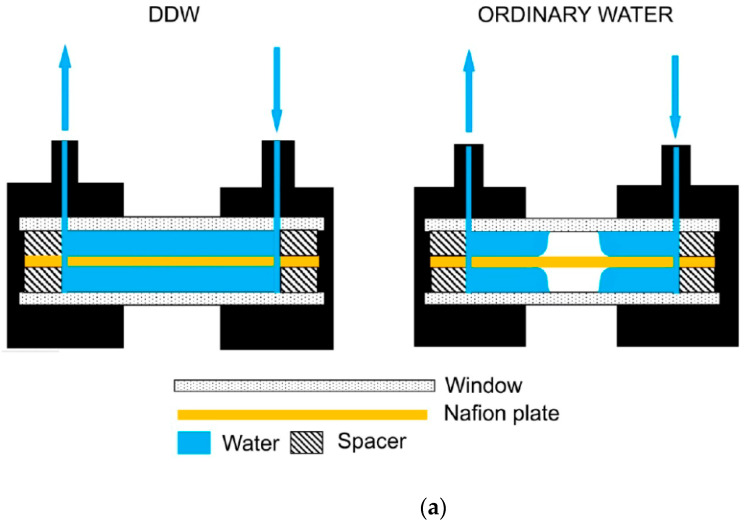
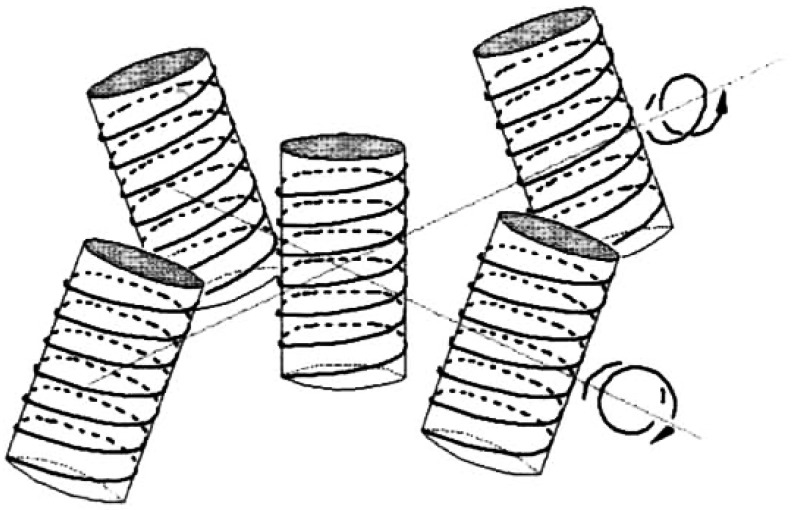
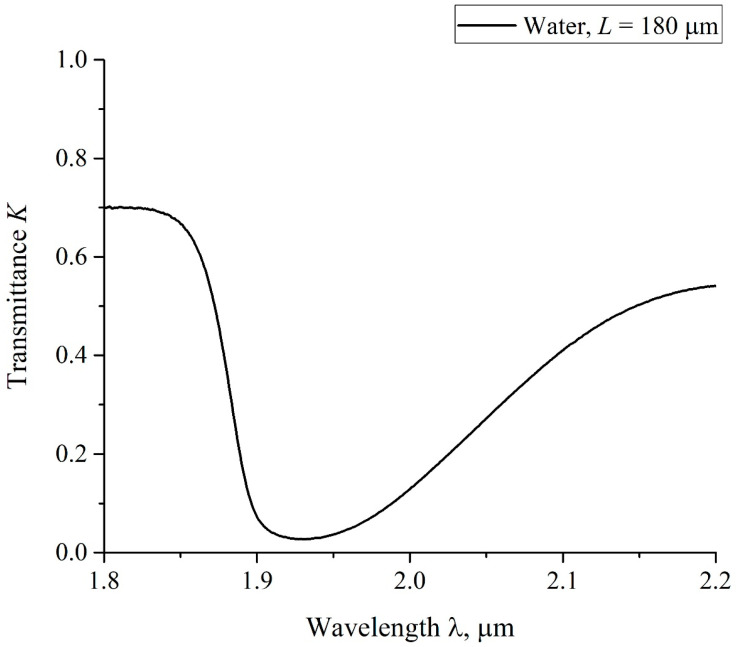
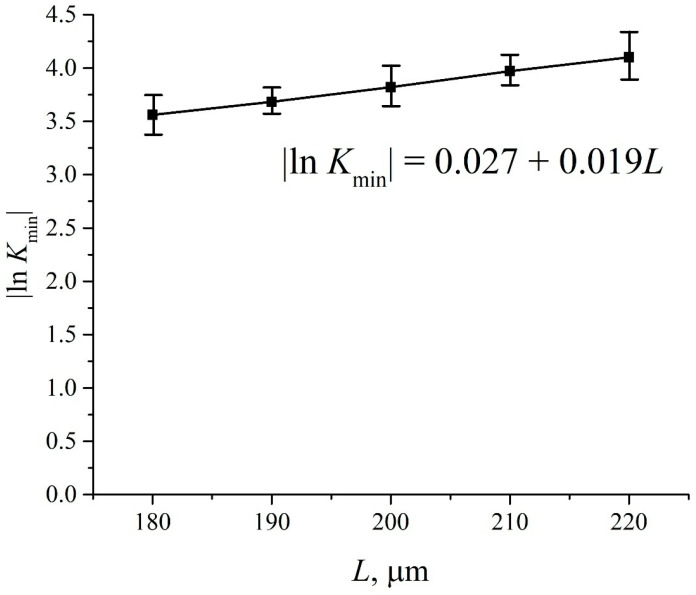
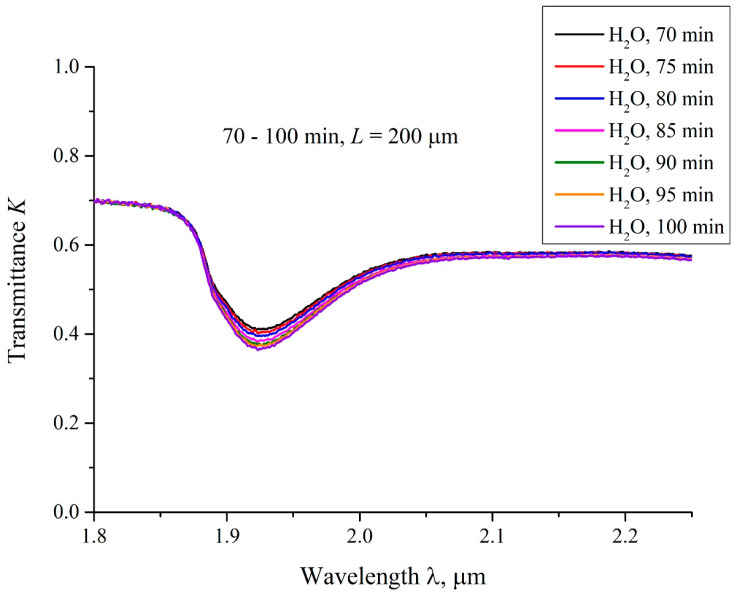
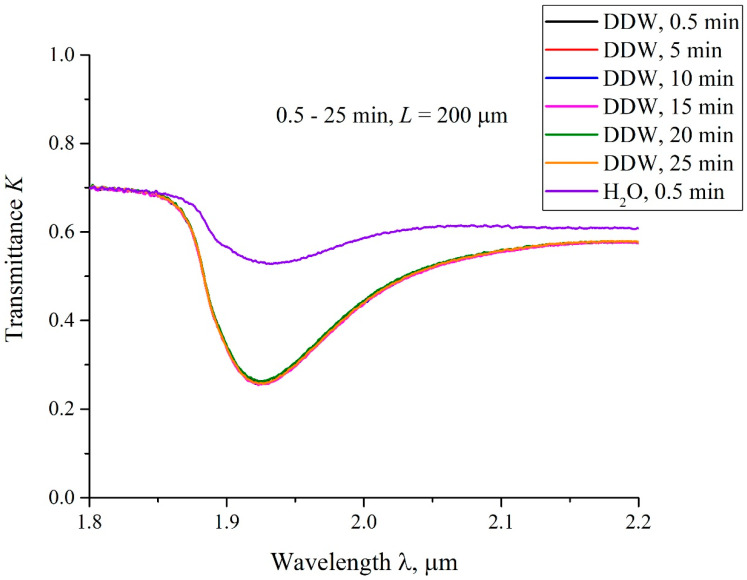
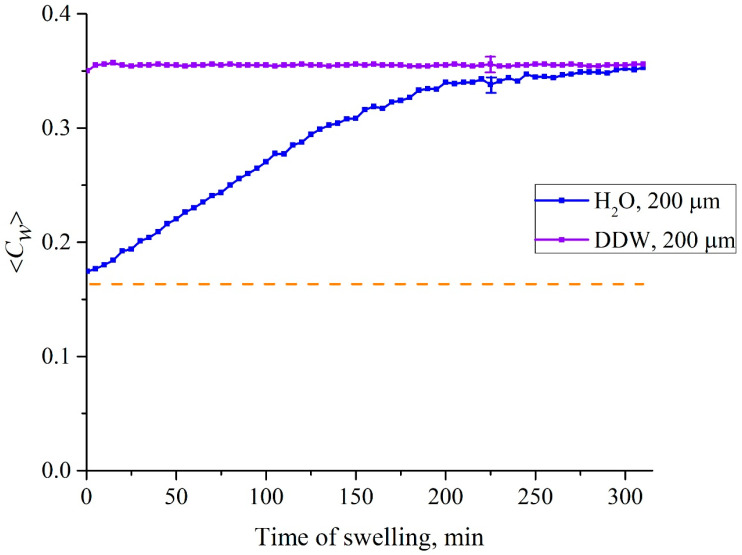
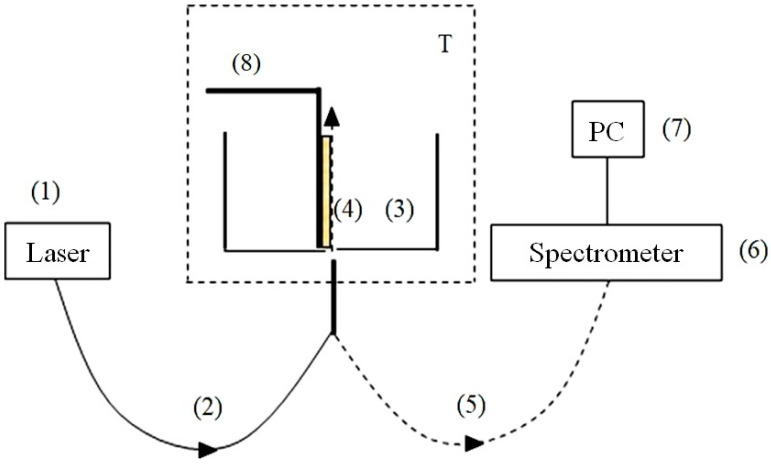
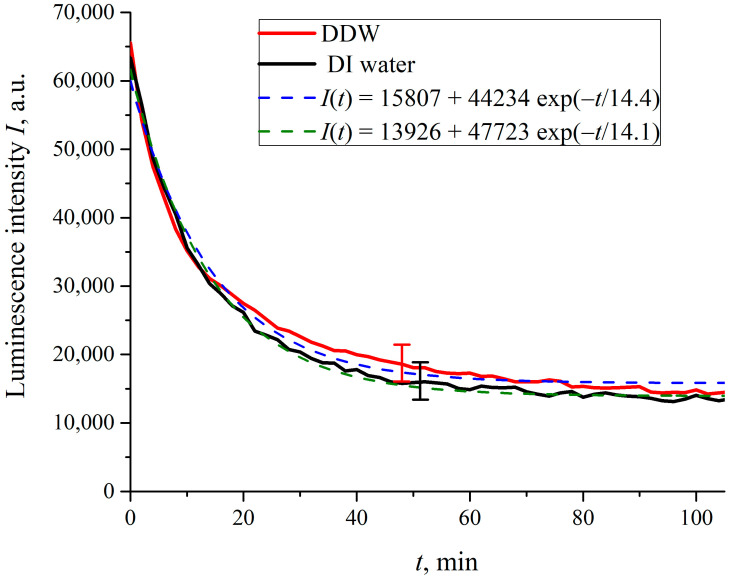
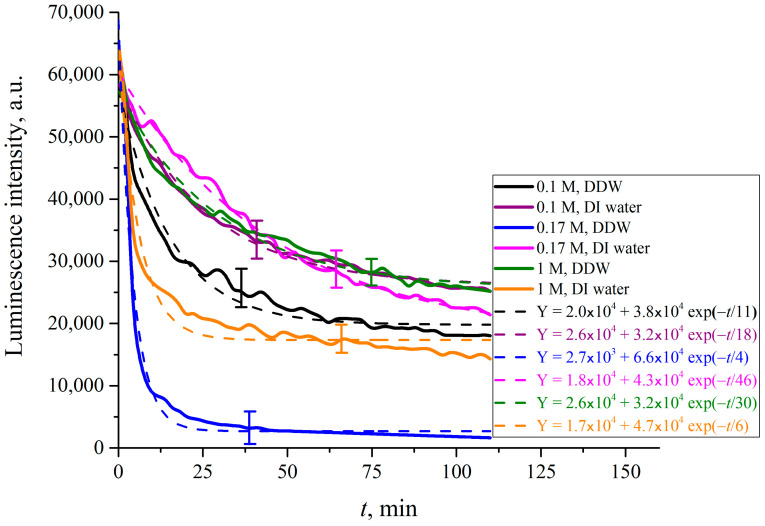
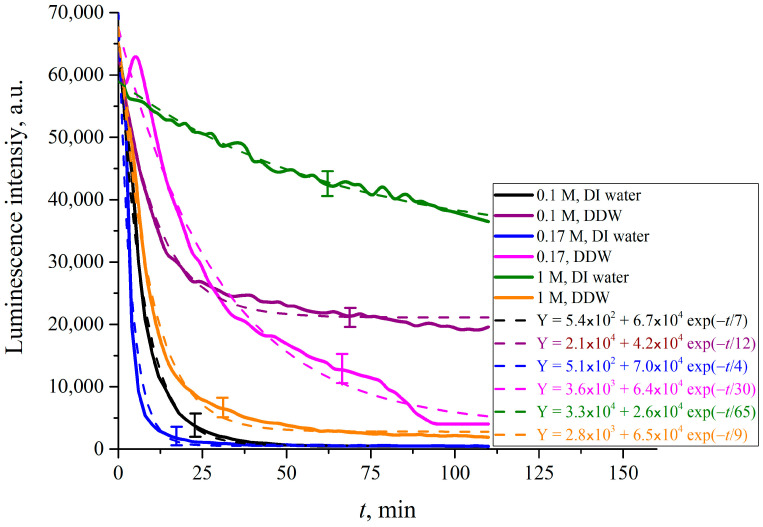
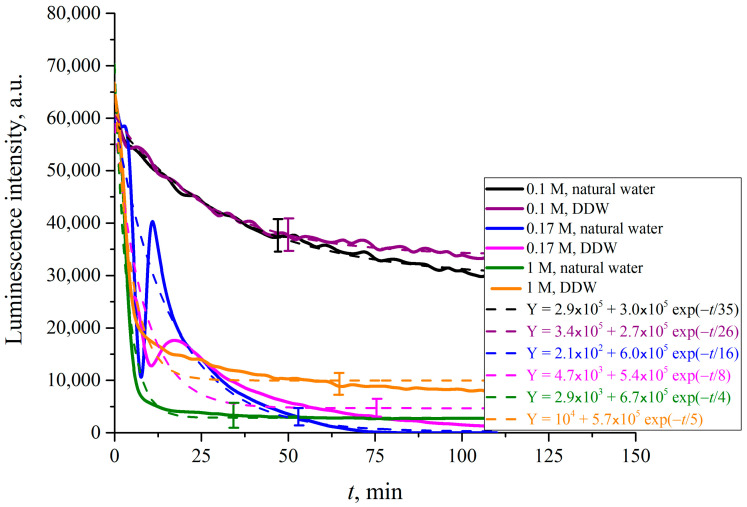
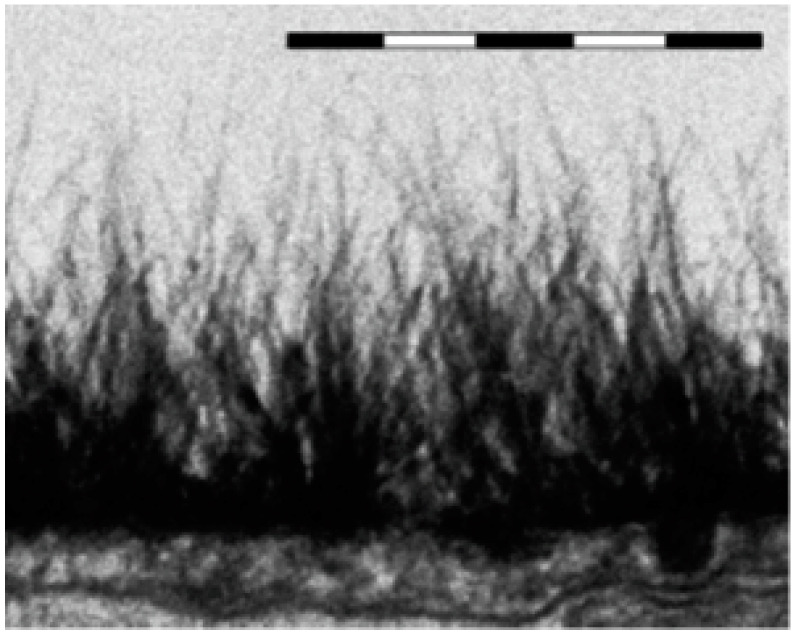
The work reports a number of results on the dynamics of swelling and inferred nanostructure of the ion-exchange polymer membrane Nafion in different aqueous solutions. The techniques used were photoluminescent and Fourier transform IR (FTIR) spectroscopy. The centers of photoluminescence were identified as the sulfonic groups localized at the ends of the perfluorovinyl ether (Teflon) groups that form the backbone of Nafion. Changes in deuterium content of water induced unexpected results revealed in the process of polymer swelling. In these experiments, deionized (DI) water (deuterium content 157 ppm) and deuterium depleted water (DDW) with deuterium content 3 PPM, were investigated. The strong hydration of sulfonic groups involves a competition between ortho- and para-magnetic forms of a water molecule. Deuterium, as it seems, adsorbs competitively on the sulfonic groups and thus can change the geometry of the sulfate bonds. With photoluminescent spectroscopy experiments, this is reflected in the unwinding of the polymer fibers into the bulk of the adjoining water on swelling. The unwound fibers do not tear off from the polymer substrate. They form a vastly extended "brush" type structure normal to the membrane surface. This may have implications for specificity of ion transport in biology, where the ubiquitous glycocalyx of cells and tissues invariably involves highly sulfated polymers such asheparan and chondroitin sulfate.

Keywords: Fourier transform IR spectroscopy; Nafion; deuterium-depleted water; endothelial surface layer; exclusion zone; fuel cells; photoluminescence spectroscopy; specific electrolyte (Hofmeister) effects; swelling of polymer membrane; unwinding of polymer fibers.


Conflict of interest statement

The authors declare no conflict of interest.

Figures

Figure 1
Figure 1
Cryo-SEM micrograph of an iso-octane/DDAB surfactant/water microemulsion. Component ratios by weight are (48:32:20) microemulsion. The bar corresponds to 100 nm. Reprinted from [16] with permission.
Figure 2
Figure 2
Details of the microstructure of micro emulsion formed from double chained cationic surfactant didodecyl dimethyl ammonium bromide (DDAB) water and alkane. Multiply connected nanotubes of water are coated with surfactant. These structures mimic the helical water tubes that form in bulk swollen Nafion. Adapted from [17,18] with permission.
Figure 3
Figure 3
The absorptivity spectrum for dry Nafion.
Figure 4
Figure 4
Luminescence spectra of dry Nafion irradiated at the wavelengths λ = 266 nm (blue curve) and 369 nm (red curve).
Figure 5
Figure 5
Luminescence spectra of Nafion, dissolved in isopropanol (red curve), aqueous solution of heparin sulfate (blue curve), aqueous solution of chondroitin sulfate (black curve) and Teflon in water (green straight line).The wavelength of the optical pump λ = 369 nm.
Figure 6
Figure 6
Dependence of the luminescence intensity in its spectral maximum vs. the content of Nafion, dissolved in isopropanol.
Figure 7
Figure 7
Luminescence signal P when Nafion solution in isopropanol is diluted with DDW (black curve), DI water (red curve) and D2O (blue curve).
Figure 8
Figure 8
Schematic of the experimental setup for laser photoluminescence spectroscopy; first protocol. (1)—Laser diode (optical pumping); (2)—multimode optical fiber for transferring the pump radiation; (3)—cell for liquid samples; (4)—Nafion plate; (5)—multimode optical fiber for transferring the luminescence radiation; (6)—minispectrometer; (7)—computer; (8)—stepper motor for fine adjusting the position of the Nafion plate with respect to the optical axis.
Figure 9
Figure 9
Dependence of the luminescence intensity P(x) for dry Nafion. Circles are the experimental points, the red curve is the theoretical approximation to the experimental dependence, the blue line is the normalized distribution of ρ(x).
Figure 10
Figure 10
Dependencies of P(x) and ρ(x) for Nafion swollen in water with different deuterium content. The black circles are related to the experimental points P(x), the red curves represent the theoretical approximation, the blue curves are the theoretical density distribution ρ(x) of Nafion in the liquid bulk. Panel (a) is related to deuterium content 3 ppm (DDW); Panel (b) is related to deuterium content 157 ppm (DI water); Panel (c) is related to deuterium content 103 ppm and panel (d) is related to deuterium content 106 ppm (D2O).
Figure 10
Figure 10
Dependencies of P(x) and ρ(x) for Nafion swollen in water with different deuterium content. The black circles are related to the experimental points P(x), the red curves represent the theoretical approximation, the blue curves are the theoretical density distribution ρ(x) of Nafion in the liquid bulk. Panel (a) is related to deuterium content 3 ppm (DDW); Panel (b) is related to deuterium content 157 ppm (DI water); Panel (c) is related to deuterium content 103 ppm and panel (d) is related to deuterium content 106 ppm (D2O).
Figure 11
Figure 11
Dependence of the size of the unwound area in the bulk liquid vs. deuterium content.
Figure 12
Figure 12
Histograms of hydrodynamic diameters of scatterers in DLS experiment. Panel (a)—DI water. Panel (b)—deuterium-depleted water.
Figure 13
Figure 13
Schematic of Fourier spectrometer FSM 2201. 1—Source of IR radiation; 2, 9, 10, 11—Off-axis parabolic mirrors; 3, 4—Beam splitter and compensator (transparent in the IR range); 5—Fixed (stationary) reflector; 6—Movable reflector; 7—He-Ne laser; 8—Receiver of laser radiation; 12—Cell with liquid sample; 13—IR receiver.
Figure 14
Figure 14
The cell used in our FTIR spectrometry experiments. Panel (a)—Schematic drawing of the cell design for filling with DDW and DI water. Panel (b)—Photo of the cell immediately after filling with DI water. The inlet/outlet holes are highlighted in red. The empty cavity is clearly seen. Panel (c)—Photo of the cell immediately after filling with DDW. The inlet/outlet holes are highlighted in red. The empty cavity is absent. Panel (d)—Photo of the Nafion plates used in FTIR experiments. The Nafion plates, used in our experiment, are approximately the same.
Figure 14
Figure 14
The cell used in our FTIR spectrometry experiments. Panel (a)—Schematic drawing of the cell design for filling with DDW and DI water. Panel (b)—Photo of the cell immediately after filling with DI water. The inlet/outlet holes are highlighted in red. The empty cavity is clearly seen. Panel (c)—Photo of the cell immediately after filling with DDW. The inlet/outlet holes are highlighted in red. The empty cavity is absent. Panel (d)—Photo of the Nafion plates used in FTIR experiments. The Nafion plates, used in our experiment, are approximately the same.
Figure 15
Figure 15
The ideal (left-handed) double-twist configuration of neighboring molecules about a central chiral molecule. For simplicity, a square arrangement of molecules is assumed; in practice, the array is more likely to be hexagonal (adapted from Figure 4.32, Ref. [47] with permission).
Figure 16
Figure 16
The transmittance K for water in the spectral range 1.8 < λ < 2.2 μm; the distance between the cell windows L = 180 μm.
Figure 17
Figure 17
Dependence |lnKmin|, taken at the wavelength λ = 1.93 μm, vs. the distance L between the cell windows for DI water. The value of Kmin is related to the spectral minimum of the graph in Figure 16. The dependence |lnKmin| vs. L is well approximated by function |lnKmin| = 0.027 +0.019⋅L.
Figure 18
Figure 18
The transmittance spectra in the range 1.8 < λ < 2.2 μm for the case of Nafion swellingin DI water; the distance between the windows L = 200 μm, the curves are related to the swelling times t = 70, 75, 80, 85, 90, 95 and 100 min.
Figure 19
Figure 19
The transmittance spectra K in the IR range 1.8 < λ < 2.2 μm for the Nafion plate swelling in DDW in the cell, having the distance between the windows L = 200 μm. The graphs are related to the times of swelling t = 0.5, 5, 10, 15, 20 and 25 min. The upper curve is related to the transmittance spectrum K for DI water, the time of swelling is equal to 0.5 min.
Figure 20
Figure 20
Concentration of water 〈Cw(t)〉 vs. swelling time t, averaged over the distance L = 200 μm between the windows of the cell. The graphs are for DI water (blue curve) and DDW (magenta curve). The horizontal dashed line is related to the concentration water for dry Nafion (Cw)0 = 0.174 (baseline).
Figure 21
Figure 21
The concentration of water 〈Cw(t)〉, averaged over the distance L between the windows of the cell, as a function of the swelling time t for DI water. The samples of this water were obtained on different days from various Milli-Q devices. The horizontal dashed line is related to the concentration of water for dry Nafion (Cw)0 = 0.174 (baseline).
Figure 22
Figure 22
Dependence of the average concentration 〈Cw(t)〉 for LiCl, NaCl, KCl and CsCl solutions; the ionic content is equal to 0.1 M. The reference dependence 〈Cw(t)〉 for DI water is also shown.
Figure 23
Figure 23
Schematic of the experimental setup for laser photoluminescence spectroscopy; second protocol. (1)—Laser for optical pumping; (2)—multimode optical fiber for transferring the pump radiation; (3)—Teflon cell for liquid samples; (4)—Nafion plate; (5)—multimode optical fiber for transferring the luminescence radiation; (6)—mini-spectrometer; (7)—computer; (8)—stepper motor.
Figure 24
Figure 24
Intensity of luminescence I(t) vs. the time t of soaking in DI water and in DDW.
Figure 25
Figure 25
Luminescence intensity I(t) vs. the time t of soaking in the solutions of LiCl, based on DI water and DDW.
Figure 26
Figure 26
Luminescence intensity I(t) vs. the time t of soaking in the solutions of NaCl, based on DI water and DDW.
Figure 27
Figure 27
Luminescence intensity I(t) vs. the time t of soaking in the solutions of KCl, based on DI water and DDW.
Figure 28
Figure 28
Luminescence intensity I(t) vs. the time t of soaking in the solutions of CsCl, based on DI water and DDW.
Figure 29
Figure 29
Electron microscopy pattern of the endothelial glycocalyx in rat myocardial capillary (bar = 0.5 μm). Reprinted from Figure 1c, Ref. [62] with permission from H. Vink et al., Copyright 2003, AHA Journals.

Similar articles

Cited by

References

    1. Kusoglu A., Weber A.Z. New Insights into Perfluorinated Sulfonic-Acid Ionomers. Chem. Rev. 2017;117:987–1104. doi: 10.1021/acs.chemrev.6b00159. - DOI - PubMed
    1. Safronova E.Y., Voropaeva D.Y., Novikova S.A., Yaroslavtsev A.B. On the Influence of Solvent and Ultrasonic Treatment on Properties of Cast Nafion (R) Membranes. Membr. Technol. 2022;4:39–47. doi: 10.1134/S2517751622010073. - DOI
    1. Yu X., Chen X.D., Yu X.L., Chen X.P., Ding X., Zhao X., Tang K. Ultrahighly Sensitive QCM Humidity Sensor Based on Nafion/MoS2 Hybrid Thin Film. IEEE Trans. Electron Devices. 2022;69:1321–1326. doi: 10.1109/TED.2021.3137088. - DOI
    1. Song X.W., Mofidfar M., Zare R.N. Introducing Nafion for In Situ Desalting and Biofluid Profiling in Spray Mass Spectrometry. Front. Chem. 2022;9:807244. doi: 10.3389/fchem.2021.807244. - DOI - PMC - PubMed
    1. Mehmandoust M., Mehmandoust A., Erk N. Construction of a simple and selective electrochemical sensor based on Nafion/TiO2 for the voltammetric determination of olopatadine. J. Electrochem. Sci. Eng. 2022;12:91–103. doi: 10.5599/jese.1117. - DOI

LinkOut - more resources