

Automatic Branch-Leaf Segmentation and Leaf Phenotypic Parameter Estimation of Pear Trees Based on Three-Dimensional Point Clouds
- PMID: 37177776
- PMCID: PMC10181666
- DOI: 10.3390/s23094572
Automatic Branch-Leaf Segmentation and Leaf Phenotypic Parameter Estimation of Pear Trees Based on Three-Dimensional Point Clouds
Abstract
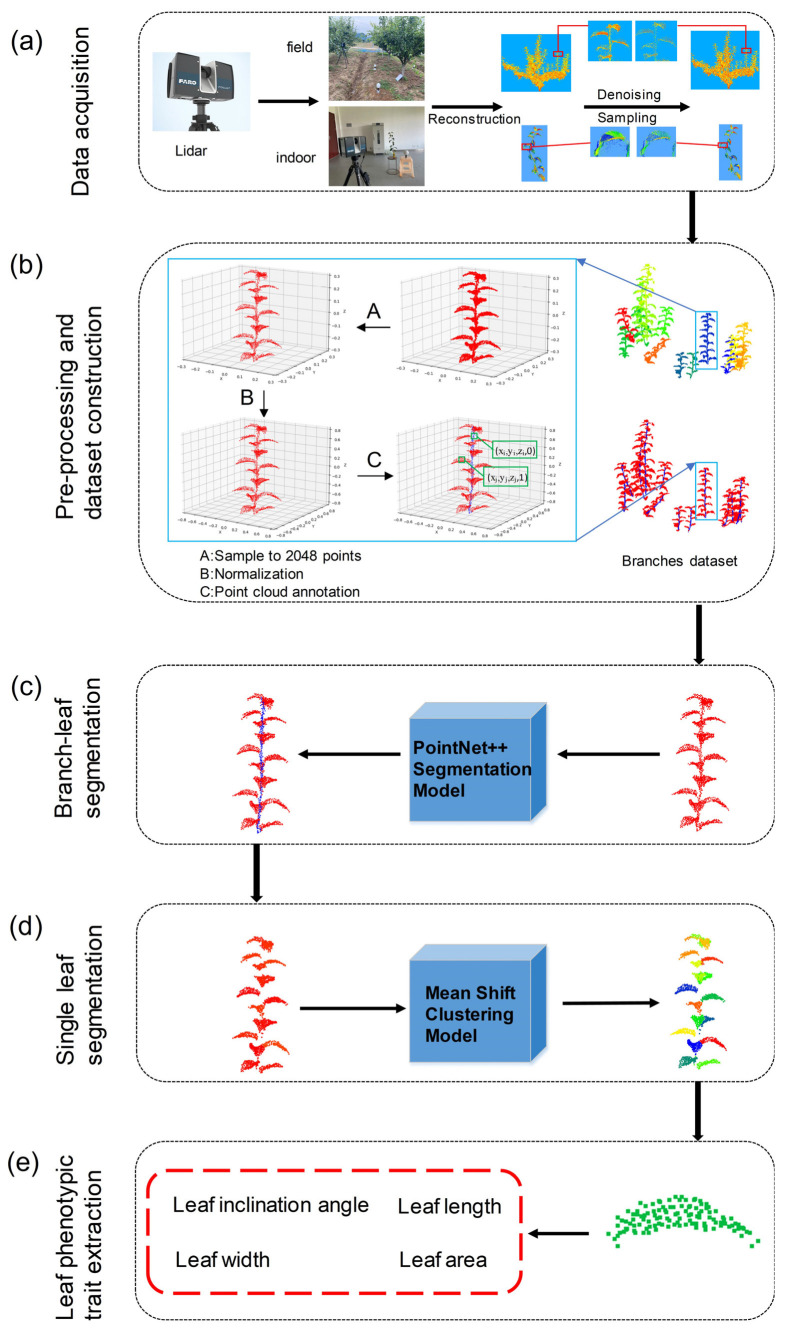
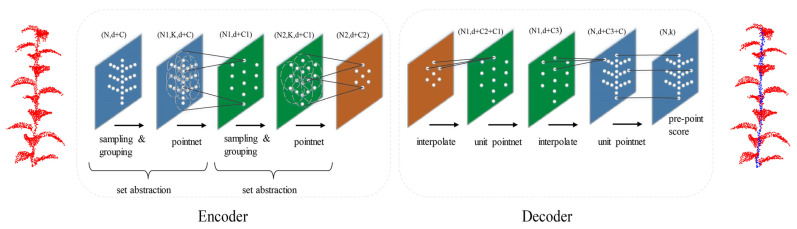
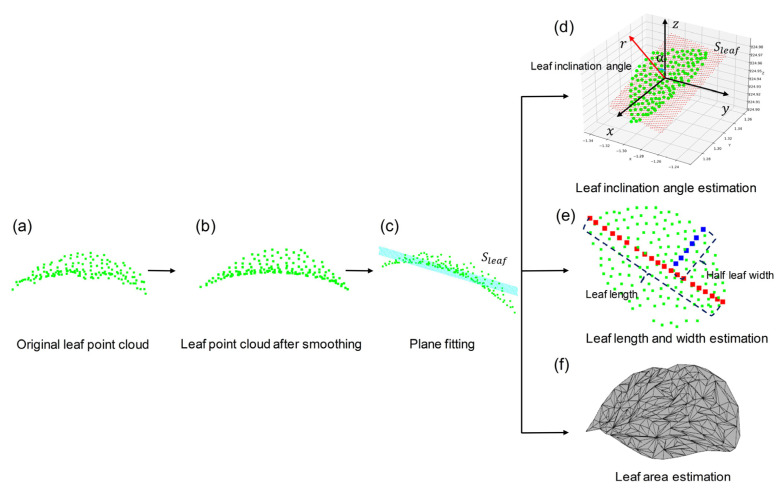
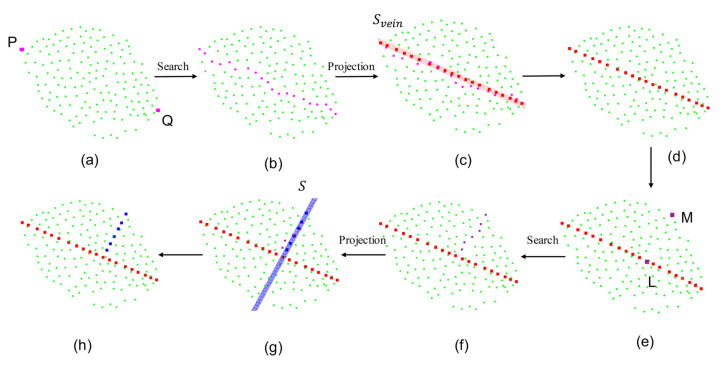
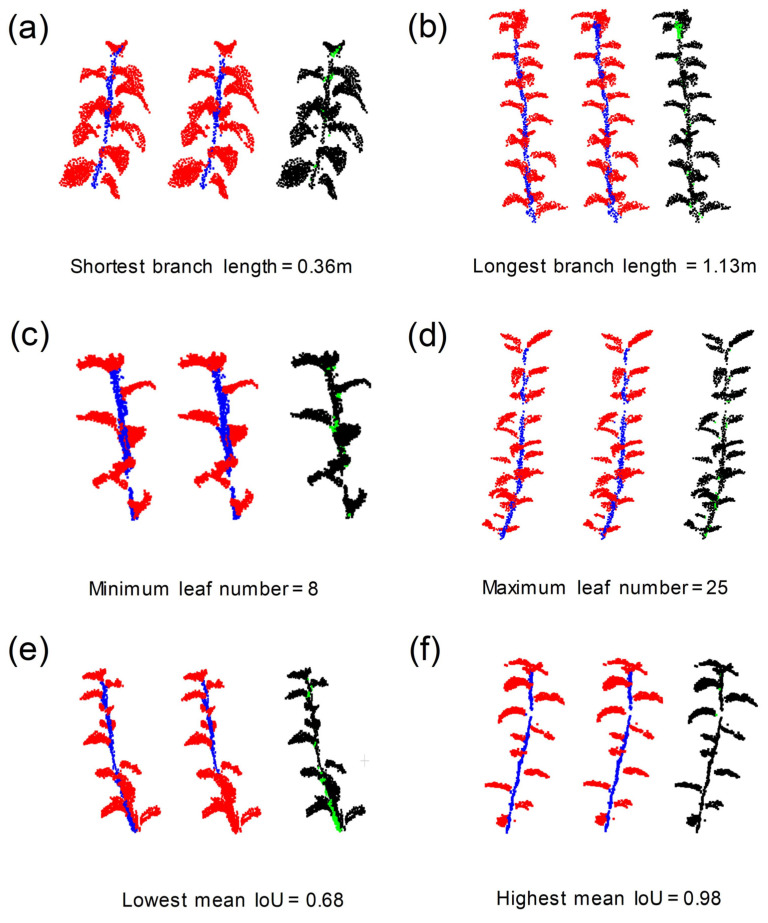
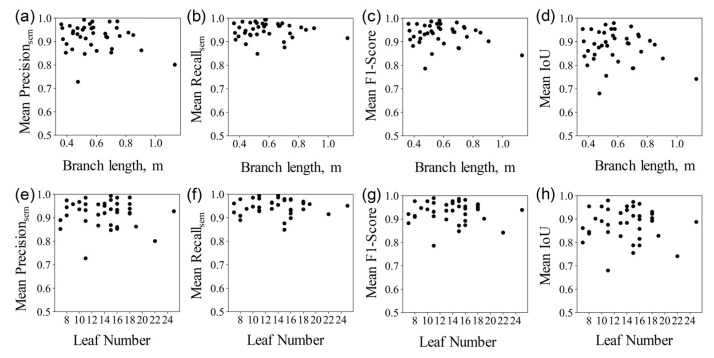
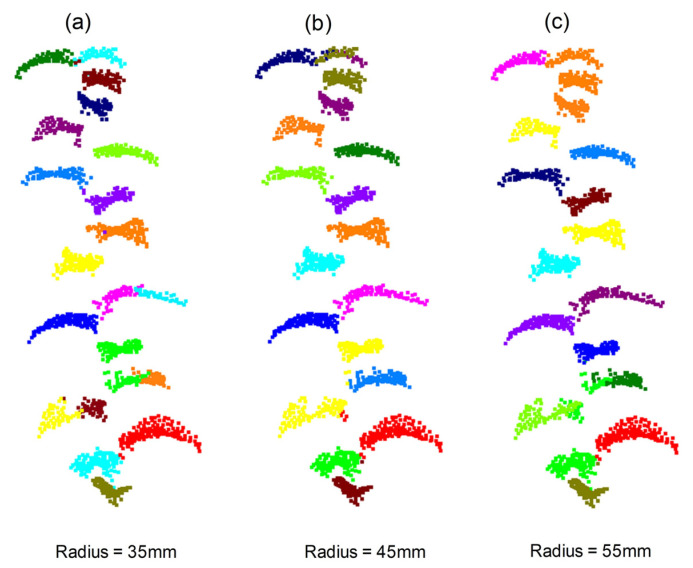
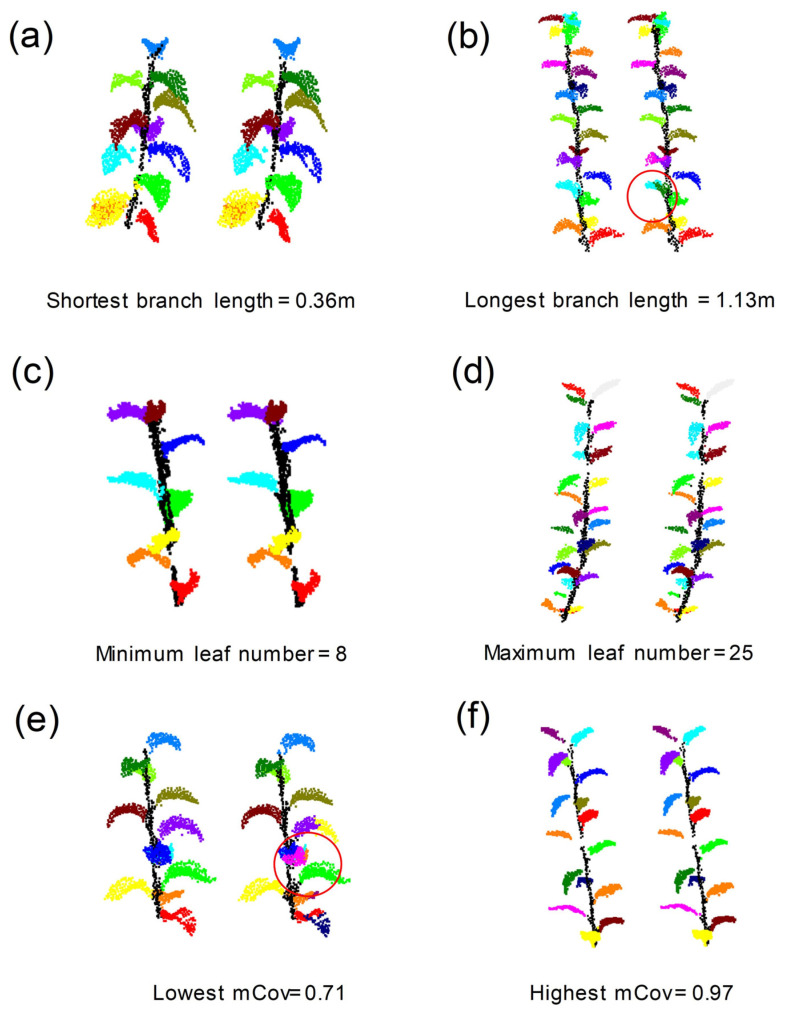
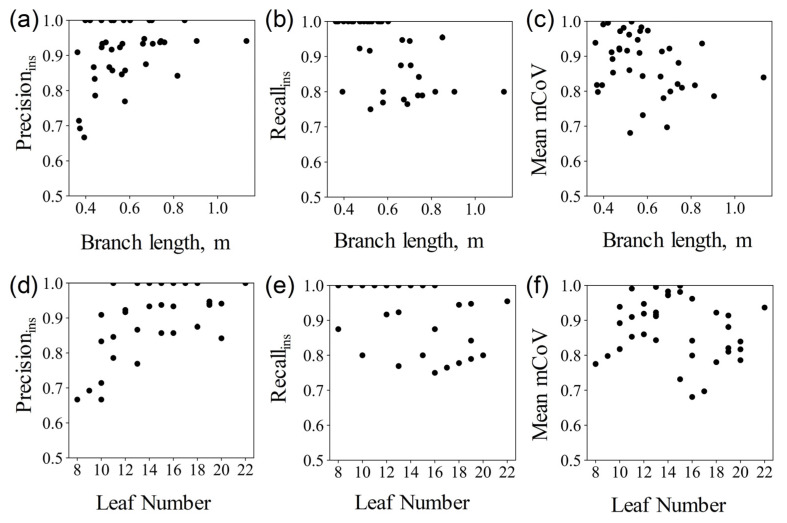
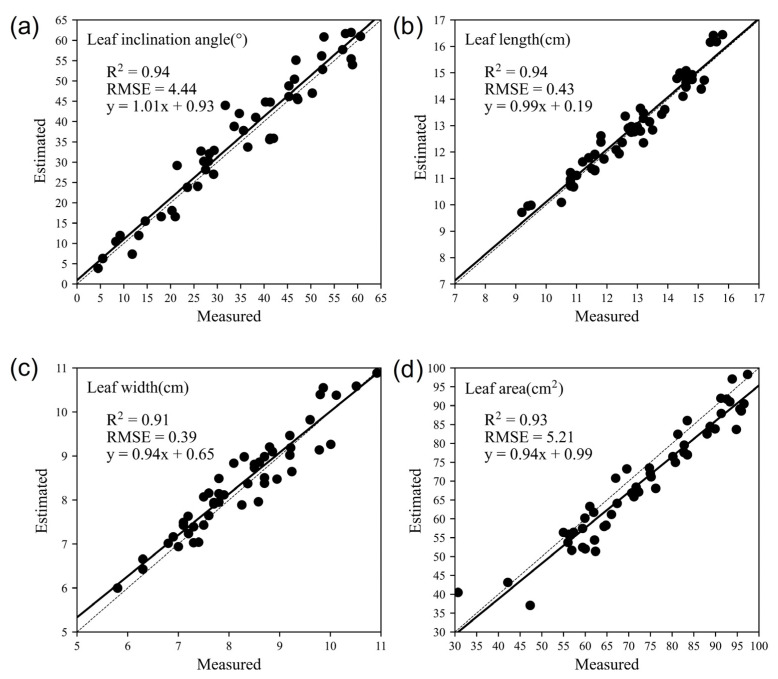
The leaf phenotypic traits of plants have a significant impact on the efficiency of canopy photosynthesis. However, traditional methods such as destructive sampling will hinder the continuous monitoring of plant growth, while manual measurements in the field are both time-consuming and laborious. Nondestructive and accurate measurements of leaf phenotypic parameters can be achieved through the use of 3D canopy models and object segmentation techniques. This paper proposed an automatic branch-leaf segmentation pipeline based on lidar point cloud and conducted the automatic measurement of leaf inclination angle, length, width, and area, using pear canopy as an example. Firstly, a three-dimensional model using a lidar point cloud was established using SCENE software. Next, 305 pear tree branches were manually divided into branch points and leaf points, and 45 branch samples were selected as test data. Leaf points were further marked as 572 leaf instances on these test data. The PointNet++ model was used, with 260 point clouds as training input to carry out semantic segmentation of branches and leaves. Using the leaf point clouds in the test dataset as input, a single leaf instance was extracted by means of a mean shift clustering algorithm. Finally, based on the single leaf point cloud, the leaf inclination angle was calculated by plane fitting, while the leaf length, width, and area were calculated by midrib fitting and triangulation. The semantic segmentation model was tested on 45 branches, with a mean Precisionsem, mean Recallsem, mean F1-score, and mean Intersection over Union (IoU) of branches and leaves of 0.93, 0.94, 0.93, and 0.88, respectively. For single leaf extraction, the Precisionins, Recallins, and mean coverage (mCoV) were 0.89, 0.92, and 0.87, respectively. Using the proposed method, the estimated leaf inclination, length, width, and area of pear leaves showed a high correlation with manual measurements, with correlation coefficients of 0.94 (root mean squared error: 4.44°), 0.94 (root mean squared error: 0.43 cm), 0.91 (root mean squared error: 0.39 cm), and 0.93 (root mean squared error: 5.21 cm2), respectively. These results demonstrate that the method can automatically and accurately measure the phenotypic parameters of pear leaves. This has great significance for monitoring pear tree growth, simulating canopy photosynthesis, and optimizing orchard management.
Keywords: leaf phenotype; pear canopy; point cloud segmentation.
Conflict of interest statement
The authors declare no conflict of interest.
Figures
Similar articles
-
A cotton organ segmentation method with phenotypic measurements from a point cloud using a transformer.Plant Methods. 2025 Mar 16;21(1):37. doi: 10.1186/s13007-025-01357-w. Plant Methods. 2025. PMID: 40091062 Free PMC article.
-
[Estimation method of urban green space living vegetation volume based on backpack light detection and ranging].Ying Yong Sheng Tai Xue Bao. 2022 Oct;33(10):2777-2784. doi: 10.13287/j.1001-9332.202210.020. Ying Yong Sheng Tai Xue Bao. 2022. PMID: 36384614 Chinese.
-
Three-dimensional branch segmentation and phenotype extraction of maize tassel based on deep learning.Plant Methods. 2023 Aug 1;19(1):76. doi: 10.1186/s13007-023-01051-9. Plant Methods. 2023. PMID: 37528454 Free PMC article.
-
Deep Learning on Point Clouds and Its Application: A Survey.Sensors (Basel). 2019 Sep 26;19(19):4188. doi: 10.3390/s19194188. Sensors (Basel). 2019. PMID: 31561639 Free PMC article. Review.
-
Measuring crops in 3D: using geometry for plant phenotyping.Plant Methods. 2019 Sep 3;15:103. doi: 10.1186/s13007-019-0490-0. eCollection 2019. Plant Methods. 2019. PMID: 31497064 Free PMC article. Review.
Cited by
-
A cotton organ segmentation method with phenotypic measurements from a point cloud using a transformer.Plant Methods. 2025 Mar 16;21(1):37. doi: 10.1186/s13007-025-01357-w. Plant Methods. 2025. PMID: 40091062 Free PMC article.
-
Completing the picture of field-grown cereal crops: a new method for detailed leaf surface models in wheat.Plant Methods. 2024 Feb 3;20(1):21. doi: 10.1186/s13007-023-01130-x. Plant Methods. 2024. PMID: 38310295 Free PMC article.
-
Accurate LAI estimation of soybean plants in the field using deep learning and clustering algorithms.Front Plant Sci. 2025 Jan 22;15:1501612. doi: 10.3389/fpls.2024.1501612. eCollection 2024. Front Plant Sci. 2025. PMID: 39911650 Free PMC article.
-
Study on the Optimal Leaf Area-to-Fruit Ratio of Pear Trees on the Basis of Bearing Branch Girdling and Machine Learning.Plant Phenomics. 2024 Aug 14;6:0233. doi: 10.34133/plantphenomics.0233. eCollection 2024. Plant Phenomics. 2024. PMID: 39144673 Free PMC article.
References
-
- Cristofori V., Rouphael Y., Gyves E.M.D., Bignami C. A simple model for estimating leaf area of hazelnut from linear measurements. Sci. Hortic. 2007;113:221–225. doi: 10.1016/j.scienta.2007.02.006. - DOI
MeSH terms
Grants and funding
LinkOut - more resources
Full Text Sources
