. 2023 Jun 7;31(6):1661-1674.
doi: 10.1016/j.ymthe.2023.05.006. Epub 2023 May 12.

Di-valent siRNA-mediated silencing of MSH3 blocks somatic repeat expansion in mouse models of Huntington's disease

Affiliations

Di-valent siRNA-mediated silencing of MSH3 blocks somatic repeat expansion in mouse models of Huntington's disease

Daniel O'Reilly et al. Mol Ther. .

Erratum in

Abstract

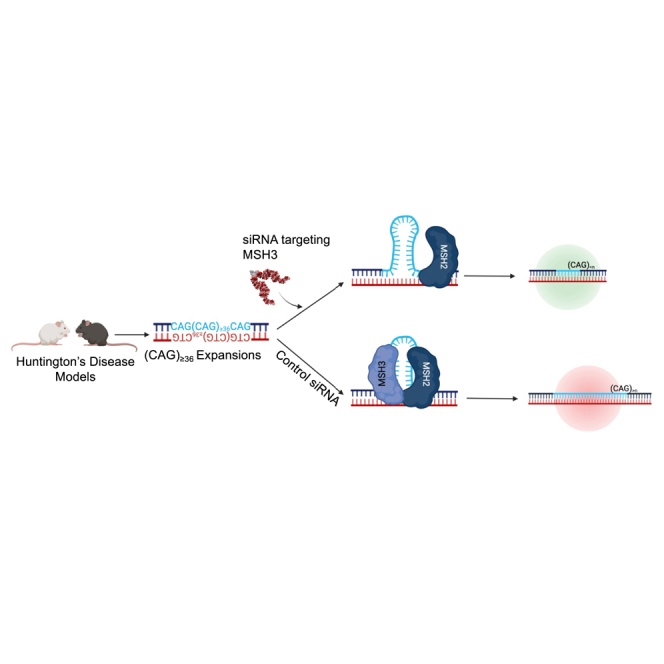
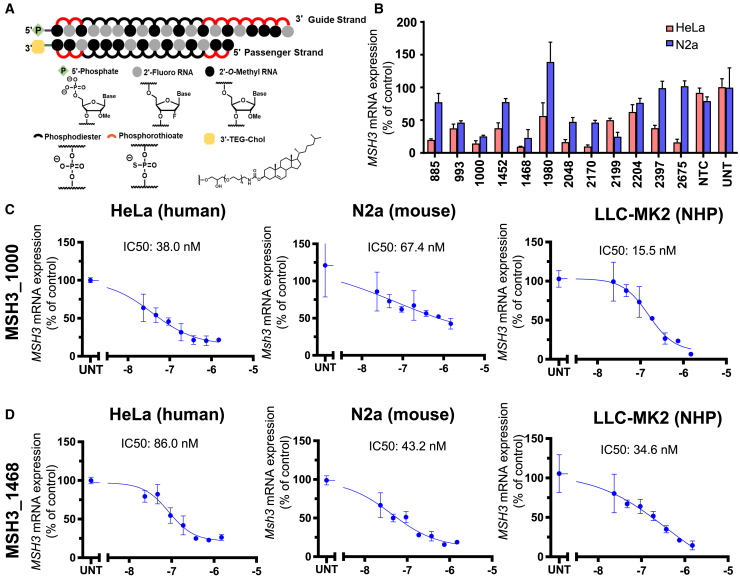
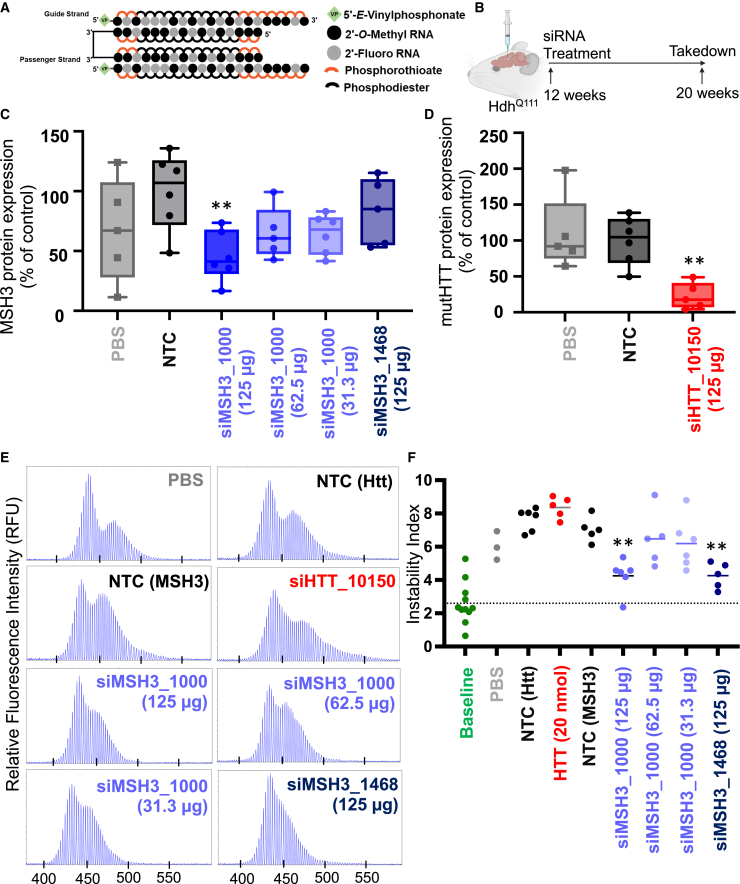
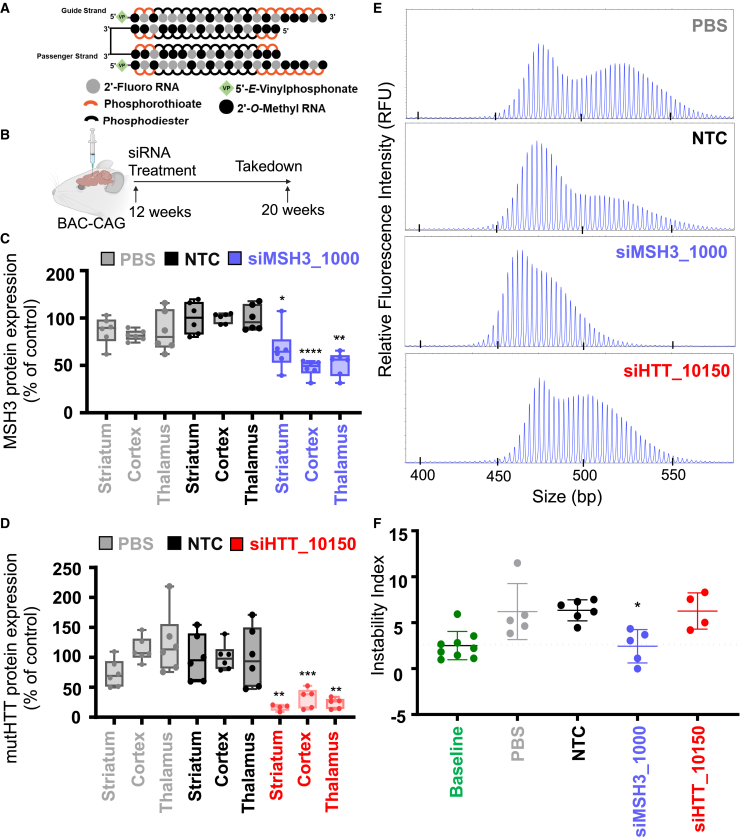
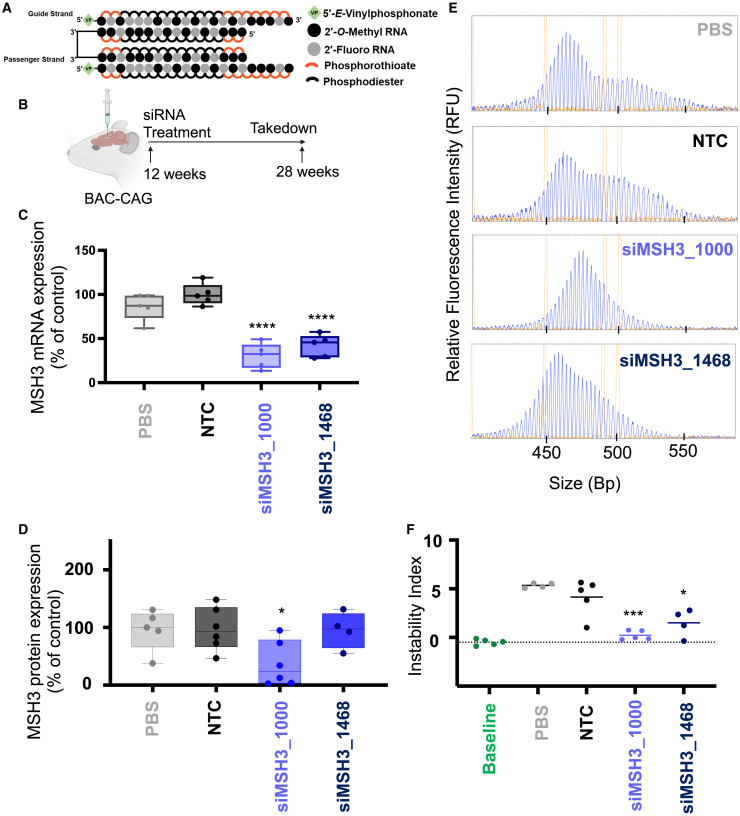
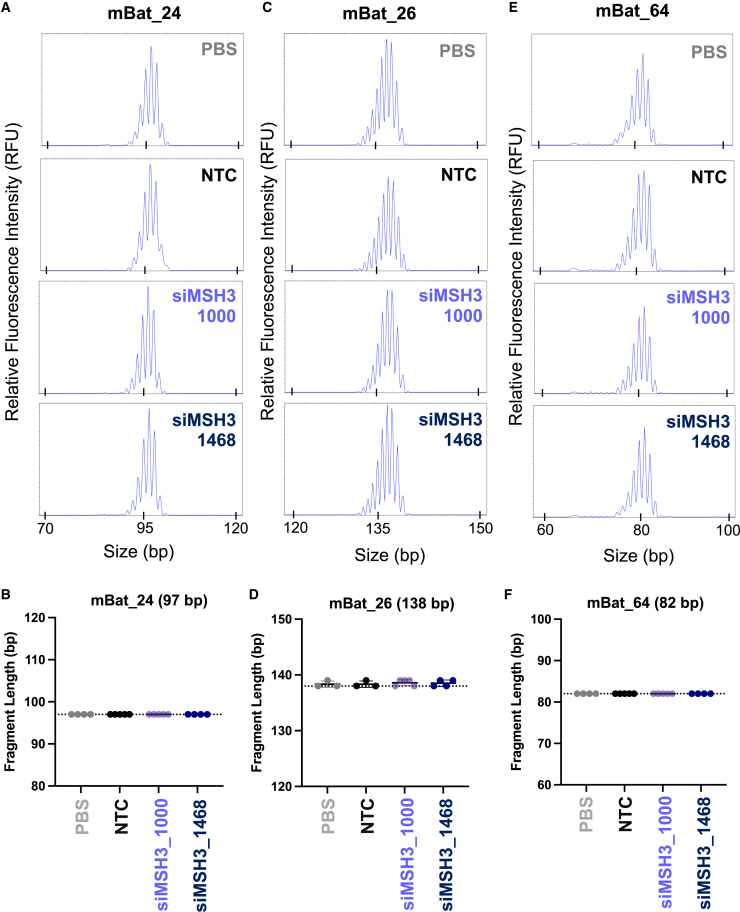
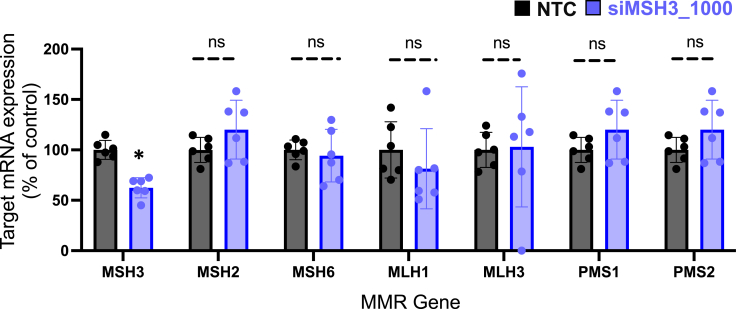
Huntington's disease (HD) is a severe neurodegenerative disorder caused by the expansion of the CAG trinucleotide repeat tract in the huntingtin gene. Inheritance of expanded CAG repeats is needed for HD manifestation, but further somatic expansion of the repeat tract in non-dividing cells, particularly striatal neurons, hastens disease onset. Called somatic repeat expansion, this process is mediated by the mismatch repair (MMR) pathway. Among MMR components identified as modifiers of HD onset, MutS homolog 3 (MSH3) has emerged as a potentially safe and effective target for therapeutic intervention. Here, we identify a fully chemically modified short interfering RNA (siRNA) that robustly silences Msh3 in vitro and in vivo. When synthesized in a di-valent scaffold, siRNA-mediated silencing of Msh3 effectively blocked CAG-repeat expansion in the striatum of two HD mouse models without affecting tumor-associated microsatellite instability or mRNA expression of other MMR genes. Our findings establish a promising treatment approach for patients with HD and other repeat expansion diseases.

Keywords: CAG expansion disorders; DNA instability; Huntington’s disease; mismatch repair; neurodegeneration; oligonucleotide therapeutics; siRNA.


Conflict of interest statement

Declaration of interests A.K. and N.A. are co-founders of Atalanta. A.K. and N.A. are on the scientific advisory board of Atalanta. N.A. is on the scientific advisory board of Huntington’s Disease Society for America and that of Biogen and has licensing to Spark Therapeutics. A.K. has a financial interest in Atalanta. The authors have patents on MSH3 as a therapeutic target and the methodology described in the paper.

Figures

None
Graphical abstract
Figure 1
Figure 1
Silencing of MSH3 with fully chemically modified siRNA (A) Chemical scaffold of fully modified siRNA utilized for in vitro screening. (B) MSH3 mRNA was measured in HeLa (red) and Neuro2a (blue) cells 72 h post-treatment with 1.5 μM siRNA or non-targeting control (NTC). UNT denotes untreated controls. Data shown are the mean ± standard deviation. Dose-response results for (C) MSH3_1000 and (D) MSH3_1438 in HeLa (left), N2A cells (middle), and non-human primate (NHP) LLC-MK2 cells (right). Cells were treated with siRNA at the concentrations shown for 72 h. For all analyses, mRNA levels were measured using the QuantiGene Singleplex assay and calculated as the percentage of untreated.
Figure 2
Figure 2
MSH3 silencing with di-siRNA blocks somatic repeat expansion in striatum of HdhQ111 HD mice (A) Di-valent chemically modified siRNA structure. (B) Experimental setup in HdhQ111 mice depicts bilateral intracerebroventricular injection of PBS or di-siRNA targeting a non-targeting control (NTC), siHTT_10150, siMSH3_1468, or siMSH3_1000, with 125 μg siRNA per ventricle. Mice were injected at 12 weeks of age and euthanized at 20 weeks of age. (C) MSH3 protein expression and (D) mutant Htt (mutHTT) in striatum following treatment with PBS (gray), NTC (125 μg, black), siHTT_10150 (125 μg, red), siMSH3_1000 (125, 62.5, or 31.3 μg, purple), or siMSH3_1468 (125 μg, navy). Protein expression is compared with NTC (one-way ANOVA with Dunnett’s multiple comparison test, ∗∗p < 0.01). Each data point derives from the striatum of one animal (n = 5–6 animals per condition). Data shown are the mean ± range. (E) Representative fragment analysis of the expanded CAG locus in the striatum of PBS-, NTC-, siMSH3_1000-, siMSH3_1468-, and siHTT_10150-treated HdhQ111 mice, 8 weeks post-injection. Primers are reported in the materials and methods. (F) Somatic instability index calculated with a 5% signal-to-noise threshold as described in the materials and methods. Each data point is one mouse. The dotted line is the striatal instability index in 3-month-old HdhQ111 mice, representing the instability at the time of injection prior to treatment. Instability index is compared with NTC (one-way ANOVA with Dunnett’s multiple comparison test; ∗∗p < 0.01).
Figure 3
Figure 3
MSH3 silencing with di-siRNA blocks somatic repeat expansion in striatum of BAC-CAG HD mice (A) Di-valent chemically modified siRNA structure including the chemical structure used. (B) BAC-CAG study plan, injecting groups at 12 weeks of age: PBS, NTC, siHTT_10150, and siMSH3_1000. Mice were injected with 125 μg per ventricle of di-valent siRNA and were euthanized at 20 weeks. (C) MSH3 protein measured in PBS, NTC, and siMSH3_1000 groups showing 40%–50% silencing of the Msh3 protein in the striatum, cortex, and thalamus. (D) mutHTT protein expression of PBS, NTC, and siHTT_10150 showing >90% silencing in the striatum, cortex, and thalamus. Data shown are the mean ± standard deviation. n = 5–6 mice per condition. (E) Representative fragment analysis of the expanded CAG locus in striatum of PBS-, NTC-, siMSH3_1000-, and siHTT_10150-treated BAC-CAG mice 8 weeks post-injection. Primers are reported in the materials and methods. (F) Somatic instability index calculated with a 5% signal-to-noise threshold as described in the materials and methods. Each data point is one mouse. Instability index is compared with NTC (one-way ANOVA treatment with Dunnett’s multiple comparison test; ∗p < 0.05, ∗∗p < 0.01, ∗∗∗p < 0.001, ∗∗∗∗p < 0.0001). Data shown are the mean ± standard deviation.
Figure 4
Figure 4
MSH3 silencing with di-valent MSH3_1000 and MSH3_1468 blocks somatic repeat expansion in BAC-CAG HD mice after 4 months treatment duration (A) Di-valent chemically modified siRNA structure including the chemical structure used. (B) BAC-CAG study plan, injecting groups at 12 weeks of age: PBS, NTC, siMSH3_1000, and siMSH3_1468. Mice were injected with 125 μg per ventricle of di-valent siRNA and were euthanized at 28 weeks. (C) MSH3 mRNA measured in PBS, NTC, siMSH3_1000, and siMSH3_1468 groups in the striatum. siMSH3_1000 and siMSH3_1468 show 70% and 60% Msh3 mRNA silencing, respectively. Data shown are the mean ± standard deviation. n = 5–6 mice per condition. (D) MSH3 protein measured in PBS, NTC, siMSH3_1000 and siMSH3_1468 groups showing 60% silencing of the Msh3 protein in the striatum with MSH3_1000 and 5% with siMSH3_1468. Data shown are the mean ± standard deviation. (E) Representative fragment analysis of the expanded CAG locus in the striatum of PBS-, NTC-, siMSH3_1000-, and siMSH3_1468-treated BAC-CAG mice 12 weeks post-injection. Primers are reported in the materials and methods. (F) Somatic instability index calculated with a 5% signal-to-noise threshold as described in the materials and methods. Each data point is one mouse. Instability index is compared with NTC (one-way ANOVA treatment with Dunnett’s multiple comparison test; ∗p < 0.05, ∗∗∗p < 0.001, ∗∗∗∗p < 0.0001). Data shown are the mean ± standard deviation.
Figure 5
Figure 5
MSH3 silencing with di-valent siMSH3_1000 or si-MSH3_1468 does not affect microsatellite instability Microsatellite instability (MSI) traces of the (A) mBAT 24, (C) mBAT 26, or (E) mBAT 64 mononucleotide repeat locus. MSI was compared between PBS, NTC, siMSH3_1000, and siMSH3_1468. MSI quantitation at the (B) mBAT 24, (D) mBAT 26, or (F) mBAT 64 loci. Traces were analyzed with Thermo Fisher Cloud PeakScanner. Primers are reported in the materials and methods. MSI is compared with NTC (one-way ANOVA). n = 4–6 mice per condition. Data shown are the mean ± standard deviation.
Figure 6
Figure 6
MSH3 silencing does not alter expression of additional mismatch repair genes The mRNA expression of MSH3, MSH2, MSH6, MLH1, MLH3, PMS1, and PMS2 was measured by QuantiGene Singleplex assay on the medial cortex of the 4-month-treated BAC-CAG mice whose data are shown in Figure 4. Each data point is the average of three technical replicates from one mouse. Each siMSH3_1000-treated gene expression column is normalized to the NTC mouse for that gene (one-way ANOVA treatment with Dunnett’s multiple comparison test, ∗p < 0.05). Data shown are the mean ± range.

Comment in

References

    1. Tabrizi S.J., Flower M.D., Ross C.A., Wild E.J. Huntington disease: new insights into molecular pathogenesis and therapeutic opportunities. Nat. Rev. Neurol. 2020;16:529–546. doi: 10.1038/s41582-020-0389-4. - DOI - PubMed
    1. Wild E.J., Tabrizi S.J. Therapies targeting DNA and RNA in Huntington's disease. Lancet Neurol. 2017;16:837–847. doi: 10.1016/S1474-4422(17)30280-6. - DOI - PMC - PubMed
    1. Tabrizi S.J., Estevez-Fraga C., van Roon-Mom W.M.C., Flower M.D., Scahill R.I., Wild E.J., Muñoz-Sanjuan I., Sampaio C., Rosser A.E., Leavitt B.R. Potential disease-modifying therapies for Huntington's disease: lessons learned and future opportunities. Lancet Neurol. 2022;21:645–658. doi: 10.1016/S1474-4422(22)00121-1. - DOI - PMC - PubMed
    1. Ghosh R., Tabrizi S.J. In: Polyglutamine Disorders. Nóbrega C., Pereira de Almeida L., editors. Springer International Publishing; 2018. Clinical features of huntington’s disease; pp. 1–28. - DOI
    1. McColgan P., Tabrizi S.J. Huntington's disease: a clinical review. Eur. J. Neurol. 2018;25:24–34. doi: 10.1111/ene.13413. - DOI - PubMed

Publication types

MeSH terms