Randomized Controlled Trial
. 2023 Aug;94(2):271-284.
doi: 10.1002/ana.26674. Epub 2023 Jun 5.

Connectivity Profile for Subthalamic Nucleus Deep Brain Stimulation in Early Stage Parkinson Disease

Affiliations
Randomized Controlled Trial

Connectivity Profile for Subthalamic Nucleus Deep Brain Stimulation in Early Stage Parkinson Disease

Mallory L Hacker et al. Ann Neurol. 2023 Aug.

Abstract

Objective: This study was undertaken to describe relationships between electrode localization and motor outcomes from the subthalamic nucleus (STN) deep brain stimulation (DBS) in early stage Parkinson disease (PD) pilot clinical trial.

Methods: To determine anatomical and network correlates associated with motor outcomes for subjects randomized to early DBS (n = 14), voxelwise sweet spot mapping and structural connectivity analyses were carried out using outcomes of motor progression (Unified Parkinson Disease Rating Scale Part III [UPDRS-III] 7-day OFF scores [∆baseline➔24 months, MedOFF/StimOFF]) and symptomatic motor improvement (UPDRS-III ON scores [%∆baseline➔24 months, MedON/StimON]).

Results: Sweet spot mapping revealed a location associated with slower motor progression in the dorsolateral STN (anterior/posterior commissure coordinates: 11.07 ± 0.82mm lateral, 1.83 ± 0.61mm posterior, 3.53 ± 0.38mm inferior to the midcommissural point; Montreal Neurological Institute coordinates: +11.25, -13.56, -7.44mm). Modulating fiber tracts from supplementary motor area (SMA) and primary motor cortex (M1) to the STN correlated with slower motor progression across STN DBS subjects, whereas fiber tracts originating from pre-SMA and cerebellum were negatively associated with motor progression. Robustness of the fiber tract model was demonstrated in leave-one-patient-out (R = 0.56, p = 0.02), 5-fold (R = 0.50, p = 0.03), and 10-fold (R = 0.53, p = 0.03) cross-validation paradigms. The sweet spot and fiber tracts associated with motor progression revealed strong similarities to symptomatic motor improvement sweet spot and connectivity in this early stage PD cohort.

Interpretation: These results suggest that stimulating the dorsolateral region of the STN receiving input from M1 and SMA (but not pre-SMA) is associated with slower motor progression across subjects receiving STN DBS in early stage PD. This finding is hypothesis-generating and must be prospectively tested in a larger study. ANN NEUROL 2023;94:271-284.


Conflict of interest statement

POTENTIAL CONFLICTS OF INTEREST

Authors MH and DC are shareholders of Arena Therapeutics, a company focused on advancing DBS for the treatment of patients recently diagnosed with PD. Author PK has equity ownership in Neurotargeting LLC, which has developed a system that facilitates the operative phases of DBS procedures. Author AH received lecturing fees from Boston Scientific, which manufactures DBS systems. Authors NR, CN, BH, SO, NL, AS, and TD have nothing to report.

Figures

Figure 1:
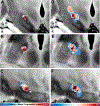
Figure 1:. Anatomical distribution of DBS electrodes at the mesencephalic level.
Reconstructions of investigated leads in the ‘DBS in early-stage PD’ cohort (n=14 subjects) are featured in the coronal plane. The STN, derived from the DISTAL Minimal Atlas, is superimposed on slices of a 100-μm, 7 T brain scan in MNI 152 space.
Figure 2:
Figure 2:. Sweet spot associated with slower motor progression in early-stage Parkinson’s disease.
(A-C) Electric field vector magnitudes of all DBS subjects were rank-correlated with motor symptom progression scores in a voxel-wise manner. (A) Coronal, (B) axial, and (C) sagittal views are centered on the functional coordinates: 11.07 ± 0.82mm lateral, 1.83 ± 0.61mm posterior to, and 3.53 ± 0.38mm inferior to the midcommissural point (MNI peak coordinates: 11.4, −13.7, −7.6mm). STN outlined in purple. Red nucleus outlined in red. Bejjani line = white dashed line. (D-F) N-image of stimulation volumes showing broad coverage across the STN on a group level.
Figure 3:
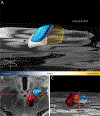
Figure 3:. White matter tracts associated with motor progression in early-stage Parkinson’s disease.
(A) The degrees of fibers modulated by E-fields were rank-correlated with slower motor progression scores across the entire DBS cohort (UPDRS-III 7-day OFF baseline to 24-month scores). Orange fibers correlate positively with slower motor progression [R between 0.06 and 0.58], while cyan fibers correlate negatively [R between −0.53 and −0.01]. Subthalamic nucleus (STN), purple. (B) Density maps of cortical fiber projections (positive/orange and negative/cyan) are overlayed onto an MNI space template [Johns Hopkins University (JHU) atlas parcellation: M1 (JHU: 25 & 26, precentral gyrus), SMA & pre-SMA (JHU: 1 & 2, superior frontal gyrus, posterior segment)] using Surf Ice software (https://www.nitrc.org/projects/surfice). (C) Stimulation sites of top (green) and poorly responding (red) illustrative example subjects and their relationship to fibers associated with slowed motor progression (orange). (D) Top: Leave-onepatient-out Cross-Validation of the fiber tract model shown in Panels A-C to estimate outcomes in unseen data. The analysis was iteratively repeated, each time leaving out one patient and estimating their outcomes by relating their stimulation site to the positively and negatively weighted fiber tracts. Repeating the same analysis in a 5-fold or 10-fold cross-validation also led to significant correlations (R = 0.50, P = 0.033 and R = 0.53, P = 0.027, respectively). Data from illustrative example subjects from Panel C are featured. Bottom: distribution of motor progression scores by randomization group from the ‘DBS in early-stage PD’ pilot clinical trial. DBS, n=14. ODT, n=14. (E) The null-distribution of the leave-one-patient-out experiment from Panel D (which was calculated by repeating the analysis 1,000 times after permuting motor progression values across subjects).
Figure 4:
Figure 4:. Symptomatic Motor Improvement Sweet Spot and White Matter Tracts.
A-C: Electric field magnitude values of all early-stage PD subjects were rank-correlated with percent symptomatic motor improvement (UPDRS-III MedON baseline to 24-month MedON/StimON scores), corresponding to the same analysis carried out with motor progression scores shown (Figure 2). (A) Coronal and (B) axial views centered on the peak functional coordinates: 11.08 ± 0.82 mm lateral, 1.93 ± 0.60 mm posterior, and 3.48 ± 0.38 mm inferior to the midcommissural point (MNI coordinates: 11.2, −13.7, −7.4 mm). STN outlined in purple. Red nucleus outlined in red. Bejjani line = white dashed line. (C) The degrees of fibers modulated by E-fields were rank-correlated with symptomatic motor improvement across the cohort (UPDRS-III ON baseline to 24-month scores), corresponding to the same analysis with motor progression scores shown in Figure 3. Orange fibers are positively associated with symptomatic motor improvements [R between 0.00 and 0.59], cyan fibers show negative correlations [R between −0.53 and 0.00]. D-F: Analysis of Figure 2 repeated after regressing out symptomatic improvement (MedON/StimON) scores (as analyzed in panels A-C) from motor progression scores.
Figure 5:
Figure 5:. Correlations Between Motor Progression and PD Therapies.
(A) Slower motor progression correlates with lower stimulation amplitude (24-month voltage) for DBS subjects; R=−0.52, P=0.02. Amplitude shown as average of left and right leads. V = voltage. (B) Slower motor progression is also associated with greater reductions in LEDD after surgery for DBS subjects (black dots; R=−0.59, P=0.01). There is no correlation for ODT subjects (tan dots; R=0.16, P=0.54). (C) Stimulation sites of top (green) and poorly responding (red) illustrative example subjects. Stimulation and PD medication data from illustrative example DBS subjects from are featured in Panels A and B.
Figure 6:
Figure 6:. Spatial Relationship Between Early-Stage Parkinson’s Disease Sweet Spot and Established Landmarks in DBS Targeting for Parkinson’s disease.
(A) Visualization of the optimal early-stage PD locations associated with motor progression (dark green sphere) and symptomatic motor improvement (light green sphere) and their relationship to mean coordinates derived from a meta-analysis of 171 standard of care PD electrodes (red sphere). The mean Euclidean distance between the advanced-stage PD metanalytic sweet spot and the early-stage PD sweet spots in the current study was 2.2 ± 0.01 mm. Axial (B) and sagittal (C) sections featuring the peak coordinates in MNI space, with the Bejjani line drawn in red. STN functional regions: associative (blue), limbic (white), sensorimotor (orange). Red nucleus (red).

References

    1. Schuepbach WMM, Rau J, Knudsen K, et al. Neurostimulation for Parkinson’s Disease with Early Motor Complications. N Engl J Med 2013;368(7):610. 10.1056/nejmoa1205158 - DOI - PubMed
    1. Deuschl GG, Schade-Brittinger C, Krack P, et al. A Randomized Trial of Deep-Brain Stimulation for Parkinson’s Disease. N Engl J Med 2006;355(9):896–908. 10.1056/nejmoa060281 - DOI - PubMed
    1. Weaver FM, Follett K a, Stern M, et al. Randomized trial of deep brain stimulation for Parkinson disease: thirty-six-month outcomes. Neurology 2012;79(1):55–65. doi:10.1212/WNL.0b013e31825dcdc1 - DOI - PMC - PubMed
    1. Charles PD, Van Blercom N, Krack P, et al. Predictors of effective bilateral subthalamic nucleus stimulation for PD. Neurology 2002;59(6):932–934. doi:10.1212/WNL.59.6.932 - DOI - PubMed
    1. Welter ML, Houeto JL, Tezenas Du Montcel S, et al. Clinical predictive factors of subthalamic stimulation in Parkinson’s disease. Brain 2002;125(3):575–583. doi:10.1093/brain/awf050 - DOI - PubMed

Publication types