. 2023 Aug 31;193(1):271-290.
doi: 10.1093/plphys/kiad278.

An extensive survey of phytoviral RNA 3' uridylation identifies extreme variations and virus-specific patterns

Affiliations

An extensive survey of phytoviral RNA 3' uridylation identifies extreme variations and virus-specific patterns

Anne Caroline Joly et al. Plant Physiol. .

Abstract

Viral RNAs can be uridylated in eukaryotic hosts. However, our knowledge of uridylation patterns and roles remains rudimentary for phytoviruses. Here, we report global 3' terminal RNA uridylation profiles for representatives of the main families of positive single-stranded RNA phytoviruses. We detected uridylation in all 47 viral RNAs investigated here, revealing its prevalence. Yet, uridylation levels of viral RNAs varied from 0.2% to 90%. Unexpectedly, most poly(A) tails of grapevine fanleaf virus (GFLV) RNAs, including encapsidated tails, were strictly monouridylated, which corresponds to an unidentified type of viral genomic RNA extremity. This monouridylation appears beneficial for GFLV because it became dominant when plants were infected with nonuridylated GFLV transcripts. We found that GFLV RNA monouridylation is independent of the known terminal uridylyltransferases (TUTases) HEN1 SUPPRESSOR 1 (HESO1) and UTP:RNA URIDYLYLTRANSFERASE 1 (URT1) in Arabidopsis (Arabidopsis thaliana). By contrast, both TUTases can uridylate other viral RNAs like turnip crinkle virus (TCV) and turnip mosaic virus (TuMV) RNAs. Interestingly, TCV and TuMV degradation intermediates were differentially uridylated by HESO1 and URT1. Although the lack of both TUTases did not prevent viral infection, we detected degradation intermediates of TCV RNA at higher levels in an Arabidopsis heso1 urt1 mutant, suggesting that uridylation participates in clearing viral RNA. Collectively, our work unveils an extreme diversity of uridylation patterns across phytoviruses and constitutes a valuable resource to further decipher pro- and antiviral roles of uridylation.


Conflict of interest statement

Conflict of interest statement. The authors declare that there is no conflict of interest.

Figures

Figure 1.
Figure 1.
3′ terminal features of CNDV and GLRaV-2 RNAs. A, C) High-resolution mapping of 3′ ends for CNDV A) and GLRaV-2 C) RNA. Heatmaps show frequencies of reads mapped to the indicated position for 3 infected plants. Position 0 corresponds to the 3′ end of the full-length viral RNA. B, D) Percentage of tailed vs nontailed reads found at the last 3′ end position for CNDV B) and GLRaV-2 D) RNAs. E) Examples of A-rich tails added to GLRaV-2 RNA. F) Sequence logo generated from GLRaV-2 RNA tails containing G. 42% to 66% of all tails (i.e. regardless of their internal or 3′ terminal position) contain G. Plant hosts and virus isolates are indicated in Supplemental Data Set S2.
Figure 2.
Figure 2.
U-tailing of ss(+) RNA phytoviruses is widespread and diverse. A) Uridylation percentages of phytoviral RNAs. Each bar represents an infected plant (n = 2 for GVB and n = 3 for all other viruses). The percentages of long (>1 nt) and 1 nt U-tails are indicated by dark-gray and light-gray, respectively. B) Proportion of the different U-tail sizes from 1 to 30 nt. Percentages were calculated using the number of U-tailed reads as denominator. U-tail sizes are indicated by a color gradient from 1 to 30 Us. Only viral RNAs for which uridylation was detected for at least 50 reads per replicate are shown. TLS in red indicates viral RNAs ending with a tRNA-like sequence. Plant hosts are indicated in Supplemental Data Set S2A.
Figure 3.
Figure 3.
Boxplot analysis comparing the size of nonmodified poly(A) tails vs uridylated poly(A) tails for polyadenylated viral RNAs. Each boxplot represents an infected plant (n = 3) and displays the median, first and third quartiles (lower and upper hinges), the largest value within 1.5 times the interquartile range above the upper hinge (upper whisker), and the smallest value within 1.5 times the interquartile range below the lower hinge (lower whiskers). Only viral RNAs for which uridylation was detected for at least 50 reads per replicate are shown. Plant hosts are indicated in Supplemental Data Set S2A. Stars represent significant statistical P-value (linear model, F-statistic, n = 3) with P < 0.01 (**) or 0.001 (***).
Figure 4.
Figure 4.
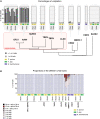
High uridylation levels are restricted to GFLV and ArMV. A) Uridylation percentages among the Secoviridae family. Each bar represents an infected plant, the host plant is indicated below, and virus isolates are indicated in Supplemental Data Set S2B. The percentages of long (>1 nt) and 1 nt U-tails are indicated by dark-gray and light-gray, respectively. Percentages shown for GFLV in Vitis spp. and CNDV were calculated from the same data set used in Fig. 2. No data were obtained for the BBWV-1 RNA2 for unknown technical reasons. The diagram (not to scale) below barplots illustrates the phylogenetic distances between the Secoviridae viruses analyzed in this study. The phylogenetic tree is shown in Supplemental Fig. S2. B) Proportion of the different U-tail sizes from 1 to 30 nt. The percentages were calculated using the number of U-tails as denominator. U tail sizes are indicated by a color gradient from 1-nt to 30-nt U-tails. Only viral RNAs for which uridylation was detected for at least 50 reads per replicate are shown.
Figure 5.
Figure 5.
Uridylation of degradation intermediates reveals patterns of ribonucleolytic attacks. A) High-resolution mapping of RNA 3′ ends for a selection of nonpolyadenylated viral RNAs (indicated on the left). For each virus, frequencies of reads at each 3′ end position are shown by a color scale for nontailed reads (upper panel) and for U-tailed reads (lower panel). Frequencies were calculated using the total number of reads as denominator. Position 0 corresponds to the 3′ end of the full-length viral RNA. For each virus, 3 infected plants were analyzed. B) Secondary structure and tertiary interactions in the 3′ UTR of TCV RNA according to McCormack et al. 2008 and Simon 2015. The TCV 3′ UTR contains 1 weak (M3H) and 5 stable hairpins (H4, H4a, H4b, H5, and Pr) as well as 3 H-type pseudoknots (Y1, Y2, and Y3) shown as red arrows. The frequency of uridylated 3′ ends detected in infected N. benthamiana plants is indicated by colored rectangles for each uridylation site. The 3 detected clusters of uridylation sites are highlighted in yellow. Plant hosts are indicated in Supplemental Data Set S2A.
Figure 6.
Figure 6.
Contribution of the Arabidopsis TUTases in the uridylation of TCV RNAs. A) Uridylation percentages of TCV RNA in infected WT, urt1-1, heso1-4, and heso1-4 urt1-1 plants. Percentages are shown for tails containing only Us (U-tail, left panel) or a majority of Us (U-rich, right panel). Each bar represents an individual plant (n = 3). The percentages of long (>1 nt) and 1 nt U-tails are indicated by dark-gray and light-gray, respectively. Significantly different values (P < 0.05) are labelled by different letters (generalized linear model for proportion, quasibinomial distribution). BD) High-resolution mapping of TCV RNA 3′ ends in infected WT, urt1-1, heso1-4, and heso1-4 urt1-1 plants. A close-up view is shown for the 3 detected clusters of uridylation. Frequencies were calculated using the total number of reads as denominator. Frequencies at each 3′ end position are shown for U-tailed and U-rich-tailed reads. Position 0 corresponds to the 3′ end of full-length TCV RNA. E) Relative frequency, compared to WT, of the last nucleotide before U-tails and U-rich tails in urt1-1 and heso1-4 mutants. Stars represent significant statistical P-value (generalized linear model for proportion, quasibinomial distribution, n = 3) with P < 0.001. F) Proportion of TCV RNA degradation intermediates in infected WT, urt1-1, heso1-4, and heso1-4 urt1-1 plants. Each bar represents an individual plant (n = 3). The percentages of full-length RNAs, with 3′ end located in a 5 nt window upstream the 3′ end, and of RNA fragments are indicated by dark-gray and light-gray, respectively. Significantly different values (P < 0.05) are labelled by different letters (generalized linear model for proportion, quasibinomial distribution).
Figure 7.
Figure 7.
Both URT1 and HESO1 contribute to the uridylation of TuMV RNA. A) Percentages of uridylation of TuMV RNA in infected WT, urt1-1, heso1-4, and heso1-4 urt1-1 Arabidopsis plants. Each bar represents an infected plant (n = 6). Percentages of long (>1 nt) and 1 nt U-tails are indicated by dark-gray and light-gray, respectively. Significantly different values (P < 0.05) are labelled by different letters (generalized linear model for proportion, quasibinomial distribution). B) Proportion of the different U-tail sizes from 1 to 30 nt. Percentages were calculated using the number of U-tailed reads as denominator. Individual points are color coded for each of the 6 replicates. U-tail size medians are indicated by red arrows. Significantly different medians of U-tail sizes (P < 0.05) are labelled by different letters (2-tailed Wilcoxon rank-sum test, n = 6). C) Boxplot analysis comparing nonmodified poly(A) tails (left boxplots) vs uridylated poly(A) tails (right boxplots) for each genotype. Each boxplot represents an infected plant (n = 6) and displays the median, first and third quartiles (lower and upper hinges), the largest value within 1.5 times the interquartile range above the upper hinge (upper whisker), and the smallest value within 1.5 times the interquartile range below the lower hinge (lower whiskers). Boxplots for heso1-4 urt1-1 plants are not shown as uridylation is almost abrogated. Stars represent significant statistical P-value (linear model, F-statistic, n = 3) with P < 0.001 (***). D) Distribution of poly(A) tail sizes of nontailed (upper panel) or uridylated (lower panel) viral RNAs for WT, urt1-1, heso1-4, and heso1-4 urt1-1 plants infected by TuMV. Percentages were calculated using the total number of sequences with tails from 1 to 89 nucleotides as denominator. Individual points are color coded for each of the 6 replicates. The gray area indicates the average of all replicates.
Figure 8.
Figure 8.
Arabidopsis TUTases are not required to maintain uridylation of GFLV RNAs. A) Uridylation percentages of GFLV RNAs (isolate GT) in infected WT, urt1-1, heso1-4, and heso1-4 urt1-1 Arabidopsis plants. Each bar represents an infected plant (n = 8). The percentages of long (>1 nt) and 1 nt U-tails are indicated by dark-gray and light-gray, respectively. Of note, almost all GFLV RNAs (from 99.72% to 100%) end with a single U. B) 5′ and 3′ features of GFLV RNA1– and RNA2–negative strands. Upper part: diagram illustrating the 3′ and 5′ extremities of the GFLV RNA plus and minus strands deduced from 3′ and 5′ RACE-seq results. The GFLV isolate GT was used. Lower part: percentages of nucleotide additions at the 5′ (right) and 3′ (left) end of the minus strands. Proportions of the different tail sizes are shown for U-tails detected at the 5′ end of the minus strand. The percentages were calculated using the number of U-tails as denominator. U-tail sizes are indicated by a colorgradient. Each bar represents an infected plant (n = 3 for 5′ end and n = 4 for 3′ end).
Figure 9.
Figure 9.
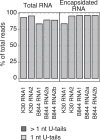
Uridylation is a genomic feature of encapsidated GFLV RNAs. Uridylation frequencies of GFLV RNAs (K30 and B844 isolates) for total RNA of C. quinoa infected plants or for encapsidated RNAs. For each of the 2 GFLV isolates, 1 replicate was analyzed. The percentages of long (>1 nt) and 1 nt U-tails are indicated by dark-gray and light-gray, respectively. Of note, almost all GFLV RNAs (from 99.76% to 99.92%) end with a single U.

References

    1. Arnold JJ, Cameron CE. Poliovirus RNA-dependent RNA polymerase (3Dpol) is sufficient for template switching in vitro. J Biol Chem. 1999:274(5):2706–2716. 10.1074/jbc.274.5.2706 - DOI - PubMed
    1. Behrens SE, Tomei L, De Francesco R. Identification and properties of the RNA-dependent RNA polymerase of hepatitis C virus. EMBO J. 1996:15(1):12–22. 10.1002/j.1460-2075.1996.tb00329.x - DOI - PMC - PubMed
    1. Calil IP, Fontes EPB. Plant immunity against viruses: antiviral immune receptors in focus. Ann Bot. 2017:119(5):711–723. 10.1093/aob/mcw200 - DOI - PMC - PubMed
    1. Cock PJA, Antao T, Chang JT, Chapman BA, Cox CJ, Dalke A, Friedberg I, Hamelryck T, Kauff F, Wilczynski B, et al. Biopython: freely available Python tools for computational molecular biology and bioinformatics. Bioinformatics. 2009:25(11):1422–1423. 10.1093/bioinformatics/btp163 - DOI - PMC - PubMed
    1. De Almeida C, Scheer H, Zuber H, Gagliardi D. RNA Uridylation: a key post-transcriptional modification shaping the coding and non-coding transcriptome. Wiley Interdiscip Rev RNA. 2018;9(1):e1440. 10.1002/wrna.1440 - DOI - PubMed

Publication types

MeSH terms