. 2023 May 25;186(11):2438-2455.e22.
doi: 10.1016/j.cell.2023.04.012. Epub 2023 May 12.

Sites of transcription initiation drive mRNA isoform selection

Affiliations

Sites of transcription initiation drive mRNA isoform selection

Carlos Alfonso-Gonzalez et al. Cell. .

Abstract

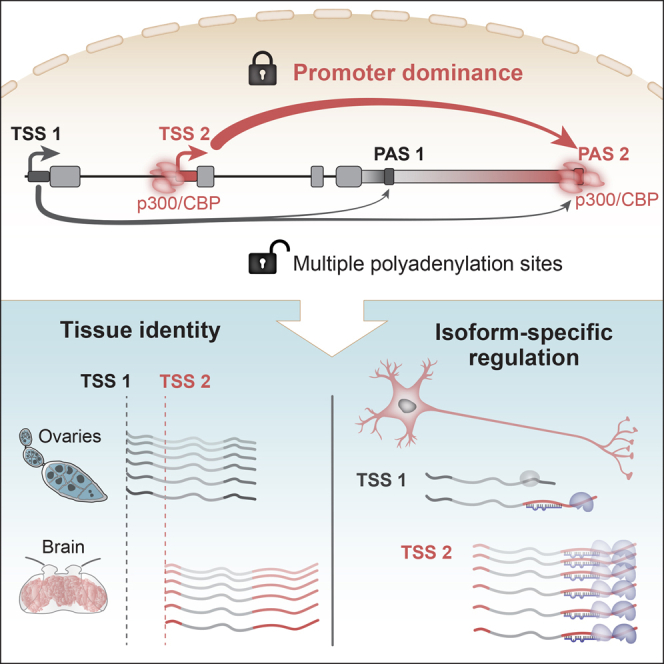
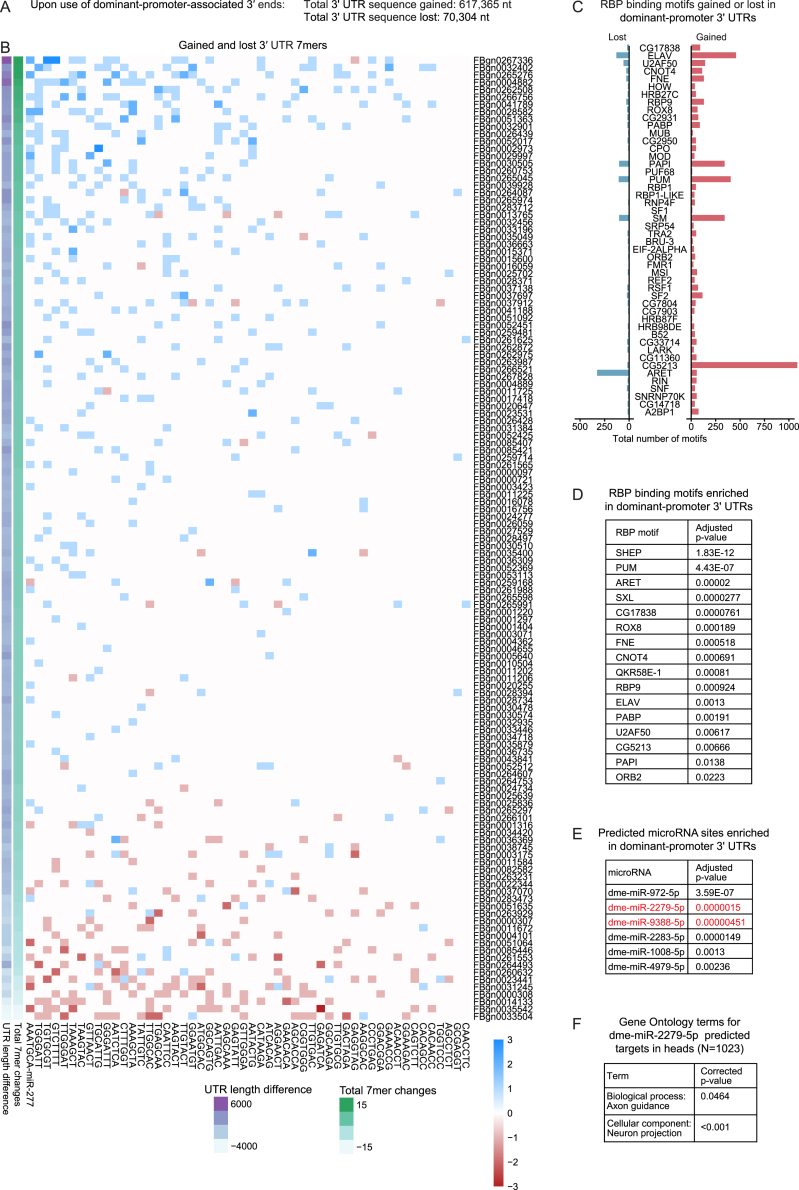
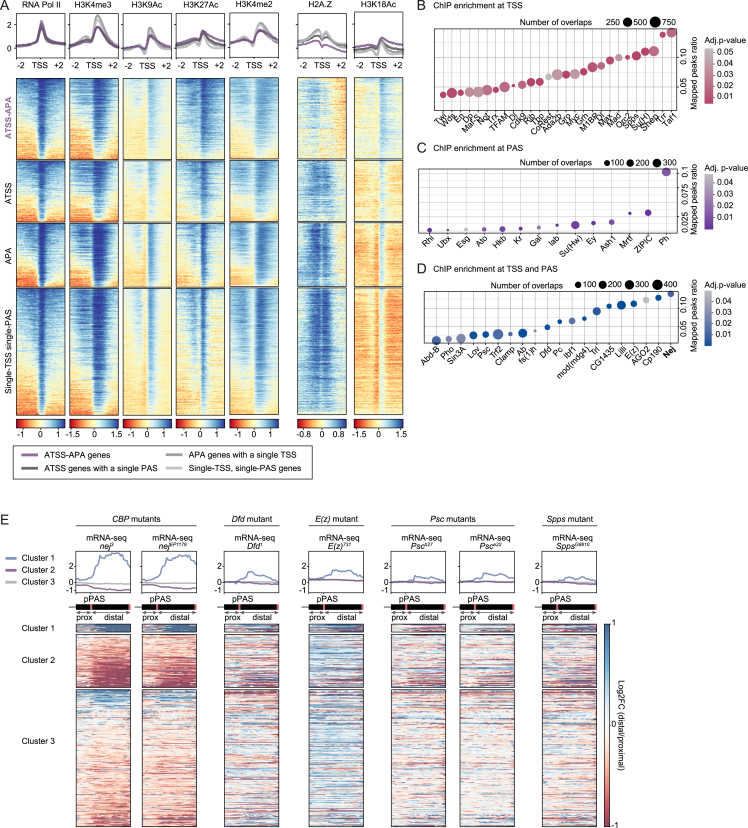
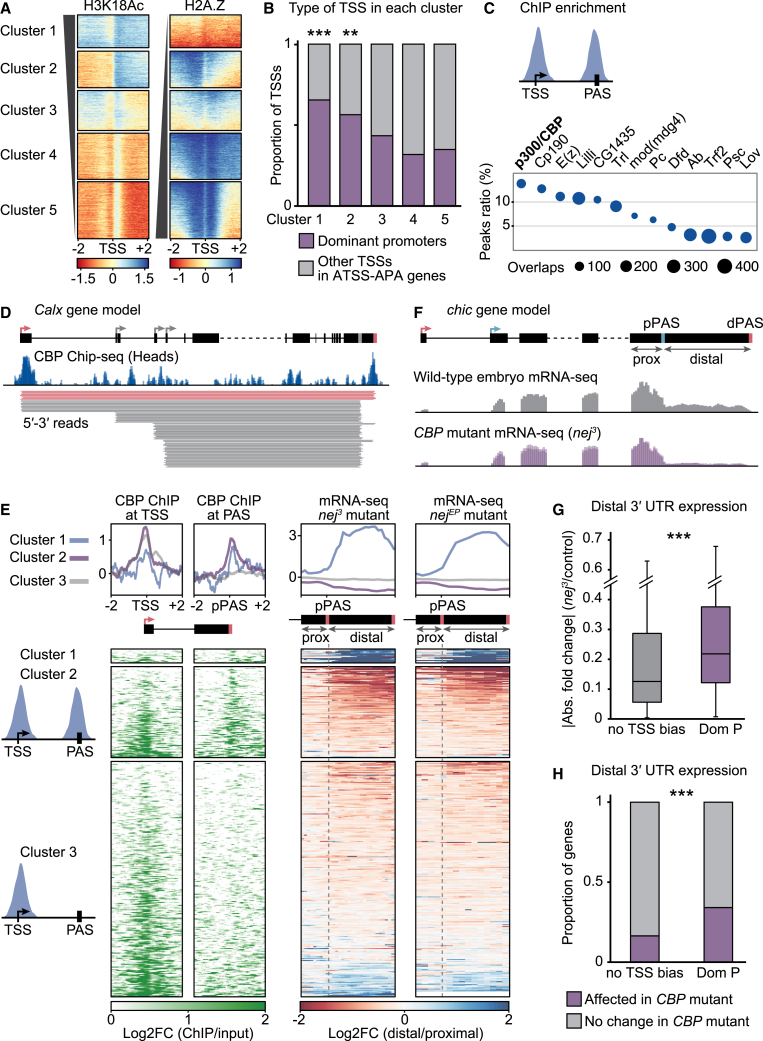
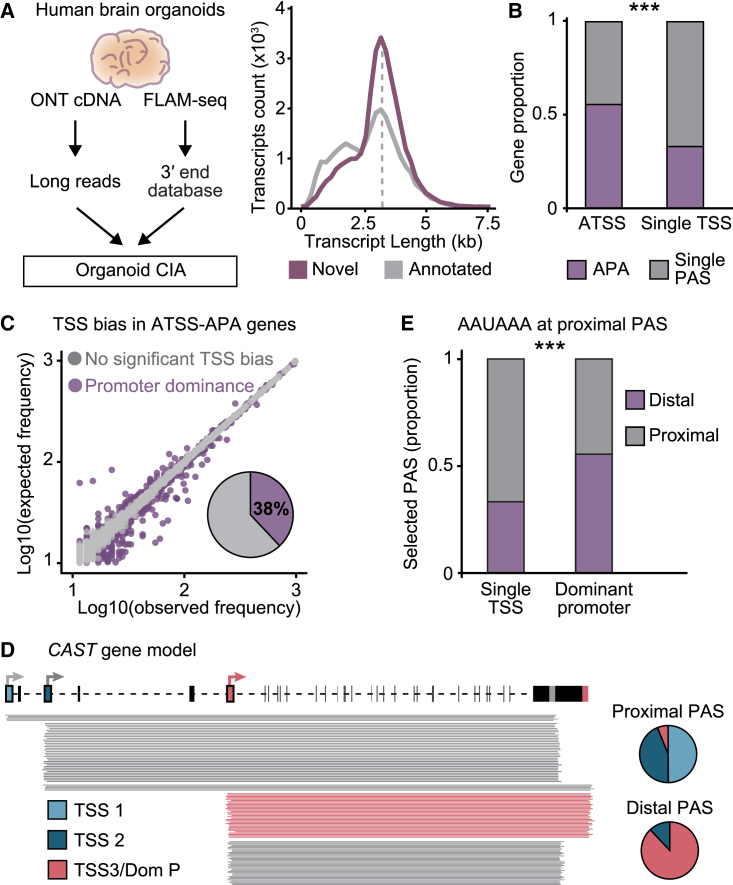
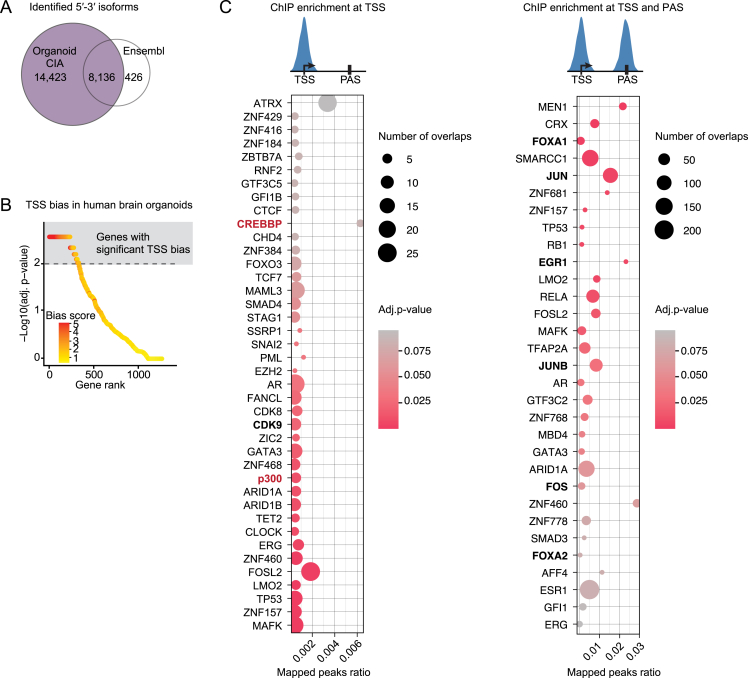
The generation of distinct messenger RNA isoforms through alternative RNA processing modulates the expression and function of genes, often in a cell-type-specific manner. Here, we assess the regulatory relationships between transcription initiation, alternative splicing, and 3' end site selection. Applying long-read sequencing to accurately represent even the longest transcripts from end to end, we quantify mRNA isoforms in Drosophila tissues, including the transcriptionally complex nervous system. We find that in Drosophila heads, as well as in human cerebral organoids, 3' end site choice is globally influenced by the site of transcription initiation (TSS). "Dominant promoters," characterized by specific epigenetic signatures including p300/CBP binding, impose a transcriptional constraint to define splice and polyadenylation variants. In vivo deletion or overexpression of dominant promoters as well as p300/CBP loss disrupted the 3' end expression landscape. Our study demonstrates the crucial impact of TSS choice on the regulation of transcript diversity and tissue identity.

Keywords: 5ʹ-3ʹ coupling; Drosophila; alternative polyadenylation; human brain organoids; long-read sequencing; mRNA isoform; nervous system; p300/CBP; transcription; transcription start site.


Conflict of interest statement

Declaration of interests The authors declare no competing interests.

Figures

None
Graphical abstract
Figure 1
Figure 1
An accurate, comprehensive, full-length Drosophila transcriptome (A) Combined isoform assembly (CIA) experimental and computational workflow. Long-read sequencing was performed on three Drosophila tissues: adult heads, embryos at the developmental time points 14–16 h after egg laying (AEL) and 18–20 h AEL, and adult ovaries. Transcript size selection was performed to optimize recovery of neuronal transcripts. The final transcriptome assembly was built on full-length reads, i.e., those that spanned an entire mRNA transcript isoform from experimentally validated TSS (true 5′ end) to experimentally validated 3′ end (true 3′ end). Individual reads are represented as straight lines spanning different regions of the gene. (B) BluePippin size selection considerably increased ONT cDNA read length (top) and optimized recovery of neuronal transcripts, whose length (bottom) exceeds the coverage range of LRS experiments without size selection (gray). (C) Nucleotide composition profile of LRS reads at the 3′ end cleavage site for CIA full-length reads, compared with 3′ ends of discarded reads. (D) Distribution as a function of transcript length of novel and previously annotated isoforms in the CIA transcriptome assembly dataset. (E) Venn diagram showing the number of transcript isoforms (and genes) identified in each tissue in the CIA dataset, scaled by the number of isoforms. Data from different embryonic time points were pooled in (E) and (F). (F) CIA annotation tracks of detected pumilio mRNA isoforms in each tissue. Isoforms common to multiple tissues are depicted in gray. Boxes and lines represent exons and introns, respectively. Some introns (dashed lines) are not drawn to scale. TSSs and PASs are represented by arrows and gray stripes, respectively, in the gene model. Replicates per tissue: ONT cDNA: heads, n = 6; embryos 14–16 h, n = 3; embryos 18–20 h, n = 3; ovaries n = 3. FLAM-seq and Iso-seq: heads, n = 3; DRS: heads, n = 1, embryos 14–16 h, n = 3; ovaries, n = 3. See also Figures S1 and S2 and Tables S1–S3.
Figure S1
Figure S1
An accurate, comprehensive, full-length Drosophila transcriptome, related to Figure 1 (A) Combined isoform assembly (CIA) workflow, and schematic of 3′ end correction and filtering. ONT DRS (in heads: ONT DRS and FLAM-seq) data were used to build a database of confident 3′ ends. The CIA assembly was performed with ONT cDNA and ONT DRS (in heads: ONT cDNA, Iso-seq, ONT DRS, and FLAM-seq) data using FLAIR and the Eukaryotic Promoter Database (EPD-new). Note that due to the low number of Iso-seq reads compared with ONT cDNA reads, Iso-seq reads contribute to CIA to a much lower extent. Since this assembly contains 3′ end artifacts, we filtered out any transcripts with 3′ ends not represented in the DRS/FLAM 3′ end database. Assembled transcript models were corrected with DRS/FLAM 3′ ends. (B) Number of corrected transcripts per tissue (left) and average length of correction (right). Data from the two embryo datasets (14–16 h AEL and 18–20 h AEL) were pooled. (C) Read lengths in each tissue with each LRS method. BluePippin size selection (red graphs, below) considerably increased full-length transcript coverage. (D) Full-length transcript coverage per read for nanopore cDNA and PacBio Iso-seq in heads, before (left two graphs) and after (right two graphs) size selection. For each read, the fraction of the target transcript covered is shown; reads were grouped by the length of the target transcript. (E) Principal-component analysis plot of gene expression across the samples (3 biological replicates each) generated using nanopore cDNA with and without size selection, nanopore direct RNA sequencing (DRS), and Illumina short-read mRNA-seq from three tissues. Data from the two embryo datasets (14–16 h AEL and 18–20 h AEL) were pooled. Note that LRS methods without size selection (ONT cDNA and DRS, blue and gray) cluster further from mRNA-seq expression estimates (black) than ONT cDNA with size selection (red). (F) Cumulative plot representing the fraction of long-read 5′ ends that overlap with a TSS described in the Eukaryotic Promoter Database in a window of 50 nt, as a function of long-read 5′ end counts per million. A 5′ pile-up was defined as a cluster of >30 counts per million per window (dashed line). (G) Pie chart representing the number and proportion of 5′ pile-ups that overlap (purple) with a TSS described in the Eukaryotic Promoter Database. Non-overlapping pile-ups (gray in the left pie chart) were assessed for the gene region of occurrence (right) as annotated in ENSEMBL. (H) Cumulative enrichment plots of RNA Pol II ChIP-seq signal, H3K4me3 ChIP signal, and ATAC-seq signal detected at 5′ pile-ups (±2 kb) that overlapped (purple) or not (gray) with TSSs annotated in the Eukaryotic Promoter Database. ChIP-seq and ATAC-seq data from Drosophila heads are from modENCODE., (I) Venn diagram describing the overlap of mRNA 3′ ends of LRS reads after filtering (CIA) with filtered-out 3′ ends (discarded) and Ensembl-annotated mRNA 3′ ends. 3′ ends detected by FLAM-seq or DRS represent CIA 3′ends (purple); not-detected 3′ ends (gray) were discarded. (J) Nucleotide composition profiles (spanning 200 nt, top) and sequence logos (spanning 40 nt, bottom) of LRS reads at the cleavage site for each denoted category of 3′ ends from our processing pipeline. Noisy, A-rich distributions are indicative of internal priming. The left and middle panel nucleotide distribution profiles are also shown in Figure 1 and reproduced here for side-by-side comparison with the Ensembl-only category. (K) In each tissue, proportion of 3′ ends at which the indicated poly(A) signals were detected for each category (CIA or discarded [Dc]). Data from the two embryo datasets (14–16 h AEL and 18–20 h AEL) were pooled. (L) In CIA transcripts, proportion of 3′ ends carrying a novel (purple) or a previously annotated (gray) 3′ end. CIA transcripts were categorized by poly(A) signal. Replicates per tissue: ONT cDNA: heads, n = 6; embryos 14–16 h, n = 3; embryos 18–20 h, n = 3; ovaries n = 3. FLAM-seq and Iso-seq: heads, n = 3; DRS: heads, n = 1, embryos 14–16 h, n = 3; ovaries, n = 3. Illumina TrueSeq mRNA-seq: each tissue, n = 2.
Figure S2
Figure S2
Transcription start sites drive tissue-specific 3′ end expression, related to Figures 1 and 2 (A) Number and proportion of novel (red) and previously annotated (gray) isoforms in the full CIA transcriptome assembly dataset across tissues. (B) Proportion and number of newly identified features (red, novel) that contribute to newly identified isoforms. Most previously unannotated isoforms arise from the differential use of known (annotated) splice junctions with the canonical splice signal and from alternative 3′ end site usage (from 6,483 novel 3′ ends). (C) Proportion of structural and quality annotation of novel transcript isoforms (SQANTI) categories found in the CIA transcriptome assembly as a function of transcript length. The number of transcripts in each category is indicated in parentheses. Transcript lengths were binned by kb. (D) Type and percentage of splicing events found in CIA isoforms. Newly identified isoforms (red) showed no splice class bias, compared with previously annotated isoforms. A3, alternative 3′ splice site; A5, alternative 5′ splice site; AF, alternative first exon; AL, alternative last exon; MX, mutually exclusive exon; RI, retained intron; CE, cassette exon. (E) Number of mRNA isoforms found expressed per gene, in each tissue. (F and G) Overlap of transcript expression across tissues considering all reads from all LRS approaches (F), or sub-sampling 4.3 million ONT cDNA reads (G). Isoforms from 14- to 16-h and 18- to 20-h AEL embryos were pooled in (G). 4.3 million reads were used for subsampling because it represents the smallest read number obtained for an individual tissue (ovaries). Isoforms were considered distinct if they differed by more than 10 nt at exon boundaries, 50 nt at the 5′ end, or 150 nt at the 3′ end. (H) Contribution of coding sequence and 3′ UTR length to transcript length for long (>5 kb) transcripts across tissues. ∗∗∗p < 2.2e−16 (ANOVA). Data from the two embryo datasets (14–16 h AEL and 18–20 h AEL) were pooled. (I) Distribution of genes by mean poly(A) tail length for each tissue. Data from the two embryo datasets (14–16 h AEL and 18–22 h AEL) were pooled. (J) Increase in poly(A) tail length as a function of transcript length. Poly(A) tails of mitochondrial mRNAs were included for comparison. (K) Proportion of genes that undergo ATSS in each PAS category. ∗∗∗p < 0.001 (two-tailed Fisher’s exact test). (L and M) 3′ end diversity as a function of the number of TSSs per gene (L) and TSS diversity as a function of the number of 3′ ends per gene (M). The Shannon index is a measure of diversity that considers the relative abundance of different species (individual 5′-3′ isoforms) in a population (the sum of all 5′-3′ isoforms). To account for possible coverage biases, the analysis of the whole dataset (black line) was also performed in randomly sampled fractions of the pooled nanopore cDNA data (in grayscale). (N) 5′-3′ isoforms across the Ensembl and CIA reference transcriptomes. 5′-3′ isoforms were considered distinct if they differed by more than 50 nt at the 5′ end or 150 nt at the 3′ end. Comparison after gene expression filtering (>2 transcripts per million [TPM]). (O) Saturation analysis of 5′-3′ isoforms of ATSS-APA genes in the tissue pool, grouped by their expression in transcripts per million (TPM). Reads were randomly sampled in the indicated fractions and the assembly pipeline including 3′ end correction was performed in each fraction. (P) Differential expression of 3′ ends in heads compared with ovaries, plotted as a function of the differential expression of the 5′ end associated with each 3′ end. Red represents 5′-3′ isoforms with a significant 5′-3′ link, i.e., a significant expression change for both the 3′ end and its associated 5′ end (|(log2FC)| > 0.5 and adj. p value < 0.05, Wald test, 3 replicates per tissue). (Q) For all tissue-specific TSSs, or 3′ ends, number of associated 3′ ends or TSSs, respectively, that are also tissue-specific. (R) Number of genes with two or more links in which the expression bias is opposite between the two tissues (bidirectional). Significant links were determined as: |log2FC (5′-3′ isoform expression)| > 1.5 and adj. p value < 0.01 (Wald test, 3 replicates per tissue). (S) RT-qPCR quantification of the indicated transcript regions in flies in which dCas9-VPR was recruited to nervous-system TSSs for activation (purple). In control flies, dCas9-VPR was co-expressed with a non-targeting sgRNA (gray). Shown are five further genes for which TSS activation was successful in heads (in addition to Fatp1 shown in Figure 2): Malvolio (Mvl), tout-velu (ttv), tramtrack (ttk), wunen (wun), and charlatan (chn). RNA levels were normalized to RpL32 mRNA, and levels in control flies were set to the value 1. Error bars represent mean ± SD of four biological replicates (five heads per replicate) for each genotype. p < 0.05, ∗∗p < 0.01, ∗∗∗p < 0.001 (one-tailed Student’s t test).
Figure 2
Figure 2
Transcription start sites drive tissue-specific 3′ end expression (A) Gene categorization according to TSSs and PASs detected in CIA full-length isoforms. 5′-3′ isoforms were considered distinct if they differed by more than 50 nt at the 5′ end or 150 nt at the 3′ end. The use of several TSSs (arrows) and PASs (stripes) characterizes ATSS and APA genes, respectively. (B) Proportion of genes that undergo APA in each TSS category. ∗∗∗p < 0.001 (two-tailed Fisher’s exact test). (C) Number of 5′-3′ isoforms that show a significant difference in expression between heads and ovaries per gene, for all 1,020 ATSS-APA genes expressed in both tissues. Significant links were determined as: |log2FC (5′-3′ isoform expression)| > 1.5 and adj. p value < 0.01 (Wald test, 3 replicates per tissue). (D) Proportion of genes in which 3′ ends that are enriched in one tissue over the other are associated with a TSS enriched in the same tissue (|log2FC| > 0.5 and adj. p value < 0.05, Wald test, 3 replicates per tissue). Purple indicates that enrichment occurs in both tissues (bidirectional) for at least two PASs. (E) Glut1 genomic alignment coverage tracks for long reads from heads and ovaries, and depiction of full-length reads representing distinct 5′-3′ isoforms. Read counts per isoform are shown to scale, but each line represents multiple reads. Significant 5′-3′ links are colored in red (heads) and blue (ovaries). Isoforms represented in gray are found in both tissues. Some introns (dashed lines) are not drawn to scale. (F) Differential isoform expression in Drosophila heads compared with ovaries for a panel of genes that display bidirectional 5′-3′ isoform regulation. Isoforms with a significant 5′-3′ link are colored blue (ovary link) and red (head link). (G) CRISPRa in fly tissues. Each fly expresses sgRNAs complementary to a tissue-enriched TSS. Association of the sgRNA with a co-expressed dCas9 protein, fused with the transcriptional activator VPR, induces gene activation at the target TSS (red). 5′-3′ isoforms are represented as boxes joined by a straight line; significant links are colored. (H and I) RT-qPCR quantification of the indicated transcript regions in flies in which dCas9-VPR was recruited to nervous-system TSSs for activation (purple). In control flies, dCas9-VPR was co-expressed with a non-targeting sgRNA (gray). TSS activation of two representative genes, Fatty acid transport protein 1 (Fatp1) and Malvolio (Mvl) is shown in heads (H) and ovaries (I). RNA levels were normalized to RpL32 mRNA, and levels in control flies were set to the value 1. Error bars represent mean ± SD of four biological replicates for each genotype and tissue. p < 0.05 and ∗∗p < 0.01 (one-tailed Student’s t test). See also Figure S2 and Tables S4 and S5.
Figure S3
Figure S3
Dominant promoters drive PAS choices, related to Figure 3 (A) Cumulative plot representing the fraction of ATSS-APA genes as a function of the fraction of cells co-expressing more than one 3′ end across cell types with an expression of more than 0.1 normalized counts. (B) Proportion of ATSS-APA genes in which two or more isoforms were found to be expressed in the indicated percentage of cells in single-cell RNA-seq data from the Drosophila Brain Atlas. For most genes (above the 0.5 proportion), most (over 50%) cells express two or more 3′ ends. (C) t-distributed stochastic neighbor embedding (t-SNE) maps representing 3′ end expression in Drosophila brain cell types for the two representative genes Multiplexin (Mp) and stathmin (stai). Cells are colored according to their expression of either only the proximal (red), only the distal (blue), or both 3′ end isoforms (purple). Shown below are the gene model and 5′-3′ reads representing the expression of the detected 5′-3′ isoforms. Some introns (dashed lines in the gene model) are not drawn to scale. (D) Schematic representation of how TSS and 3′ end contributions to 5′-3′ isoform expression were calculated. Full-length 5′-3′ reads were quantified and assigned to 5′-3′ isoforms. For a given 3′ end, the contribution of each 5′-3′ isoform to the expression of the 3′ end was calculated (pink), as well as for a given TSS, the contribution of each 5′-3′ isoform to the expression of the 5′ end (orange). A TSS is termed a dominant promoter for a 3′ end if the respective 5′-3′ isoform expression has a contribution to 3′ end expression significantly higher (p < 0.1, chi-squared test with Monte Carlo simulation and Benjamini-Hochberg correction, also see E) than that of all other 5′-3′ isoforms for the same 3′ end. (E) TSS bias in ATSS-APA genes assessed using multinomial testing in Drosophila heads. The observed vs. expected counts of 5′-3′ isoforms were used for multinomial testing (chi-squared test with Monte Carlo simulation and Benjamini-Hochberg correction, n = 3). Genes are represented as dots, ranked by p value and color-coded according to bias score (promoter dominance score: absolute value of residuals). Highest-ranked genes (220 genes in the brain) represent near-exclusive 5′-3′ combinations, as exemplified by stai. (F) Promoter dominance and absence thereof (no TSS bias) shown on representative ATSS-APA genes with two TSSs and two PASs. The proportional contribution of the first TSS (red) and the second TSS (blue) to the expression of the proximal and the distal 3′ end of the same gene are indicated. Lines crossing signify TSS contributions that differ significantly between the PASs. (G) Pie chart representing the percentage of dominant promoters that constitute the top expressed TSS of the gene in heads. (H) Scatterplot showing the expression ratio between isoforms expressing the distal and proximal PAS, respectively, measured by long-read sequencing (ONT cDNA), in function of ratios measured by mRNA-seq (Illumina short reads). The ratios were calculated by estimating the ratio of normalized TPM (transcripts per million) assigned to proximal and distal 3′ ends in APA genes. Each dot represents a gene. The correlation coefficient (two-tailed Pearson correlation) is indicated for genes with a dominant promoter (promoter dominance) and TSS-unbiased genes (no significant TSS bias). (I) Proportion of 5′-3′ isoforms by category, expressing the indicated types of coding sequence, as a function of coding sequence length. Coding sequences are categorized by length within the gene context and represent either the longest, shortest, or an intermediate CDS isoform. Coding sequences of a gene were considered of identical length (all same) if none differed by more than 200 nt. 5′-3′ isoforms are grouped into 5′-3 isoforms with a dominant promoter (dominant) and 5′-3′ isoforms with no dominant promoter (not dominant). (J and K) Saturation analysis of splice junctions (J) and splice combinations (K) in CIA transcripts, grouped by their expression in number of reads. Reads were randomly sampled in the indicated fractions and a junctions (J) or combinations (K) database was built for each fraction. Splice junctions are exon-exon junctions. Splice combinations are unique assemblies of consecutive exons for each gene. Exons containing, or upstream of, a TSS (first exon), or containing or downstream of a PAS (last exon), were excluded from the analysis. (L) Long-reads-based alternative splicing estimation and recognition (LASER) framework to identify TSS biases in alternatively spliced (AS) genes (left), and splicing biases in alternatively polyadenylated (APA) genes (right). TSS-exon bias: for each splice junction of each ATSS-AS gene, the observed vs. expected frequencies of TSS-junction combinations were calculated to identify TSSs disproportionately associated with the junction (TSS-exon links). Exon-PAS bias: for each PAS of each AS-APA gene, the observed vs. expected frequencies of splice junction-PAS combination were calculated to identify splice junctions disproportionately associated with the PAS (exon-PAS links). Significant TSS-exon and exon-PAS links were identified by multinomial testing (p < 0.1, chi-squared test with Monte Carlo simulation and Benjamini-Hochberg correction) and assigned a linkage score (sum of squares of residuals). Splice junctions are exon-exon junctions. (M) Genes in which alternative polyadenylation is linked to alternative splicing (exon-PAS links) or transcription start sites (TSS-PAS link: promoter dominance), or both. Intersections between the gene sets are depicted as connecting lines. The number of genes in each exclusive group is indicated. Only 81 genes with an exon-PAS link were identified outside of the ATSS-APA gene group, and only 21 within the ATSS-APA gene group that were not associated with a dominant promoter (TSS-PAS link). (N) Type and number of alternative splicing events found in mRNA isoforms transcribed from dominant promoters: alternative 3′ splice site; alternative 5′ splice site; intron retention; mutually exclusive exon; cassette exon.
Figure 3
Figure 3
Dominant promoters drive PAS choices (A) Representative examples of ATSS genes with promoter dominance (stai, left) and no TSS bias (Act5C, right). Nanopore full-length reads (black) are shown below the gene models. Pie charts represent the contributions of each TSS to the expression of each 3′ end. PASs subjected to promoter dominance are represented as stripes in the color of their respective linked TSS. Some introns (dashed lines) are not drawn to scale. (B) LATER framework. For each PAS of each ATSS-APA gene, the observed vs. expected frequencies of 5′-3′ isoforms were calculated to identify TSSs that disproportionately contribute to PAS expression (promoter dominance). (C) Expected frequencies of 5′-3′ isoforms shown as a function of the frequencies measured for each PAS in heads. Significant 5′-3′ isoforms by multinomial testing (p < 0.1, chi-squared test with Monte Carlo simulation and Benjamini-Hochberg correction, 3 replicates, pooled) are represented as purple dots (promoter dominance); isoforms with no significant TSS bias are in gray. (D) PAS usage when either the canonical (AAUAAA) or no detected (none) poly(A) signal is found within a 50-nt window of the most proximal PAS of the gene, in APA genes with a single promoter (left) and in APA-ATSS genes with a dominant promoter (right). Proximal and distal denote PASs located in the proximal 20% or distal 80% of the 3′ UTR, respectively. ∗∗∗p < 0.001 (two-tailed Fisher’s exact test). (E) Proportion of genes in each category displaying a significant TSS-exon link (top, assessed by LASER), exon-PAS link (middle, LASER), or TSS-PAS link (promoter dominance, bottom, LATER). (F) Proportion of ATSS-APA genes with TSS-PAS links that also exhibit at least one exon-PAS link, and vice versa. (G) Strength of AS-APA links in presence (Dom P) and absence (other) of a dominant promoter. The linkage score corresponds to the sum of squares of residuals (×102) from the LASER analysis. ∗∗∗p = 6.3e−11 (two-tailed Student’s t test). (H) Schematic of orb mRNA isoforms. In orbΔDP flies, the region surrounding the dominant promoter was deleted (dashed box). Pie charts show the contribution of each TSS to the expression of each 3′ end in wild-type flies. (I) RT-qPCR quantification of the indicated transcript regions in orbΔDP and control embryos (18–20 h AEL). RNA levels were normalized to orb coding sequence (CDS), and levels in control flies were set to the value 1. Error bars represent mean ± SD of three biological replicates for each genotype. Control flies are progeny of a non-mutated sibling of the parental orbΔDP fly. See also Figure S3 and Table S4.
Figure 4
Figure 4
Functional impact of promoter dominance on transcriptome diversity and tissue identity (A) Cumulative distribution of PhastCons conservation scores for 5′ UTRs transcribed from dominant promoters (DomP), other 5′ UTRs of dominant-promoter genes (non-domP), and 5′ UTRs of TSS-unbiased genes. (B) Cumulative distribution of PhastCons scores for 3′ UTR sequences generated through the use of PASs linked to dominant promoters (DomP) and in genes with no TSS bias. 3′ UTR sequences upstream (DomP proximal) and downstream (distal) of the proximal PAS, and the entire 3′ UTR (no TSS bias), were used for the analysis. (C) Maps of co-evolved nucleotides, in all-by-all comparisons, in the genomic regions of stai and Act5C. In the grid, the normalized mutual information (co-evolution score) is represented in color for each position pair. Dashed arrows indicate regions of comparison between promoter-proximal sequences and distal 3′ UTRs. Dominant promoters and linked 3′ UTR sequences are in red. (D) Co-evolution scored for dominant (DomP) compared with non-dominant (non-domP) promoters. ∗∗p = 0.0037 (two-tailed Student’s t test). The co-evolution score for each TSS was calculated as the sum of co-evolution score maxima in a matrix region comparing the regions TSS − 1 kb and 3′ UTR (entire sequence). (E) Proportion of genes with (Dom P) or without (TSS-unbiased) promoter dominance that display co-evolution for at least one TSS. ∗∗∗p = 0.0002112 (two-tailed Fisher’s exact test). A TSS was considered to display co-evolution if the TSS’s co-evolution score was in the top 50% quartile of all TSS scores. In (D) and (E), all TSSs of 100 ATSS-APA genes were scored by promoter dominance p value, the top 50 (DomP), and bottom 50 (TSS-unbiased) genes. See also Figure S4.
Figure S4
Figure S4
Functional impact of promoter dominance on transcriptome diversity and tissue identity, related to Figure 4 (A) 3′ UTR sequence length gained or lost by the predicted shift in PAS selection as a result of promoter dominance, for 173 dominant-promoter genes, in fly heads. “Gained” and “lost” refers to dominant-promoter-3′ UTRs associated with the distal and proximal PAS, respectively. (B) Number of potential binding sites (7-mers) gained (blue) or lost (red) by the predicted shift in PAS selection as a result of promoter dominance, for a set of 65 highly conserved and highly expressed microRNAs (collapsed into 52 seed sequences), for 173 dominant-promoter genes, in fly heads. The total number of gained and lost sites and the 3′ UTR length difference between proximal and distal isoforms are indicated at the bottom. (C) Number of binding motifs for the indicated RNA-binding proteins (RBPs) gained or lost by the predicted shift in PAS selection as a result of promoter dominance, for 173 dominant-promoter genes, in fly heads. (D) RBP binding motifs enriched in dominant-promoter 3′ UTRs associated with the distal PAS, compared with 3′ UTRs associated with the proximal PAS. (E) Predicted microRNA binding sites enriched in dominant-promoter 3′ UTRs associated with the distal PAS, compared with 3′ UTRs associated with the proximal PAS. MicroRNAs detected in Drosophila heads (MirGeneDB v2.1) are shown in red. (F) Enriched gene ontology terms in 1,023 mRNAs expressed in heads that are predicted targets for dme-miR-2279-5p.
Figure S5
Figure S5
TSSs exert promoter dominance through specific chromatin signatures, related to Figure 5 (A) Heatmaps and cumulative enrichment plots of ChIP-seq signal at TSS ± 2 kb for RNA Pol II, the histone marks H3K4me3, H3K9Ac (typical for active promoters and TSSs of expressed genes), H3K27Ac, and H3K4me2 (active enhancer and TSS marks), the histone variant H2A.Z and the histone mark H3K18Ac genome-wide. Genes are grouped by CIA categories. ChIP-seq data from Drosophila heads are from modENCODE. (B–D) ChIP-seq peak enrichment analysis at the TSS and PAS of dominant promoter isoforms. Represented are factors significantly enriched (adj. p value < 0.05) at either the TSS ± 150 nt (B), the associated PAS ± 150 nt (C), and both (D), ranked by the ratio of total peaks that map to the TSS (B and D) or PAS (C). (E) Enrichment (blue) and depletion (red) of distal 3′ UTR RNA expression in the indicated mutants compared with control embryos. mRNA-seq heatmaps and profile plots display 0.5 kb upstream of the proximal poly(A) site (prox), and the distal 3′ UTR downstream (distal, scaled region). For CBP and Psc, results from two independent mutant alleles are shown. RNA was obtained from hand-sorted embryos at 16–18 h AEL in three biological replicates for each genotype (except CBP mutants: 14–16 h AEL, four replicates). Genes are grouped into three clusters by k-means clustering using both CBP ChIP-seq signal at proximal PASs and mRNA-seq signal in nej3 and nejEP1179 mutants. Heatmaps for CBP mutants, also shown in Figure 5, are reproduced here with a different color scale for side-by-side comparison with the other mutants. CBP, Dfd, E(z), and Psc were found enriched at the TSS of dominant promoters and their associated 3′ end; Spps was found enriched at the TSS of dominant promoters only.
Figure 5
Figure 5
TSSs exert promoter dominance through specific chromatin signatures (A) Heatmaps representing ChIP-seq signal at TSS ± 2 kb genome-wide for the histone variant H2A.Z and the histone mark H3K18Ac. Genes are grouped by k-means clustering, using both H2A.Z and H3K18Ac signal. On average, ATSS-APA genes measure 20.010 kb from TSS to distal PAS. (B) For each cluster, the proportion of dominant promoters (in ATSS-APA genes) is shown. ∗∗∗p < 2.2e−16 and ∗∗p = 0.006 (two-tailed Fisher’s exact test). (C) ChIP-seq peak enrichment analysis of the TSS and PAS of dominant promoter isoforms. Factors significantly enriched (adj. p value < 0.01) at both TSS ± 150 nt and PAS ± 150 nt are shown, ranked by the ratio of total peaks that map to dominant promoters. (D) CBP ChIP-seq signal and full-length reads representing distinct 5′-3′ isoforms of the gene Calnexin (Calx). The dominant promoter, its associated PAS, and long reads of the corresponding 5′-3′ isoform are colored in red. CBP ChIP-seq data from Drosophila heads are shown as a log2 ratio normalized to input. (E) Enrichment of CBP ChIP-seq signal at transcript TSSs (±2 kb) and proximal PASs (±2 kb) and RNA expression of distal 3′ UTRs in CBP mutants (two independent alleles, nej3 and nejEP1179), compared with control embryos. mRNA-seq heatmaps and profile plots display 0.5 kb upstream of the proximal PAS (prox) and the distal 3′ UTR downstream (distal, scaled region). Genes are grouped into three clusters by k-means clustering, using both CBP ChIP-seq signal at proximal PASs and mRNA-seq signal in nej3 and nejEP1179 mutants. mRNA-seq was performed on RNA extracted from 14- to 16-h AEL embryos in four biological replicates for each genotype. (F) mRNA-seq signal tracks of the gene chickadee (chic), whose distal PAS selection depends on p300/CBP. Dominant promoters for each PAS are indicated in the respective color. ChIP-seq data from Drosophila heads are from modENCODE. (G) 3′ end selection change in CBP mutant embryos (nej3), calculated as the change in mRNA expression of the distal transcript regions, compared with control embryos, for PASs linked to a dominant promoter (Dom P) and those with no TSS bias. ∗∗∗p = 6.7e−8 (two-tailed Student’s t test). (H) Proportion of ATSS-APA genes with (Dom P) or without (no TSS bias) dominant promoters in which 3′ end selection was significantly affected (p < 0.05, Wald test) in CBP mutant embryos (nej3). ∗∗∗p = 3.5e−11 (two-tailed Fisher’s exact test). See also Figure S5 and Table S4.
Figure 6
Figure 6
Dominant promoters drive PAS selection in human brain organoids (A) Organoid CIA assembly pipeline. The distribution of novel and previously annotated isoforms as a function of transcript length is indicated (n = 3). (B) Proportion of genes that undergo APA in each TSS category. ∗∗∗p < 0.001 (two-tailed Fisher’s exact test). (C) Identification of TSS biases in human brain organoids. The plot was generated as in Figure 3C. 38% of ATSS-APA genes show a significant bias (p < 0.01, chi-squared test with Monte Carlo simulation and Benjamini-Hochberg correction). (D) Representative example of a gene with promoter dominance in brain organoids. Full-length reads represent distinct 5′-3′ isoforms of the gene CAST. The dominant promoter, its associated PAS, and long reads of the corresponding 5′-3′ isoform are colored in red in the gene model. Pie charts represent the contributions of each TSS to the expression of each 3′ end. (E) PAS usage when the canonical poly(A) signal AAUAAA is found within a 50-nt window of the most proximal PAS of the gene. Proximal and distal denote PASs found in the proximal 20% or distal 80% of the 3′ UTR, respectively. ∗∗∗p < 0.001 (two-tailed Fisher’s exact test). see also Figure S6 and Tables S1–S3 and S4.
Figure S6
Figure S6
Dominant promoters drive PAS selection in human brain organoids, related to Figure 6 (A) Venn diagram describing the overlap of 5′-3′ isoforms in the Ensembl and CIA reference transcriptomes for human brain organoids (three biological replicates). 5′-3′ isoforms were considered distinct if they differed by more than 50 nt at the 5′ end or 150 nt at the 3′ end. Comparison after gene expression filtering. Organoid CIA identified around 22,000 5′-3′ isoforms. (B) TSS bias in ATSS-APA genes assessed using multinomial testing in human brain organoids. The observed vs. expected counts of 5′-3′ isoforms were used for multinomial testing (chi-squared test with Monte Carlo simulation and Benjamini-Hochberg correction). Genes are represented as dots, ranked by p value and color-coded according to bias score (absolute value of residuals). (C) ChIP-seq peak enrichment analysis at the TSS and PAS of dominant promoter isoforms. Represented are factors significantly enriched (adj. p value < 0.1) at the TSS ± 150 nt (left), and at both the TSS ± 150 and its associated PAS ± 150 nt (right), ranked by the ratio of total peaks that map to the dominant promoter. Transcription factors and co-activators reported to influence 3′ end site choice are in bold; homologs of p300/CBP are in red. Data are from the ReMap database.

Comment in

References

    1. Mitschka S., Mayr C. Context-specific regulation and function of mRNA alternative polyadenylation. Nat. Rev. Mol. Cell Biol. 2022;23:779–796. doi: 10.1038/s41580-022-00507-5. - DOI - PMC - PubMed
    1. LaForce G.R., Philippidou P., Schaffer A.E. mRNA isoform balance in neuronal development and disease. Wiley Interdiscip. Rev. RNA. 2022 doi: 10.1002/wrna.1762. - DOI - PMC - PubMed
    1. Gruber A.J., Zavolan M. Alternative cleavage and polyadenylation in health and disease. Nat. Rev. Genet. 2019;20:599–614. doi: 10.1038/s41576-019-0145-z. - DOI - PubMed
    1. Mariella E., Marotta F., Grassi E., Gilotto S., Provero P. The length of the expressed 3′ UTR is an intermediate molecular phenotype linking genetic variants to complex diseases. Front. Genet. 2019;10:714. doi: 10.3389/fgene.2019.00714. - DOI - PMC - PubMed
    1. Li L., Huang K.L., Gao Y., Cui Y., Wang G., Elrod N.D., Li Y., Chen Y.E., Ji P., Peng F., et al. An atlas of alternative polyadenylation quantitative trait loci contributing to complex trait and disease heritability. Nat. Genet. 2021;53:994–1005. doi: 10.1038/s41588-021-00864-5. - DOI - PubMed

Publication types