. 2023 May 13;15(1):86.
doi: 10.1186/s13148-023-01487-9.

Short-chain fatty acid-butyric acid ameliorates granulosa cells inflammation through regulating METTL3-mediated N6-methyladenosine modification of FOSL2 in polycystic ovarian syndrome

Affiliations

Short-chain fatty acid-butyric acid ameliorates granulosa cells inflammation through regulating METTL3-mediated N6-methyladenosine modification of FOSL2 in polycystic ovarian syndrome

Kailu Liu et al. Clin Epigenetics. .

Abstract

Polycystic ovary syndrome (PCOS) is an endocrine and metabolic disorder characterized by chronic low-grade inflammation. Previous studies have demonstrated that the gut microbiome can affect the host tissue cells' mRNA N6-methyladenosine (m6A) modifications. This study aimed to understand the role of intestinal flora in ovarian cells inflammation by regulating mRNA m6A modification particularly the inflammatory state in PCOS. The gut microbiome composition of PCOS and Control groups was analyzed by 16S rRNA sequencing, and the short chain fatty acids were detected in patients' serum by mass spectrometry methods. The level of butyric acid was found to be decreased in the serum of the obese PCOS group (FAT) compared to other groups, and this was correlated with increased Streptococcaceae and decreased Rikenellaceae based on the Spearman's rank test. Additionally, we identified FOSL2 as a potential METTL3 target using RNA-seq and MeRIP-seq methodologies. Cellular experiments demonstrated that the addition of butyric acid led to a decrease in FOSL2 m6A methylation levels and mRNA expression by suppressing the expression of METTL3, an m6A methyltransferase. Additionally, NLRP3 protein expression and the expression of inflammatory cytokines (IL-6 and TNF-α) were downregulated in KGN cells. Butyric acid supplementation in obese PCOS mice improved ovarian function and decreased the expression of local inflammatory factors in the ovary. Taken together, the correlation between the gut microbiome and PCOS may unveil crucial mechanisms for the role of specific gut microbiota in the pathogenesis of PCOS. Furthermore, butyric acid may present new prospects for future PCOS treatments.

Keywords: Butyric acid; Gut microbiome; Inflammation; PCOS; m6A modification.


Conflict of interest statement

The authors declare that they have no competing interests.

Figures
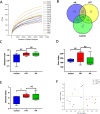
Fig. 1
Fig. 1
Diversity analysis of gut microbiota among three groups. A Shannon–Wiener curves, showing that the amount of sequencing data is large enough to reflect the vast majority of microbial information in the samples. B Venn diagram, showing the number of common and unique OTUs, and the similarity and overlap of OTUs among groups. C Simpson index of OTUs, Chao indexes of OTUs (D), and Shannon index (E) of OTUs in three groups. *P < 0.05. F Principal co-ordinates analysis (PCoA analysis). PC1 and PC2 represent the two suspected influencing factors of microbial composition migration. Percentage represents the contribution of principal coordinate components to sample composition differences. The greater the proximity between two sample points, the higher the degree of similarity in terms of species composition between the two samples
Fig. 2
Fig. 2
Composition and Linear discriminant analysis of gut microbiota among three groups. A Composition of species at family level among three groups. B Linear discriminant analysis (LDA) discriminant histogram of gut microbiota in three groups. Identification of the bacterial taxa with statistically significant difference between groups using LEfSe software and LDA. Taxa enriched in Control, FAT-PCOS, and HA-PCOS group are colored by red, green, and blue respectively (LDA > 2.0 and P < 0.05), the relative abundance of thesebiomarkers are shown in the histogram (mean and standard deviation values are plotted) under the corresponding cladogram. C The content of short chain fatty acids in serum of three groups of patients. *P < 0.05. D Spearman correlation heat map between clinical parameters and flora. The color of spots represents the Spearman correlation R-value between each bacterial taxa and clinical parameters. *P < 0.05
Fig. 3
Fig. 3
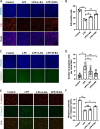
Butyric acid can improve the metabolism and inflammatory response of granulosa cells in inflammatory state. A, B Edu staining was used to detect KGN cells proliferation treated with LPS and low-dose(L-BA) and high-dose (H-BA) butyric acid. Scale bar: 100um, *P < 0.05, **P < 0.01. C, D Caspase3 activity kit was used to detect apoptotic KGN cells treated with LPS and low-dose and high-dose butyric acid for 48 h. Relative caspase3 activity was calculated by average positive cell ratio (The results were shown as means ± SD) (n = 3). Scale bar: 100um, *P < 0.05, **P < 0.01. E, F Mitochondrial membrane potential was detected by JC-1 staining. Red fluorescence indicates high mitochondrial membrane potential, while green fluorescence indicates low mitochondrial membrane potential. The higher the red/green ratio, the fewer apoptotic cells. (The results were shown as means ± SD) (n = 3). Scale bar: 100um, *P < 0.05, **P < 0.01
Fig. 4
Fig. 4
Butyric acid improves glucose transport in inflammatory KGN cells. A, B Glucose uptake of KGN cells was detected by 2-NBDG staining. Fluorescence intensity of 2-NBDG (green color) was determined by Image J software. Each value in the graph represents the relative units (fluorescence/cell numbers). Scale bar, 100 μm. *P < 0.05, **P < 0.01. C, D The distribution of GLUT4 in KGN cells was showed by immunofluorescence. Scale bar, 20 μm. *P < 0.05, **P < 0.01. E, F The protein expression of PPAR-γ1/2 and GLUT4 in the KGN cells after treated with butyric acid. *P < 0.05, n = 3. G The mRNA expression of PPAR-γ and GLUT4 in KGN cells after treated with butyric acid.. *P < 0.05, ** < 0.01, n = 3
Fig. 5
Fig. 5
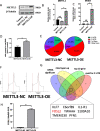
Sequencing analysis of KGN cells m6A. A, B The overexpression METTL3 plasmid was constructed. 24 h after it was transferred into KGN cells, the protein expression level of METTL3 was detected. The results showed that the expression of METTL3 in the overexpression plasmid group (OE) was significantly higher than that in the blank plasmid group (NC). Bars represent means ± SD, n = 3. *P < 0.05. C MRNA level of METTL3 increased significantly in the overexpression group. Bars represent means ± SD, n = 3. *P < 0.05. D Distribution of m6A fragments enriched by two groups of KGN cells in RNA, most of which are located in 3’UTR region. E Quantification analysis of m6A modification in the KGN cells of the METTL3-NC and METTL3-OE group. The m6A content in total RNA of KGN cells were detected by colorimetric assay. Bars represent means ± SD, n = 3. *P < 0.05 vs the control. F Metagene profiles of enrichment of m6A peaks across mRNA transcriptome of the METTL3-NC and METTL3-OE group. G Veen diagram shows that through enrichment analysis, eight potential targets are selected according to mRNA expression level, m6A modification level and motif region, and FOSL2 is determined as a target for subsequent research in combination with relevant literature. H The expression amount of FOSL2 mRNA motif1 in KGN cells of the two groups. qpcr results showed that when METTL3 was overexpressed in KGN, the expression of FOSL2 m6A modified motif1 increased. Bars represent means ± SD, n = 3. *P < 0.05
Fig. 6
Fig. 6
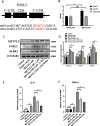
Butyric acid inhibits inflammation through METTL3/FOSL2/NLRP3 pathway. A, B qRT-PCR analysis of m6A motif1 and motif2 and non-peak region in the 3’-UTR of the FOSL2 transcript. Bars represent means ± SD, n = 3. *P < 0.05 for the differences between the indicated groups. C, D On the basis of overexpression of METTL3, we added LPS pretreatment, and then added low concentration butyric acid and high concentration butyric acid to detect the protein expression levels of METTL3, FOSL2 and NLRP3. Bars represent means ± SD, n = 3. *P < 0.05, **P < 0.01. E, F The mRNA expression level of IL-6 and TNF-α in several groups of KGN cells. Bars represent means ± SD, n = 3. *P < 0.05
Fig. 7
Fig. 7
Butyric acid improves ovarian inflammation in PCOS model mice. A Photomicrographs of representative ovarian cross section from four groups: Control group, PCOS group, PCOS + Low BA group, and PCOS + High BA group. *: developing follicles; ●: corpus luteum; #: cystic follicles. Bar = 500 μm. B Serum hormone level of mice in each group. Bars represent means ± SD, n = 5. *P < 0.05. C, D PPAR-γ and GLUT4 in ovarian tissue of mice in each group protein expression level. Bars represent means ± SD, n = 5. *P < 0.05. E, F NLRP3, TNF-α and IL-6 in ovarian tissue of mice in each group protein expression level. Bars represent means ± SD, n = 5. *P < 0.05
Fig. 8
Fig. 8
Butyric acid improves ovarian inflammation by inhibiting METTL3/FOSL2/NLRP3. Schematic representation of the effect of butyric acid on ovarian inflammation by inhibiting METTL3/FOSL2/NLRP3 pathway. The butyric acid produced by specific intestinal flora enters the blood circulation and finally reached the ovarian tissue. Under normal conditions, butyric acid could downregulate METTL3, thus reducing the m6A modification of FOSL2, finally reduced the downstream inflammatory reaction. In PCOS patients, due to the reduced of butyric acid, disorders of the intestinal flora lead to ovarian inflammation

References

    1. Azziz R, et al. Polycystic ovary syndrome. Nat Rev Dis Primers. 2016;2:16057. doi: 10.1038/nrdp.2016.57. - DOI - PubMed
    1. Yu J, et al. Characteristics and possible mechanisms of metabolic disorder in overweight women with polycystic ovary syndrome. Front Endocrinol (Lausanne) 2023;13:970733. doi: 10.3389/fendo.2022.970733. - DOI - PMC - PubMed
    1. Rostamtabar M, et al. Pathophysiological roles of chronic low-grade inflammation mediators in polycystic ovary syndrome. J Cell Physiol. 2021;236:824–838. doi: 10.1002/jcp.29912. - DOI - PubMed
    1. Popovic M, Sartorius G, Christ-Crain M. Chronic low-grade inflammation in polycystic ovary syndrome: is there a (patho)-physiological role for interleukin-1? Semin Immunopathol. 2019;41:447–459. doi: 10.1007/s00281-019-00737-4. - DOI - PubMed
    1. Li Y, et al. Dehydroepiandrosterone stimulates inflammation and impairs ovarian functions of polycystic ovary syndrome. J Cell Physiol. 2019;234:7435–7447. doi: 10.1002/jcp.27501. - DOI - PubMed

Publication types

MeSH terms