. 2022 Dec 30;15(3):10.16910/jemr.15.3.4.
doi: 10.16910/jemr.15.3.4. eCollection 2022.

Assessment of cognitive biases in Augmented Reality: Beyond eye tracking

Affiliations

Assessment of cognitive biases in Augmented Reality: Beyond eye tracking

Piotr Słowiński et al. J Eye Mov Res. .

Abstract

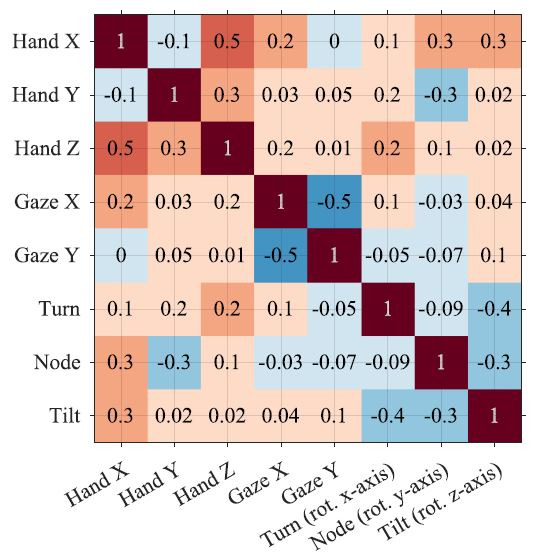
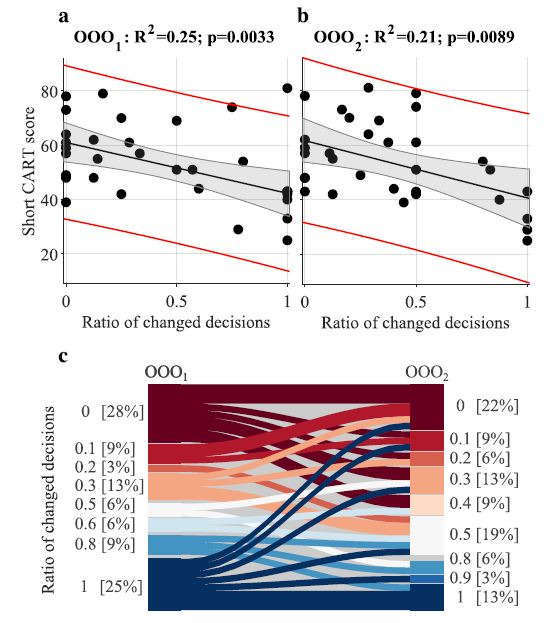
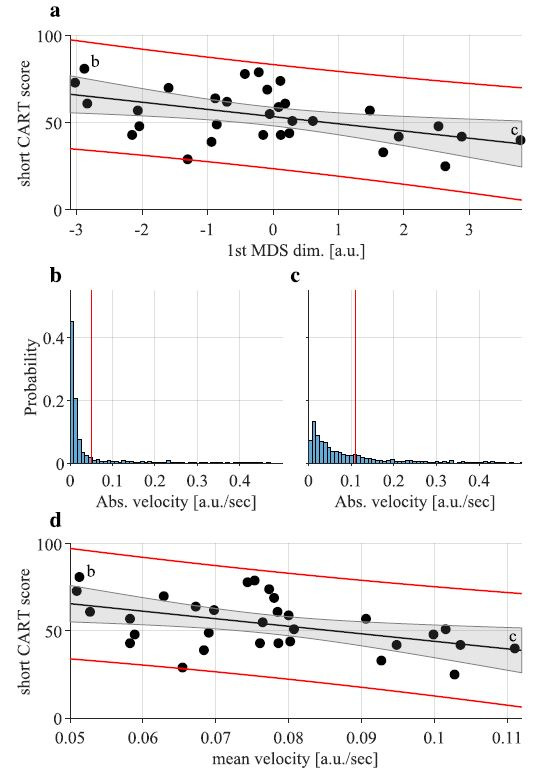
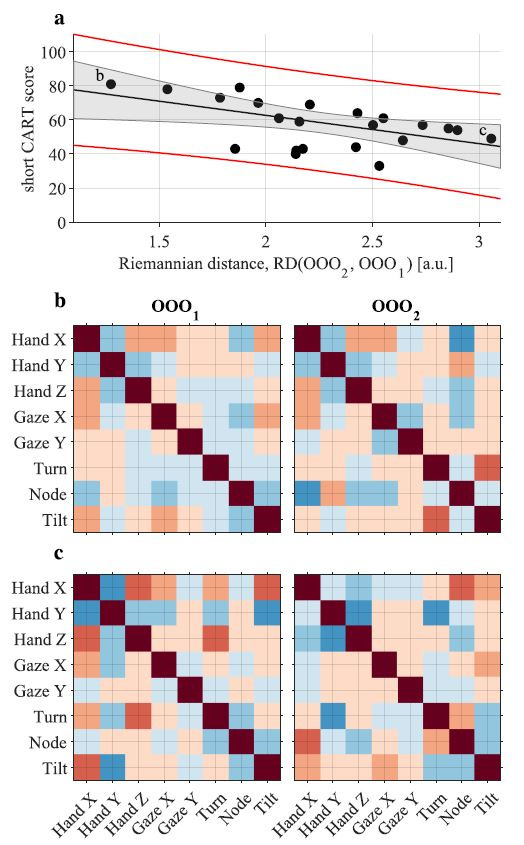
We study an individual's propensity for rational thinking; the avoidance of cognitive biases (unconscious errors generated by our mental simplification methods) using a novel augmented reality (AR) platform. Specifically, we developed an odd-one-out (OOO) game-like task in AR designed to try to induce and assess confirmatory biases. Forty students completed the AR task in the laboratory, and the short form of the comprehensive assessment of rational thinking (CART) online via the Qualtrics platform. We demonstrate that behavioural markers (based on eye, hand and head movements) can be associated (linear regression) with the short CART score - more rational thinkers have slower head and hand movements and faster gaze movements in the second more ambiguous round of the OOO task. Furthermore, short CART scores can be associated with the change in behaviour between two rounds of the OOO task (one less and one more ambiguous) - hand-eye-head coordination patterns of the more rational thinkers are more consistent in the two rounds. Overall, we demonstrate the benefits of augmenting eye-tracking recordings with additional data modalities when trying to understand complicated behaviours.

Keywords: Eye movement; augmented reality; cognitive bias; correlation matrix; earth mover’s distance; eye tracking; hand movement; head movement.


Conflict of interest statement

The author(s) declare(s) that the contents of the article are in agreement with the ethics described in http://biblio.unibe.ch/portale/elibrary/BOP/jemr/ethics.html and that there is no conflict of interest regarding the publication of this paper.

Figures

Figure 1.
Figure 1.
Hardware images. a. Pupil-labs eye-tracker. b. Dream Glass augmented reality goggles. c. Leap motion tracker.
Figure 2.
Figure 2.
An example of the ambiguous odd-one-out task – zebra has no horns, rhino has no fur, and cow is a domesticated animal. Graphics are assets from the unity asset store.
Figure 3.
Figure 3.
Visualisation of an example of the data collected in the odd-one-out task. a. hand, b. gaze and c. head time-series; vertical lines indicate times at which participant selected an object. In a. x (blue) corresponds to the left-right movement; y (orange) corresponds to up-down movement; z (yellow) is forward-backward motion. In b. x (blue) corresponds to the left-right movement; and y (orange) corresponds to up-down movement. In c. blue indicates left-right rotation along x-axis (turn); orange indicates up-down rotation along y-axis (nod); yellow indicates left-right rotation along z-axis (tilt). The visible discontinuities in the gaze data are due to missing data (confidence < 0.6).
Figure 4.
Figure 4.
Examples of the histograms of the total velocity of a. head, b. hand and c. gaze. The ranges of the velocities are reduced in comparison with the ranges used for analysis.
Figure 5.
Figure 5.
An example of a correlation matrix. Each entry in the correlation matrix is a Pearson’s correlation coefficient between two timeseries. The values are colour coded with negative values in blue and positive values in red; darker shades indicate lower/ higher values.
Figure 6.
Figure 6.
Correlation between ratio of the changed decisions in a) the 1st round and b) the 2nd round of the odd-one-out task and the short CART score. Black dots – indicate CART scores and corresponding ratios of changed decisions of individual participants, black line – fitted linear model, grey shaded region – 95% confidence bounds of the linear fit, red curves – 95% prediction bounds of the linear fit c. Sankey (flow) diagram illustrating change in distributions of the ratios of changed decisions in OOO1 and OOO2. Stacked bar plots show distribution of the ratios of changed decisions (rounded to a single decimal place). The connectors (flows) show change in behaviour of individual participants (they connect their ratios of changed decisions in OOO1 and OOO2).
Figure 7.
Figure 7.
a. correlation between x-coordinate (1st MDS dimension) of points representing distributions of absolute velocity of hand movements recorded in the OOO2 and the short CART score. Colours and symbols are the same as in Figure 6. b. and c. examples of the two distributions of absolute hand velocities indicate with b (short CART score 81) and c (short CART score 40) in panel a. red vertical line indicates mean velocity (b – 0.051[a.u./sec] and c – 0.11 [a.u./sec]) d. correlation between mean velocity of hand movements recorded in the OOO2 and the short CART score.
Figure 8.
Figure 8.
a. correlation of the Riemannian distance between correlation matrices from the two OOO rounds, RD(OOO1, OOO2), and the short CART score. Colours and symbols are the same as in Figure 6. b. shows two correlation matrices with of the participant that had the smallest change in the coordination pattern between the OOO1 (left) and OOO2 (right) c. shows two correlation matrices with of the participant that had the largest change in the coordination pattern between the OOO1 (left) and OOO2 (right).

References

    1. Anastasopoulos, D., Naushahi, J., Sklavos, S., & Bronstein, A. M. (2015). Fast gaze reorientations by combined movements of the eye, head, trunk and lower extremities. Experimental Brain Research, 233(5), 1639–1650. 10.1007/s00221-015-4238-4 - DOI - PMC - PubMed
    1. Araújo, D., Davids, K., & Hristovski, R. (2006). The eco-logical dynamics of decision making in sport. Psychology of Sport and Exercise, 7(6), 653–676. 10.1016/j.psychsport.2006.07.002 - DOI
    1. Ashton, M. C., & Lee, K. (2009). The HEXACO-60: A short measure of the major dimensions of personality. Journal of Personality Assessment, 91(4), 340–345. 10.1080/00223890902935878 - DOI - PubMed
    1. Beltrán, J., García-Vázquez, M. S., Benois-Pineau, J., Gutierrez-Robledo, L. M., & Dartigues, J.-F. (2018). Computational techniques for eye movements analysis towards supporting early diagnosis of Alzheimer’s disease: A review. Computational and Mathematical Methods in Medicine, 2018, 2676409. Advance online publication. 10.1155/2018/2676409 - DOI - PMC - PubMed
    1. Berthet, V. (2021). The measurement of individual differences in cognitive biases: A review and improvement. Frontiers in Psychology, 12, 630177. Advance online publication. 10.3389/fpsyg.2021.630177 - DOI - PMC - PubMed

LinkOut - more resources