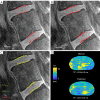
Deep-learning-based biomarker of spinal cartilage endplate health using ultra-short echo time magnetic resonance imaging
- PMID: 37179932
- PMCID: PMC10167428
- DOI: 10.21037/qims-22-729
Deep-learning-based biomarker of spinal cartilage endplate health using ultra-short echo time magnetic resonance imaging
Abstract
Background: T2* relaxation times in the spinal cartilage endplate (CEP) measured using ultra-short echo time magnetic resonance imaging (UTE MRI) reflect aspects of biochemical composition that influence the CEP's permeability to nutrients. Deficits in CEP composition measured using T2* biomarkers from UTE MRI are associated with more severe intervertebral disc degeneration in patients with chronic low back pain (cLBP). The goal of this study was to develop an objective, accurate, and efficient deep-learning-based method for calculating biomarkers of CEP health using UTE images.
Methods: Multi-echo UTE MRI of the lumbar spine was acquired from a prospectively enrolled cross-sectional and consecutive cohort of 83 subjects spanning a wide range of ages and cLBP-related conditions. CEPs from the L4-S1 levels were manually segmented on 6,972 UTE images and used to train neural networks utilizing the u-net architecture. CEP segmentations and mean CEP T2* values derived from manually- and model-generated segmentations were compared using Dice scores, sensitivity, specificity, Bland-Altman, and receiver-operator characteristic (ROC) analysis. Signal-to-noise (SNR) and contrast-to-noise (CNR) ratios were calculated and related to model performance.
Results: Compared with manual CEP segmentations, model-generated segmentations achieved sensitives of 0.80-0.91, specificities of 0.99, Dice scores of 0.77-0.85, area under the receiver-operating characteristic curve values of 0.99, and precision-recall (PR) AUC values of 0.56-0.77, depending on spinal level and sagittal image position. Mean CEP T2* values and principal CEP angles derived from the model-predicted segmentations had low bias in an unseen test dataset (T2* bias =0.33±2.37 ms, angle bias =0.36±2.65°). To simulate a hypothetical clinical scenario, the predicted segmentations were used to stratify CEPs into high, medium, and low T2* groups. Group predictions had diagnostic sensitivities of 0.77-0.86 and specificities of 0.86-0.95. Model performance was positively associated with image SNR and CNR.
Conclusions: The trained deep learning models enable accurate, automated CEP segmentations and T2* biomarker computations that are statistically similar to those from manual segmentations. These models address limitations with inefficiency and subjectivity associated with manual methods. Such techniques could be used to elucidate the role of CEP composition in disc degeneration etiology and guide emerging therapies for cLBP.
Keywords: Cartilage endplate (CEP); T2* relaxation time; disc degeneration; low back pain; ultra-short echo time magnetic resonance imaging (UTE MRI).
2023 Quantitative Imaging in Medicine and Surgery. All rights reserved.
Conflict of interest statement
Conflicts of Interest: All authors have completed the ICMJE uniform disclosure form (available at https://qims.amegroups.com/article/view/10.21037/qims-22-729/coif). RK and AJF report that the study was funded by a grant from the National Institute of Arthritis and Musculoskeletal and Skin Diseases (NIAMS). The other authors have no conflicts of interest to declare.
Figures


References
Grants and funding
LinkOut - more resources
Full Text Sources
Research Materials
