. 2023 Apr 21:14:1108025.
doi: 10.3389/fmicb.2023.1108025. eCollection 2023.

Microbial community and soil enzyme activities driving microbial metabolic efficiency patterns in riparian soils of the Three Gorges Reservoir

Affiliations

Microbial community and soil enzyme activities driving microbial metabolic efficiency patterns in riparian soils of the Three Gorges Reservoir

Yining Yang et al. Front Microbiol. .

Abstract

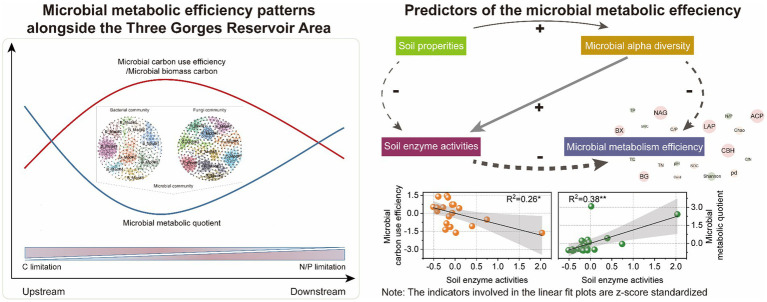
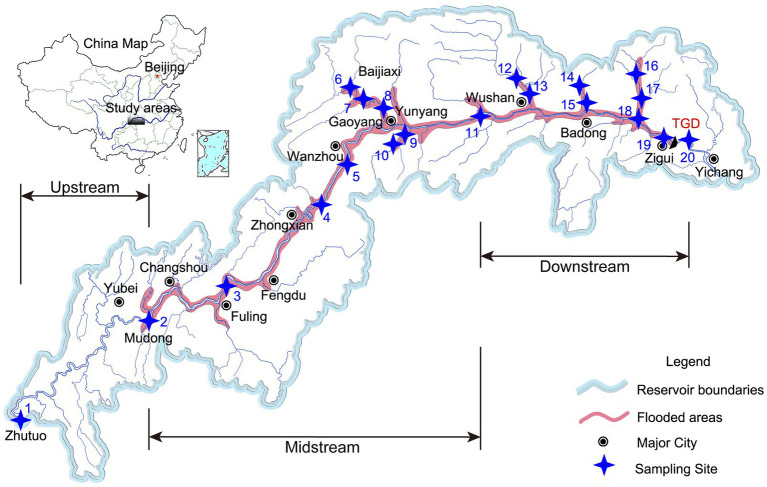
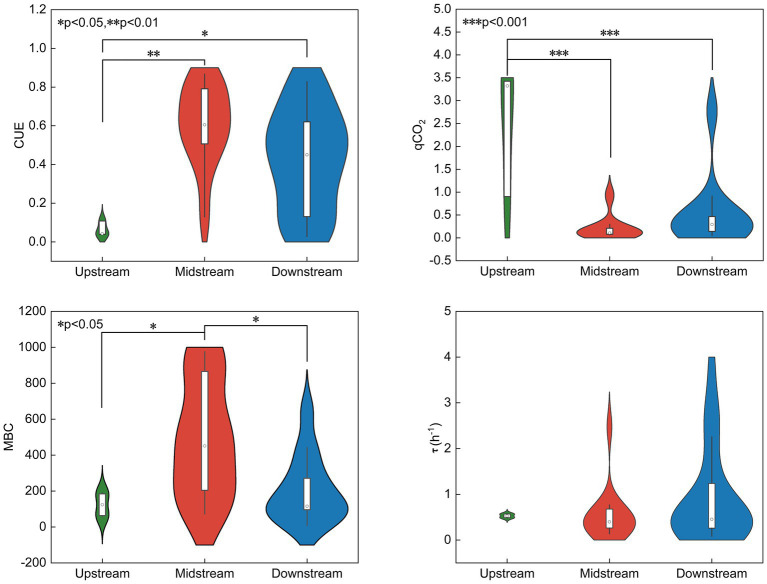
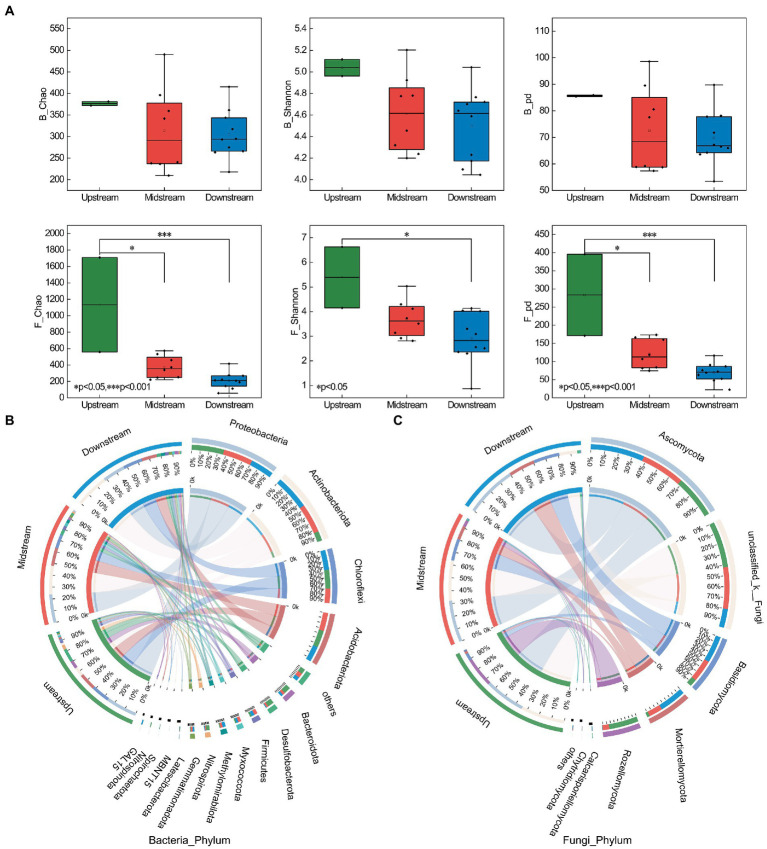
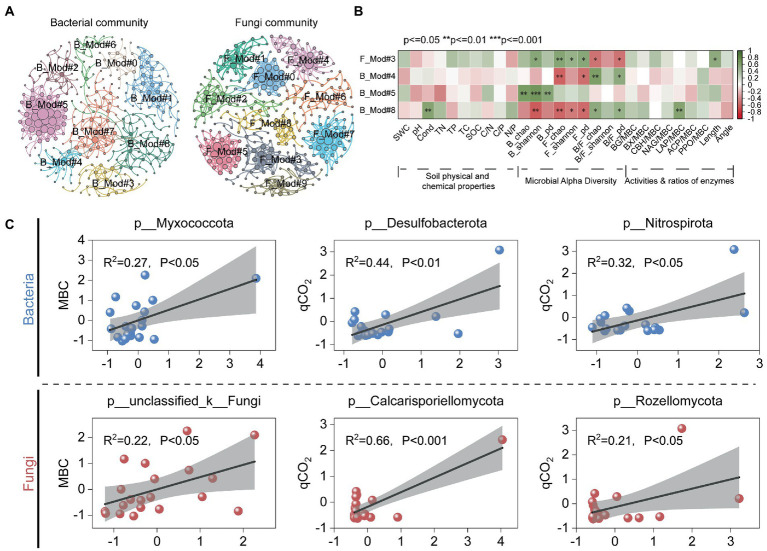
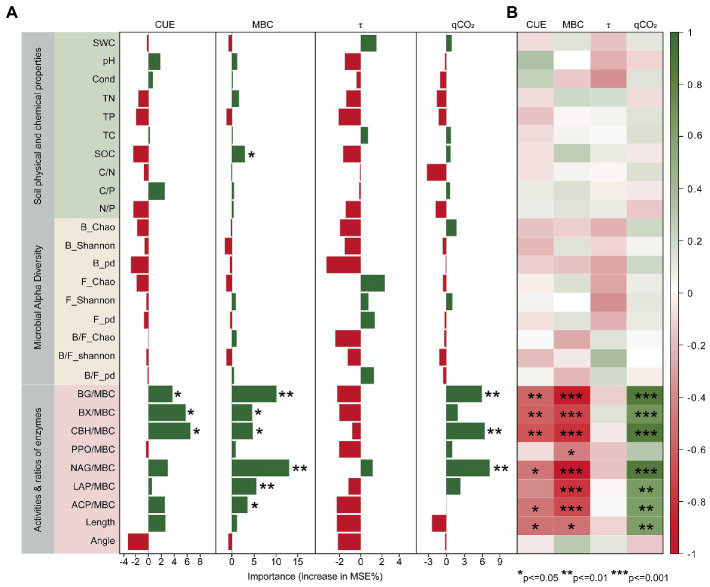
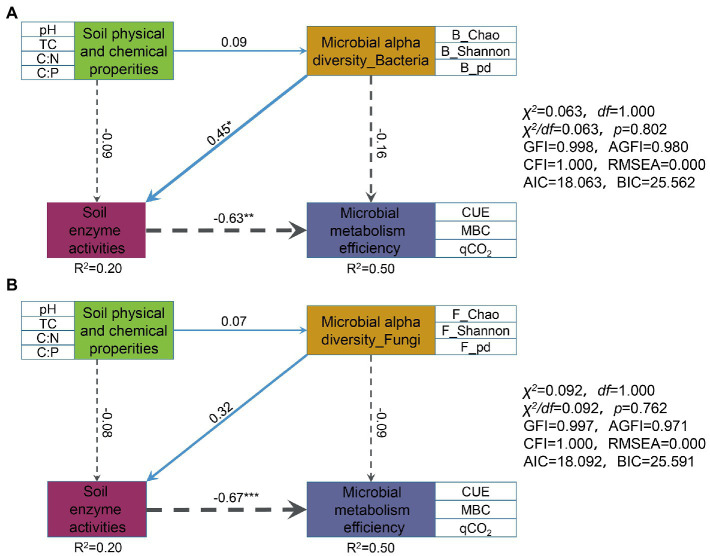
Riparian zones represent important transitional areas between aquatic and terrestrial ecosystems. Microbial metabolic efficiency and soil enzyme activities are important indicators of carbon cycling in the riparian zones. However, how soil properties and microbial communities regulate the microbial metabolic efficiency in these critical zones remains unclear. Thus, microbial taxa, enzyme activities, and metabolic efficiency were conducted in the riparian zones of the Three Gorges Reservoir (TGR). Microbial carbon use efficiency and microbial biomass carbon had a significant increasing trend along the TGR (from upstream to downstream); indicating higher carbon stock in the downstream, microbial metabolic quotient (qCO2) showed the opposite trend. Microbial community and co-occurrence network analysis revealed that although bacterial and fungal communities showed significant differences in composition, this phenomenon was not found in the number of major modules. Soil enzyme activities were significant predictors of microbial metabolic efficiency along the different riparian zones of the TGR and were significantly influenced by microbial α-diversity. The bacterial taxa Desulfobacterota, Nitrospirota and the fungal taxa Calcarisporiellomycota, Rozellomycota showed a significant positive correlation with qCO2. The shifts in key microbial taxa unclassified_k_Fungi in the fungi module #3 are highlighted as essential factors regulating the microbial metabolic efficiency. Structural equation modeling results also revealed that soil enzyme activities had a highly significant negative effect on microbial metabolism efficiency (bacteria, path coefficient = -0.63; fungi, path coefficient = -0.67).This work has an important impact on the prediction of carbon cycling in aquatic-terrestrial ecotones. Graphical abstract.

Keywords: microbial community; microbial metabolic efficiency; riparian soils; soil enzyme activities; soil physical and chemical properties.


Conflict of interest statement

The authors declare that the research was conducted in the absence of any commercial or financial relationships that could be construed as a potential conflict of interest.

Figures

Graphical abstract
Graphical abstract
Figure 1
Figure 1
Location of sampling sites in the riparian zone of Three Gorges Reservoir, China.
Figure 2
Figure 2
Soil carbon metabolism indicators along the different riparian zones (upstream, midstream and downstream) of TGR. CUE, carbon use efficiency; MBC, microbial biomass carbon; qCO2, metabolic quotient; τ, microbial biomass turnover time. *p < 0.05, **p < 0.01, ***p < 0.001.
Figure 3
Figure 3
The alpha diversity and microbial communities in riparian zones of the TGR. (A) Distribution of alpha diversity (bacteria and fungi) in the riparian zone (upstream, midstream, and downstream). (B) Relative abundance of bacterial communities at the phylum level (upstream, midstream, and downstream); B_Chao, Chao index of bacterial community; F_Chao, Chao index of fungal community. (C) Relative abundance of fungal communities at the phylum level (upstream, midstream, and downstream). *p < 0.05, **p < 0.01, ***p < 0.001.
Figure 4
Figure 4
Division of main bacterial and fungal modules and correlation analysis with each index. (A) Diagram of network module division, where modules are divided by different colors, the left is bacterial community and the right is fungal community; (B) Spearman analysis between network modules and factors (physical–chemical properties, alpha diversity, and enzyme activities). (C) Linear fit of dominant species (including bacterial and fungal phylum levels) to microbial metabolism efficiency. *p < 0.05, **p < 0.01, ***p < 0.001.
Figure 5
Figure 5
Relationships of the keystone genera with metabolic efficiency, microbial physiological traits and soil enzyme activities. F_Mod#3, key fungal assemblies in module#3; B_Mod#4, B_Mod#5, and B_Mod#8 were key bacterial assemblies in module#4, module#5, and module#8. Length, the relative C: nutrient-acquiring traits.
Figure 6
Figure 6
Major predictors of microbial metabolic efficiency. (A) Based on the percentage increase in mean squared error (%IncMSE) from the random forest analysis. (B) Spearman correlation analysis of microbial carbon metabolism indicators with selected biotic and abiotic factors. Enzyme/MBC is calculated by normalizing the activity to units/mg MBC and represents the specific enzyme activity. *p < 0.05, **p < 0.01, ***p < 0.001.
Figure 7
Figure 7
Effects of soil physicochemical properties, microbial alpha diversity, and soil enzyme activities on microbial metabolic efficiency directly and indirectly. The structural equation models (SEM) was constructed for bacteria and fungi respectively: (A) microbial alpha diversity_Bacteria; (B) microbial alpha diversity_Fungi. Blue solid and gray dotted arrows, respectively, represent positive and negative relationships. The wider the width of the arrow indicates the stronger the correlation. Numbers on arrows are standardized path coefficients. R2 indicates the proportion of variance explained by predictors. *p < 0.05, **p < 0.01, ***p < 0.001. The soil physical and chemical properties, microbial alpha diversity, and microbial metabolism efficiency were represented by the first component of the PCA performed in a multilayer rectangle.

References

    1. Adingo S., Yu J. R., Xuelu L., Li X., Jing S., Xiaong Z. (2021). Variation of soil microbial carbon use efficiency (CUE) and its influence mechanism in the context of global environmental change: a review. PeerJ 9:e12131. doi: 10.7717/peerj.12131, PMID: - DOI - PMC - PubMed
    1. Allison S. D., Weintraub M. N., Gartner T. B., Waldrop M. P. (2010). “Evolutionary-economic principles as regulators of soil enzyme production and ecosystem function” in Soil Enzymology. eds. Shukla G., Varma A. (Berlin, Heidelberg: Springer; )
    1. Breiman L. (2004). Random forests. Mach. Learn. 45, 5–32. doi: 10.1023/A:1010933404324 - DOI
    1. Brosofske K. D., Chen J., Naiman R. J., Franklin J. F. (1997). Harvesting effects on microclimatic gradients from small streams to uplands in western Washington. Ecol. Appl. 7, 1188–1200. doi: 10.1890/1051-0761(1997)007[1188:HEOMGF]2.0.CO;2 - DOI
    1. Callahan B. J., McMurdie P. J., Holmes S. P. (2017). Exact sequence variants should replace operational taxonomic units in marker-gene data analysis. ISME J. 11, 2639–2643. doi: 10.1038/ismej.2017.119, PMID: - DOI - PMC - PubMed

LinkOut - more resources