. 2023 Apr 26:17:1161930.
doi: 10.3389/fncel.2023.1161930. eCollection 2023.

Bile acid interactions with neurotransmitter transporters

Affiliations

Bile acid interactions with neurotransmitter transporters

Tiziana Romanazzi et al. Front Cell Neurosci. .

Abstract

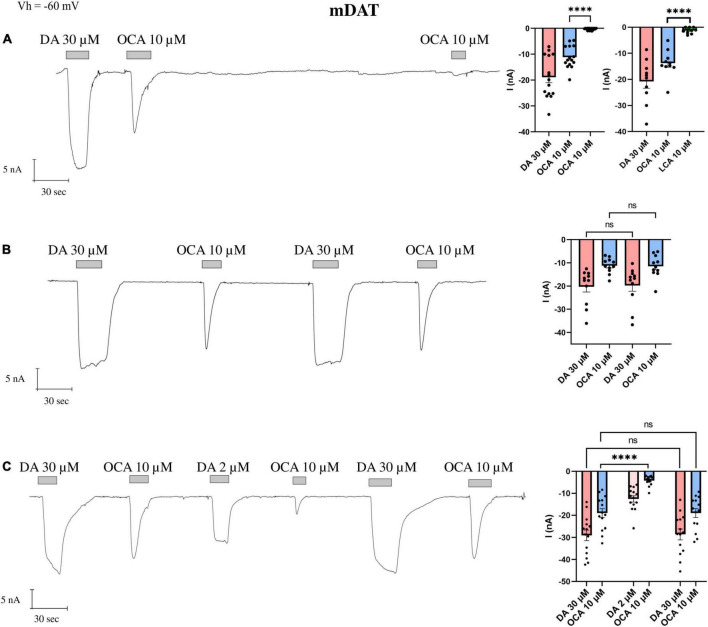
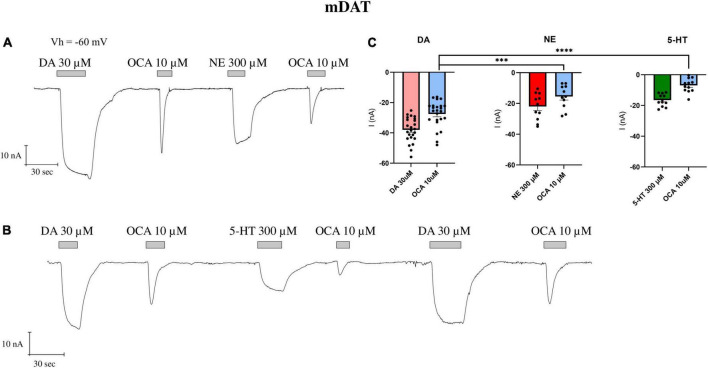
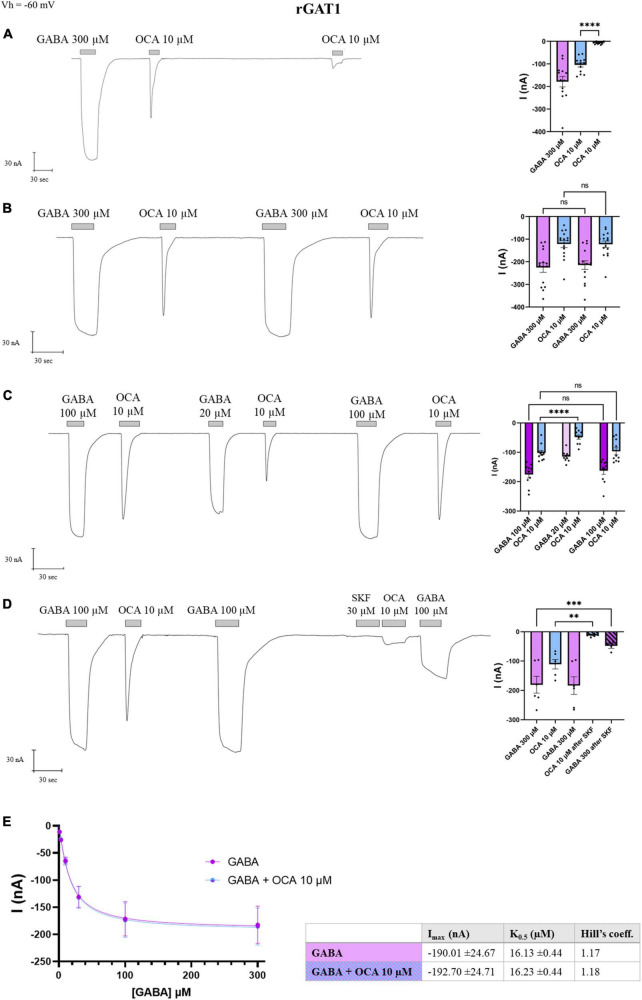
Synthesized in the liver from cholesterol, the bile acids (BAs) primary role is emulsifying fats to facilitate their absorption. BAs can cross the blood-brain barrier (BBB) and be synthesized in the brain. Recent evidence suggests a role for BAs in the gut-brain signaling by modulating the activity of various neuronal receptors and transporters, including the dopamine transporter (DAT). In this study, we investigated the effects of BAs and their relationship with substrates in three transporters of the solute carrier 6 family. The exposure to obeticholic acid (OCA), a semi-synthetic BA, elicits an inward current (IBA) in the DAT, the GABA transporter 1 (GAT1), and the glycine transporter 1 (GlyT1b); this current is proportional to the current generated by the substrate, respective to the transporter. Interestingly, a second consecutive OCA application to the transporter fails to elicit a response. The full displacement of BAs from the transporter occurs only after exposure to a saturating concentration of a substrate. In DAT, perfusion of secondary substrates norepinephrine (NE) and serotonin (5-HT) results in a second OCA current, decreased in amplitude and proportional to their affinity. Moreover, co-application of 5-HT or NE with OCA in DAT, and GABA with OCA in GAT1, did not alter the apparent affinity or the Imax, similar to what was previously reported in DAT in the presence of DA and OCA. The findings support the previous molecular model that suggested the ability of BAs to lock the transporter in an occluded conformation. The physiological significance is that it could possibly avoid the accumulation of small depolarizations in the cells expressing the neurotransmitter transporter. This achieves better transport efficiency in the presence of a saturating concentration of the neurotransmitter and enhances the action of the neurotransmitter on their receptors when they are present at reduced concentrations due to decreased availability of transporters.

Keywords: GABA transporter 1; SLC6; bile acids; dopamine transporter; glycine transporter; obeticholic acid (OCA); two-electrode voltage clamp.


Conflict of interest statement

The authors declare that the research was conducted in the absence of any commercial or financial relationships that could be construed as a potential conflict of interest.

Figures

FIGURE 1
FIGURE 1
The displacement of OCA from mDAT by DA. Representative traces of currents recorded by TEVC from oocytes expressing mDAT exposed to OCA (left) and mean of the indicated currents (right). (A) Currents after the first and second exposure to OCA, with an interval of 5′ wash with ND98 alone; mean current (nA) ± SE, from n = 15 oocytes, n = 4 batches; I0OCA vs. I’OCA on the same oocyte: one-way ANOVA F(2,42) = 18.15, ****p < 0.0001 followed by Bonferroni’s multiple comparison test; I0OCA vs. I’LCA same oocyte: ****p < 0.0001. (B) Currents after the first and second exposure to OCA with washing ND98 and ND98 plus DA 30 μM after the first OCA exposure; mean current (nA) ± SE of 11/3 n/N; repeated measure one-way ANOVA F(1.220, 12.20) = 20.71, p = 0.0001 between columns and F(10, 30) = 9.253, ****p < 0.0001 between rows, followed by Bonferroni’s multiple comparison test. IDA vs. I’DA: p = 0.8737 and I0OCA vs. I’OCA: p > 0.9999. (C) Currents after the first and second exposure to OCA with washing ND98 and ND98 plus DA 2 μM after the first OCA exposure; mean current (nA) ± SE of 13/2 n/N; repeated measure one-way ANOVA F(2.838, 36.89) = 62.26, ****p < 0.0001 between columns and F(13, 65) = 10.44, ****p < 0.0001 between rows followed by Bonferroni’s multiple comparison test. IDA vs. I’DA: p > 0.9999; I0OCA vs. I”OCA: p > 0.9999; I0OCA vs. I‘OCA after DA 2 μM: ****p < 0.0001.
FIGURE 2
FIGURE 2
Kinetics parameter of mDAT for NE and 5-HT. (A) Representative traces of currents recorded from oocytes expressing mDAT perfused with increasing concentrations of NE, from 1 μM to 1 mM (top) and 5-HT (bottom). (B) Data from 14/3 n/N were fitted to Hill’s equation and the data reported in table (C). *Parameter for the DA reported in Romanazzi et al. (2021). (D) Data from 11/2 n/N cells perfused with increasing concentrations of NE from 3 μM to 1 mM with or without OCA, 10 μM, were fitted to Hill’s equation and the data reported in table (left) and (right) data from 9/2 n/N cells perfused with increasing concentrations of 5-HT from 3 μM to 1 mM with or without OCA 10 μM were fitted to Hill’s equation and the data reported in the table (NE: Imax: p = 0.9435; K0.5: p = 0.8341; 5-HT: Imax: p = 0.7259; K0.5: p = 0.8730).
FIGURE 3
FIGURE 3
The partial displacement of OCA by NE and 5-HT. (A) Representative traces of currents recorded by TEVC (Vh = –60 mV) from oocytes expressing mDAT exposed to NE 300 μM after the first OCA exposure. (B) Representative traces of currents recorded by exposure to 5-HT 300 μM after the first OCA perfusion. (C) Mean current (nA) ± SE of 11–12/3 n/N; one-way ANOVA F(5,88) = 35.51, ****p < 0.0001 followed by Bonferroni’s multiple comparison test; I0OCA vs. I’OCA after NE: ***p = 0.001; I0OCA vs. I’OCA after 5-HT: ****p < 0.0001.
FIGURE 4
FIGURE 4
Obeticholic acid (OCA) effect on neurotransmitter transporters GAT1 (SLC6A1) and GlyT1b (SLC6A9). (A) Representative traces recorded by TEVC from oocytes expressing rGAT1 exposed to GABA and OCA (left) or GABA and LCA (right); mean of currents (center) (nA) ± SE of 33/6 n/N. (B) Representative traces recorded by TEVC from oocytes expressing rGlyT1b exposed to glycine and OCA (left) or glycine and LCA (right); mean of currents (center) (nA) ± SE of 17/4 n/N. (C) mean of normalized OCA current for rGlyT1b, mDAT, and rGAT1; (nA) ± SE of 16–34/6 n/N; one-way ANOVA F(2, 79) = 0.4982, p = 0.6094 followed by Bonferroni’s multiple comparison test. IOCA/IDA vs. IOCA/IGABA: p > 0.9999; IOCA/IDA vs. IOCA/IGly: p > 0.9999; IOCA/IGly vs. IOCA/IGABA: p > 0.9999.
FIGURE 5
FIGURE 5
Obeticholic acid (OCA) relationship with rGAT1. Representative traces of currents recorded by TEVC from oocytes expressing rGAT1 exposed to OCA (left) and mean of the indicated currents (right). (A) Currents after the first and second exposure to OCA with an interval of 5′ wash with ND98 alone; mean current (nA) ± SE of 13/3 n/N; one-way ANOVA F(2,36) = 35.68, ****p < 0.0001 followed by Bonferroni’s multiple comparison test: I0OCA vs. I’OCA: ****p < 0.0001. (B) Currents after the first and second exposure to OCA with washing ND98 and ND98 plus GABA 300 μM after the first OCA exposure; mean current (nA) ± SE of 15/3 n/N; repeated measure one-way ANOVA F(1.246, 17.44) = 45.80, ****p < 0.0001 between columns and F(14, 42) = 14.93, ****p < 0.0001 between rows followed by Bonferroni’s multiple comparison test. IGABA vs. I’GABA: p = 0.1599 and I0OCA vs. I’OCA: p > 0.9999. (C) Currents after the first and second exposure to OCA with washing ND98 and ND98 plus GABA 20 μM after the first OCA exposure; mean current (nA) ± SE of 10/2 n/N; repeated measure one-way ANOVA F(1.765, 15.89) = 38.97, ****p < 0.0001 between columns and F(9, 45) = 10.44, ****p < 0.0001 between rows followed by Bonferroni’s multiple comparison test. IGABA 100 μM vs. I’GABA 100 μM: p > 0.4177; I0OCA vs. I’OCA after GABA 100 μM: p > 0.9999; I0OCA vs. I’OCA after GABA 20 μM: ****p < 0.0001. (D) Current after SKF 30 μM perfusion, followed by the second OCA; mean current nA ± SE of 6/2 n/N; one-way ANOVA F(3,18) = 17.02, ****p < 0.0001 followed by Bonferroni’s multiple comparison test: I0OCA vs. I’OCA after SKF: p = 0.0019; IGABA vs. I’GABA after SFK: p = 0.0003. (E) Data from 8/1 n/N cells perfused with increasing concentrations of GABA from 3 to 300 μM with or without OCA 10 μM were fitted to Hill’s equation and the data reported in the table (Imax: p = 0.9523; K0.5: p = 0.8170). **p < 0.01, ***p < 0.001.
FIGURE 6
FIGURE 6
Hypothetical mechanism of action of BAs on the transport cycle of NSS. In presence of BAs, the BA molecule binds the transporters (Oo), opens a transient conductance (Oo-Occ), and then freezes the protein in an occluded conformation (Occ) that makes it resistant to other BAs-mediated alteration of membrane potential. The occluded state can be recovered only in the presence of the physiological substrates that allow the transporter to switch from Oo to Io. The binding of the physiological transport induces the unbinding of OCA from the protein.

References

    1. Bhatt M., Di Iacovo A., Romanazzi T., Roseti C., Cinquetti R., Bossi E. (2022). The “www” of Xenopus laevis oocytes: the why, when, what of Xenopus laevis oocytes in membrane transporters research. Membranes 12:927. 10.3390/membranes12100927 - DOI - PMC - PubMed
    1. Bhatt M., Gauthier-Manuel L., Lazzarin E., Zerlotti R., Ziegler C., Bazzone A., et al. (2023). A comparative review on the well-studied GAT1 and the understudied BGT-1 in the brain. Front. Physiol. 14:1145973. 10.3389/FPHYS.2023.1145973 - DOI - PMC - PubMed
    1. Castagna M., Cinquetti R., Verri T., Vacca F., Giovanola M., Barca A., et al. (2022). The Lepidopteran KAAT1 and CAATCH1: orthologs to understand structure–function relationships in mammalian SLC6 transporters. Neurochem. Res. 47 111–126. 10.1007/s11064-021-03410-1 - DOI - PMC - PubMed
    1. Cherubino F., Bertram S., Bossi E., Peres A. (2012). Pre-steady-state and reverse transport currents in the GABA transporter GAT1. Am. J. Physiol. Cell Physiol. 302 1096–1108. 10.1152/ajpcell.00268.2011 - DOI - PubMed
    1. Fesce R., Giovannardi S., Binda F., Bossi E., Peres A. (2002). The relation between charge movement and transport-associated currents in the rat GABA contransporter rGAT1. J. Physiol. 545 739–750. 10.1113/jphysiol.2002.026823 - DOI - PMC - PubMed

LinkOut - more resources