

Cognitive performance in multiple sclerosis: what is the role of the gamma-aminobutyric acid system?
- PMID: 37180993
- PMCID: PMC10174207
- DOI: 10.1093/braincomms/fcad140
Cognitive performance in multiple sclerosis: what is the role of the gamma-aminobutyric acid system?
Abstract
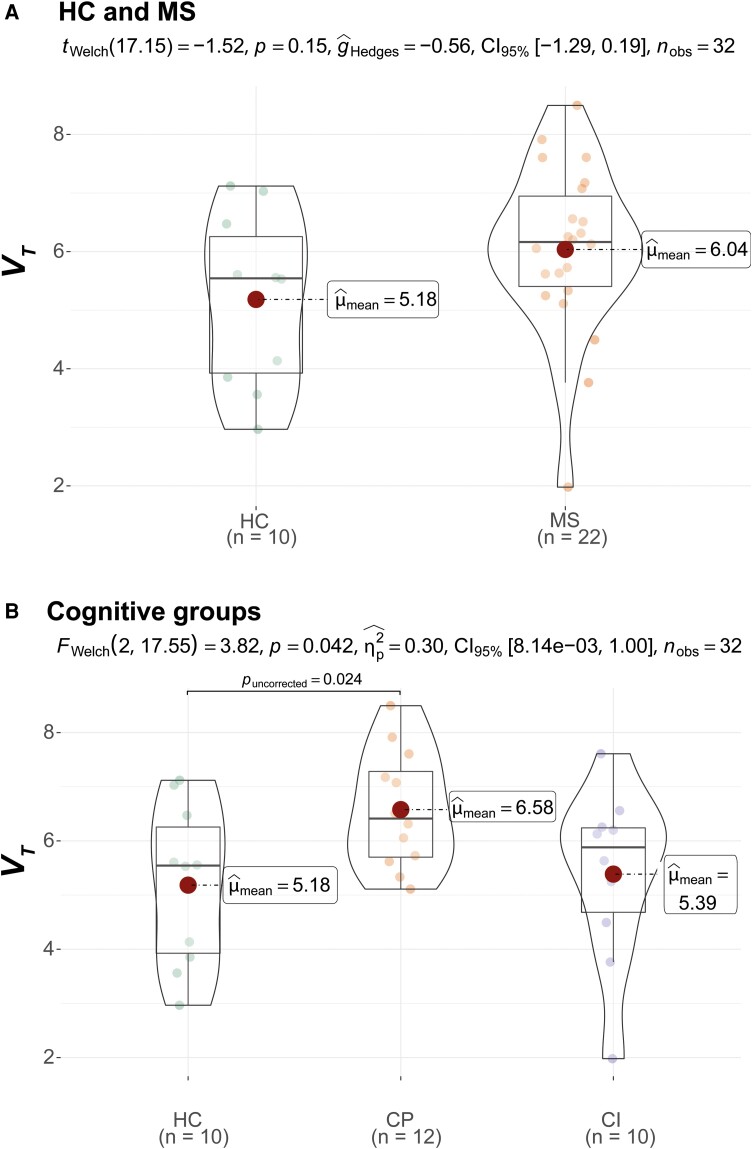
Cognitive impairment occurs in 40-65% of persons with multiple sclerosis and may be related to alterations in glutamatergic and GABAergic neurotransmission. Therefore, the aim of this study was to determine how glutamatergic and GABAergic changes relate to cognitive functioning in multiple sclerosis in vivo. Sixty persons with multiple sclerosis (mean age 45.5 ± 9.6 years, 48 females, 51 relapsing-remitting multiple sclerosis) and 22 age-matched healthy controls (45.6 ± 22.0 years, 17 females) underwent neuropsychological testing and MRI. Persons with multiple sclerosis were classified as cognitively impaired when scoring at least 1.5 standard deviations below normative scores on ≥30% of tests. Glutamate and GABA concentrations were determined in the right hippocampus and bilateral thalamus using magnetic resonance spectroscopy. GABA-receptor density was assessed using quantitative [11C]flumazenil positron emission tomography in a subset of participants. Positron emission tomography outcome measures were the influx rate constant (a measure predominantly reflecting perfusion) and volume of distribution, which is a measure of GABA-receptor density. Twenty persons with multiple sclerosis (33%) fulfilled the criteria for cognitive impairment. No differences were observed in glutamate or GABA concentrations between persons with multiple sclerosis and healthy controls, or between cognitively preserved, impaired and healthy control groups. Twenty-two persons with multiple sclerosis (12 cognitively preserved and 10 impaired) and 10 healthy controls successfully underwent [11C]flumazenil positron emission tomography. Persons with multiple sclerosis showed a lower influx rate constant in the thalamus, indicating lower perfusion. For the volume of distribution, persons with multiple sclerosis showed higher values than controls in deep grey matter, reflecting increased GABA-receptor density. When comparing cognitively impaired and preserved patients to controls, the preserved group showed a significantly higher volume of distribution in cortical and deep grey matter and hippocampus. Positive correlations were observed between both positron emission tomography measures and information processing speed in the multiple sclerosis group only. Whereas concentrations of glutamate and GABA did not differ between multiple sclerosis and control nor between cognitively impaired, preserved and control groups, increased GABA-receptor density was observed in preserved persons with multiple sclerosis that was not seen in cognitively impaired patients. In addition, GABA-receptor density correlated to cognition, in particular with information processing speed. This could indicate that GABA-receptor density is upregulated in the cognitively preserved phase of multiple sclerosis as a means to regulate neurotransmission and potentially preserve cognitive functioning.
Keywords: GABA-receptor; cognition; magnetic resonance spectroscopy; multiple sclerosis; positron emission tomography.
© The Author(s) 2023. Published by Oxford University Press on behalf of the Guarantors of Brain.
Conflict of interest statement
M. Huiskamp receives research support from the Dutch MS Research Foundation. Prof. Dr. Killestein reports speaker and consulting fees and grants from Biogen, Celgene, Genzyme, Immunic, Merck, Novartis, Roche, Sanofi and Teva. Prof. Dr. van Berckel has received research support from EU-FP7, CTMM, ZonMw, NWO and Alzheimer Nederland. BvB has performed contract research for Rodin, IONIS, AVID, Eli Lilly, UCB, DIAN-TUI and Janssen. BvB was a speaker at a symposium organized by Springer Healthcare. BvB has a consultancy agreement with IXICO for the reading of PET scans. BvB is a trainer for GE. BvB only receives financial compensation from Amsterdam UMC. Prof. Dr. Geurts has served as a consultant for Merck-Serono, Biogen, Novartis, Genzyme and Teva Pharmaceuticals; he has received research support from the Dutch MS Research Foundation, Ammodo, Eurostars-EUREKA, Biogen, Celgene/BMS, Merck, MedDay and Novartis. Prof. Dr. Hulst receives research support from Dutch MS Research Foundation, ZonMW, NWO, ATARA, Biogen, Celgene/BMS, Merck and Medday, serves as a consultant for Sanofi Genzyme, Merck BV, Biogen Idec, Roche and Novartis and is on the editorial board of Multiple Sclerosis Journal. Other authors report no conflicts of interest.
Figures


References
-
- DeLuca J, Chiaravalloti ND, Sandroff BM. Treatment and management of cognitive dysfunction in patients with multiple sclerosis. Nat Rev Neurol. 2020;16(6):319–332. - PubMed
-
- Rocca MA, Amato MP, De Stefano N, et al. . Clinical and imaging assessment of cognitive dysfunction in multiple sclerosis. Lancet Neurol. 2015;14(3):302–317. - PubMed
-
- Filippi M, van den Heuvel MP, Fornito A, et al. . Assessment of system dysfunction in the brain through MRI-based connectomics. Lancet Neurol. 2013;12(12):1189–1199. - PubMed
-
- Rocca MA, Barkhof F, De Luca J, et al. . The hippocampus in multiple sclerosis. Lancet Neurol. 2018;17(10):918–926. - PubMed
LinkOut - more resources
Full Text Sources