. 2023 Apr 19;2(5):pgad141.
doi: 10.1093/pnasnexus/pgad141. eCollection 2023 May.

Plant-on-chip: Core morphogenesis processes in the tiny plant Wolffia australiana

Affiliations

Plant-on-chip: Core morphogenesis processes in the tiny plant Wolffia australiana

Feng Li et al. PNAS Nexus. .

Abstract

A plant can be thought of as a colony comprising numerous growth buds, each developing to its own rhythm. Such lack of synchrony impedes efforts to describe core principles of plant morphogenesis, dissect the underlying mechanisms, and identify regulators. Here, we use the minimalist known angiosperm to overcome this challenge and provide a model system for plant morphogenesis. We present a detailed morphological description of the monocot Wolffia australiana, as well as high-quality genome information. Further, we developed the plant-on-chip culture system and demonstrate the application of advanced technologies such as single-nucleus RNA-sequencing, protein structure prediction, and gene editing. We provide proof-of-concept examples that illustrate how W. australiana can decipher the core regulatory mechanisms of plant morphogenesis.

Keywords: Wolffia australiana; high-quality genome; morphogenesis; plant-on-chip.


Figures

Fig. 1.
Fig. 1.
Morphological description of W. australiana. A) Top view of a W. australiana plantlet, as seen under a dissecting microscope; a branch is protruding to the right. B) Side view of a W. australiana plantlet, showing a boat-shaped leaf with dark green cells at the “deck” and light green cells at the “hull.” C) Top view of a W. australiana plantlet by cryo-SEM; note the presence of stomata. D) Side view of a W. australiana plantlet by cryo-SEM; no stomata were observed. E) View from the hole from which branches abscise out, showing the remaining petiole (arrowhead). A scar (arrow) forms on the boat-shaped leaf and indicates prior branch abscission. F) Top view of a W. australiana plantlet under a dissecting microscope, showing the stigma and stamen (arrowheads) protruding from the crack on the “deck.” G) Top view of the crack region of a W. australiana plantlet, as seen by cryo-SEM, showing a stigma (right, arrowhead) and a stamen (left, arrowhead). H) After peeling the deck, three young leaves (the biggest one has developed into a branch) are aligned sequentially, as indicated by three arrowheads. I) CT image showing the alignment of leaves (arrowheads) and how the biggest leaf has developed into a branch before abscission (the rectangle shows new leaves produced from the biggest leaf). J) TEM section of the leaf primordia and the region including the growth tip (rectangle with arrowhead). K) Zoomed-in region indicated by the solid rectangle shown in J). The circle highlights the cells with big nuclei and dense cytoplasm, possible including the growth tip cell(s). L) Zoomed-in region indicated by the dashed rectangle in J) with adjusted orientation. The dotted line indicates the border of the fast-growing region of the primordium leaf that overlaps with the slow-growing region. The circle indicates the junction where a growth tip of the primordium leaf might initiate de novo, which allows a primordium leaf to become a new branch. M) TEM section of the growth region of the branch (prepared with the CT sample, corresponding to the corresponding rectangle in Fig. 1I. N) CT image showing a region of the growth tip of a plantlet under flower induction conditions. The rectangle highlights the growth region for further observation. O) TEM section of the growth region (prepared with the CT sample, corresponding to the corresponding rectangle in Fig. 1N. Two bumps (arrowheads) arise from the innermost region of the cavity. P) Further enlargement of the region highlighted in Fig. 1O. Arrowheads indicate cells in the bumps that are morphologically different from those shown in Fig. 1K. Q) CT image showing a gynoecium (right) and a stamen (left) inside the plantlet, possibly derived from the two bumps observed in Fig. 1P. Bars = 100 μm (A–G, I, N, Q) and 10 μm (H, J–P).
Fig. 2.
Fig. 2.
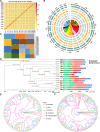
Genomic features of the W. australiana genome and gene family evolution in W. australiana. A) Hi-C interaction matrix for the 20 W. australiana pseudochromosomes. B) Circos plot of the W. australiana genomic features: (a) distribution of 20 chromosomes (each bar represents one chromosome, and the number represents the chromosome length); (b) gene density; (c) repeat sequence density; (d) GC contents; (e) gene density of control transcriptome; (f) gene density of flowered transcriptome; (g) gene density of induced transcriptome; and (h) synteny and distribution of genomic regions across the W. australiana genome. C) Treemap for contig length difference of 20 chromosomes. D) Phylogenetic analysis of W. australiana and other plants. The single-cell green alga Chlamydomonas reinhardtii was used as outgroup. The value on each node represents the divergence time in millions of years (mya). Nodes marked red are published fossil calibration time points. Numbers marked in green/red represent expansion/contraction numbers on each branch. Photos on the right show the corresponding species. E) AGL flowering-related genes. F) Root-related SAUR genes.
Fig. 3.
Fig. 3.
PoC culture platform. A) Representative millifluidic chip (detailed information in the Materials and methods section), showing a loaded plantlet. B) Abscised plantlets (former branch) line up along the channel. C) A peristaltic pump is connected to the chip to circulate liquid half-strength MS medium. D) Diagram of growth pattern; the branch ranks are indicated by different colors. E) Growth curve of cultured plantlets in the PoC in half-strength MS medium under short-day conditions at 26°C (n = 3).
Fig. 4.
Fig. 4.
W. australiana lacks vasculature. A) Staining of W. australiana and S. polyrhiza plantlets with the cell wall dye Direct Red 23, revealing no SCW vascular structure in W. australiana, in contrast to the spiral-like xylem cells (inset) observed in the closely related duckweed S. polyrhiza. Bars = 80 μm (left) and 20 μm (right). B) Cell wall composition of W. australiana plantlets. All components are shown with the scale to the left, except cellulose (right scale). Bar charts represent the mean ± standard deviation (SD) of five biological replicates. C) Phylogenetic analysis of SCW–related NAC homologs in W. australiana and five representative genomes, indicating the absence of the VND homolog (boxed) in W. australiana. AT, A. thaliana; ATR, A. trichopoda; Os, O. sativa; Pp, P. patens; SMO, S. moellendorffii. D) Confocal images of N. benthamiana leaf epidermal cells transiently overexpressing WausLG14.977 or infiltrated with empty vector. Vessel-like cells were observed with WausLG14.977. Arrows indicate spiral SCW bands in a vessel-like cell. Bars = 20 μm.
Fig. 5.
Fig. 5.
W. australiana floral induction and related transcriptome/TRNs. A) Diagram of the sampling design: F (flowered) samples were collected 5 days after culture under inductive conditions (left) from plantlets with a crack on the deck (shown as F with arrow). I (induced) samples were collected 5 days after culture under inductive conditions (left) from plantlets with no crack on the deck (shown as I with arrow). C (control) samples were collected 5 days after culture under noninductive conditions (right, control) from plantlets (shown as C with arrow) remaining in a vegetative state. B) Heat map representation of 147 differentially expressed genes that are up-regulated in flowered compared with induced (fold change ≥2 or ≤−2, P ≤ 0.05). C) Heat map representation of 78 differentially expressed genes that are down-regulated in flowered compared with induced (fold change ≥2 or ≤−2, P ≤ 0.05). D) TRN topological structure based on the comparison of the RNA-seq data sets from I and C samples. E) TRN topological structure based on the comparison of the RNA-seq data sets from F and C samples. Red edges for positive regulation, blue edges for negative regulation, green nodes for differentially present genes, and circled region for differentially present network in D) and E). Pink circles highlight the nodes exhibiting topological differences between the two TRNs.
Fig. 6.
Fig. 6.
snRNA-seq reveals cell types absent in W. australiana plantlets. A) Heat map representation of differentially expressed genes across 15,983 cells clustered into 16 cell types. B) UMAP visualization of 15,983 cells into 16 clusters (for detailed information, see Table S16).

References

    1. Waddington CH. 1966. Principles of development and differentiation. New York: The Macmillan Company.
    1. Wang R, et al. . 2009. PEP1 regulates perennial flowering in Arabis alpina. Nature 459:423–427. - PubMed
    1. Landolt E. 1957. Physiologische und okologische untersuchungen an lemnaceen. Ber Schweiz Bot Ges. 67:271–410.
    1. Hillman WS. 1961. The Lemnaceae, or duckweeds: a review of the descriptive and experimental literature. Bot Rev. 27:221–287.
    1. Landolt E, Kandeler R. 1986. The family Lemnaceae—monographic study. Zürich: Geobotanische Institut ETH, Stiftung Rübel.