. 2023 Apr 27:3:1067113.
doi: 10.3389/fbinf.2023.1067113. eCollection 2023.

Barcode demultiplexing of nanopore sequencing raw signals by unsupervised machine learning

Affiliations

Barcode demultiplexing of nanopore sequencing raw signals by unsupervised machine learning

Daniele M Papetti et al. Front Bioinform. .

Abstract

Introduction: Oxford Nanopore Technologies (ONT) is a third generation sequencing approach that allows the analysis of individual, full-length nucleic acids. ONT records the alterations of an ionic current flowing across a nano-scaled pore while a DNA or RNA strand is threading through the pore. Basecalling methods are then leveraged to translate the recorded signal back to the nucleic acid sequence. However, basecall generally introduces errors that hinder the process of barcode demultiplexing, a pivotal task in single-cell RNA sequencing that allows for separating the sequenced transcripts on the basis of their cell of origin. Methods: To solve this issue, we present a novel framework, called UNPLEX, designed to tackle the barcode demultiplexing problem by operating directly on the recorded signals. UNPLEX combines two unsupervised machine learning methods: autoencoders and self-organizing maps (SOM). The autoencoders extract compact, latent representations of the recorded signals that are then clustered by the SOM. Results and Discussion: Our results, obtained on two datasets composed of in silico generated ONT-like signals, show that UNPLEX represents a promising starting point for the development of effective tools to cluster the signals corresponding to the same cell.

Keywords: RNA barcoding; artificial intelligence; autoencoder; complexity reduction; nanopore; scRNA-seq; self-organising map; unsupervised learning.


Conflict of interest statement

TL received reimbursement of expenses from ONT to speak at an event. The authors declare that the research was conducted in the absence of any commercial or financial relationships that could be construed as a potential conflict of interest.

Figures

FIGURE 1
FIGURE 1
Typical workflow to couple short-read with long-read scRNA-seq using the 10x Chromium platform. (A) Overview of library preparation, sequencing, and downstream analysis. Single cells are captured into Gel Beads-in-emulsion (GEMs) through a microfluidic chip. Inside the GEMs, poly-adenylated mRNA transcripts undergo tagging with a cellular barcode (BC) and unique molecular identifier (UMI), followed by reverse transcription for full-length cDNA production. After the GEMs are broken, cDNA can be split between short-read (SR) and long-read (LR) sequencing. During downstream analysis, shared BCs are used to link SR and LR data, enabling the integration of multiomics information. (B) Structure of read templates. The SR template (left) consists of poly-adenylated fragmented transcripts attached to an Illumina adapter, BC, and UMI of fixed length, in a fixed sequence. The LR template (right) is essentially the same as the SR template but for the addition of the LR sequencing adapter and length of the transcript.
FIGURE 2
FIGURE 2
Demultiplexing of BC signals in ONT sequencing can be carried out using basecalled (top) or raw (bottom) signals.
FIGURE 3
FIGURE 3
Workflow used for in silico generation of ONT-like signals.
FIGURE 4
FIGURE 4
Workflow of the UNPLEX. The dataset containing ONT-like signals (D seq ) is pre-processed to achieve a dataset of signals of the same length (D tsig ), which are fed to the autoencoder to obtain their latent representations (D emb ). The data included in dataset D emb are processed by the SOM, whose outcome is finally clustered, resulting in the classification of ONT-like signals according to their BCs.
FIGURE 5
FIGURE 5
(Left) First half of an in silico generated signal in D sig . (Middle) Pre-processed signal in D tsig given as input to the autoencoder. (Right) Corresponding signal representation generated as output by the autoencoder.
FIGURE 6
FIGURE 6
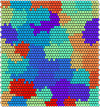
Graphical representation of the 50 clusters identified by the SOM on dataset D 1. Each hexagon represents a neuron colored according to the cluster it belongs to, that is, the BC it represents.
FIGURE 7
FIGURE 7
(Left) Gold standard clustering where each bar corresponds to all the signals pertaining the same BC in dataset D 1. (Right) Clustering outcome where the signals are colored according to the result achieved with UNPLEX, non-uniform coloring in a bar indicates the presence of misclustered signals.
FIGURE 8
FIGURE 8
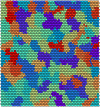
Graphical representation of the 100 clusters identified by the SOM on dataset D 2. Each hexagon represents a neuron colored according to the cluster it belongs to, that is, the BC it represents.
FIGURE 9
FIGURE 9
(Left) Gold standard clustering where each bar corresponds to all the signals pertaining the same BC in dataset D 2. (Right) Clustering outcome where the signals are colored according to the result achieved with UNPLEX, non-uniform coloring in a bar indicates the presence of misclustered signals.

References

    1. Alibrahim H., Ludwig S. A. (2021). “Hyperparameter optimization: Comparing genetic algorithm against grid search and bayesian optimization,” in 2021 IEEE Congress on Evolutionary Computation (CEC) (IEEE; ), 1551–1559.
    1. Bourlard H., Kamp Y. (1988). Auto-association by multilayer perceptrons and singular value decomposition. Biol. Cybern. 59, 291–294. 10.1007/bf00332918 - DOI - PubMed
    1. Breiman L. (2001). Random forests. Mach. Learn. 45, 5–32. 10.1023/a:1010933404324 - DOI
    1. Ebrahimi G., Orabi B., Robinson M., Chauve C., Flannigan R., Hach F. (2022). scTagger: fast and accurate matching of cellular barcodes across short-and long-reads of single-cell RNA-seq experiments. bioRxiv. - PMC - PubMed
    1. Fowlkes E. B., Mallows C. L. (1983). A method for comparing two hierarchical clusterings. J. Am. Stat. Assoc. 78, 553–569. 10.1080/01621459.1983.10478008 - DOI

LinkOut - more resources