

Role of Routine Blood Parameters in Predicting Mortality Among Surgical Patients With Sepsis
- PMID: 37182007
- PMCID: PMC10172793
- DOI: 10.7759/cureus.37413
Role of Routine Blood Parameters in Predicting Mortality Among Surgical Patients With Sepsis
Abstract
Background: Outcome prediction for surgical patients with sepsis may be conducive to early aggressive interventions. In several studies, changes in the level of numerous biomarkers like red cell distribution width (RDW), platelet count (PC), mean platelet volume (MPV), and platelet distribution width (PDW) have been demonstrated to be associated with mortality in critically ill patients. We aimed at investigating the prognostic significance of dynamic changes in RDW, PC, MPV, and PDW in surgical patients with sepsis.
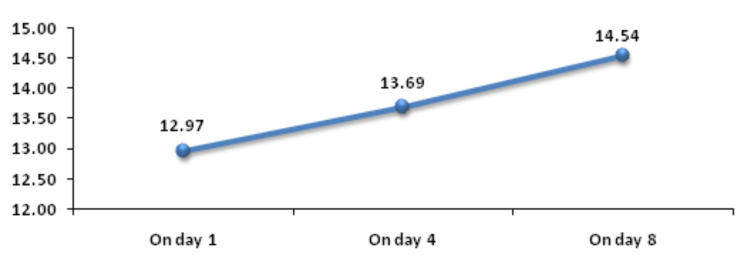
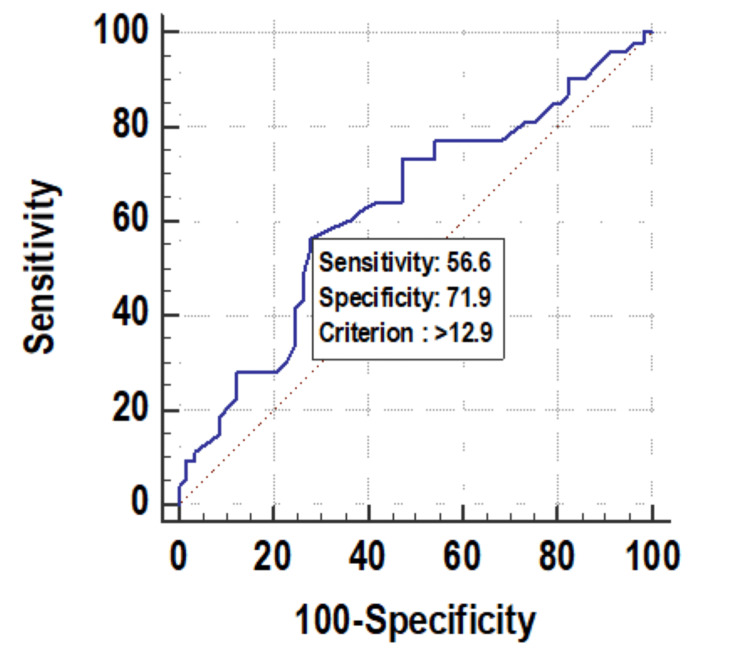
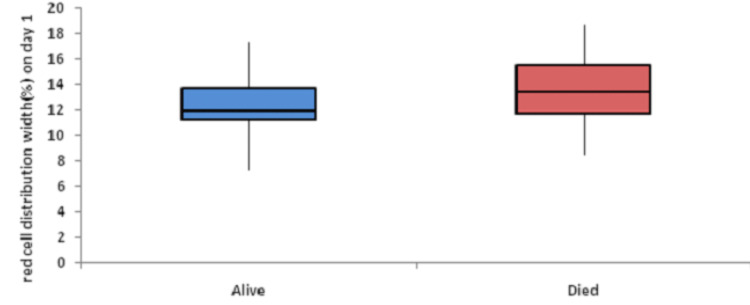
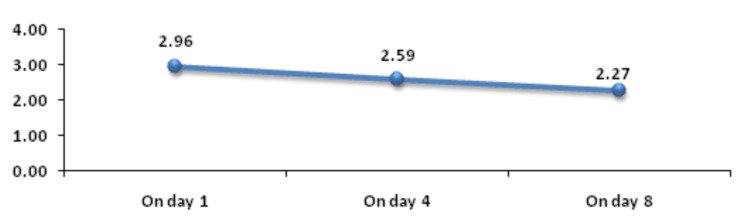
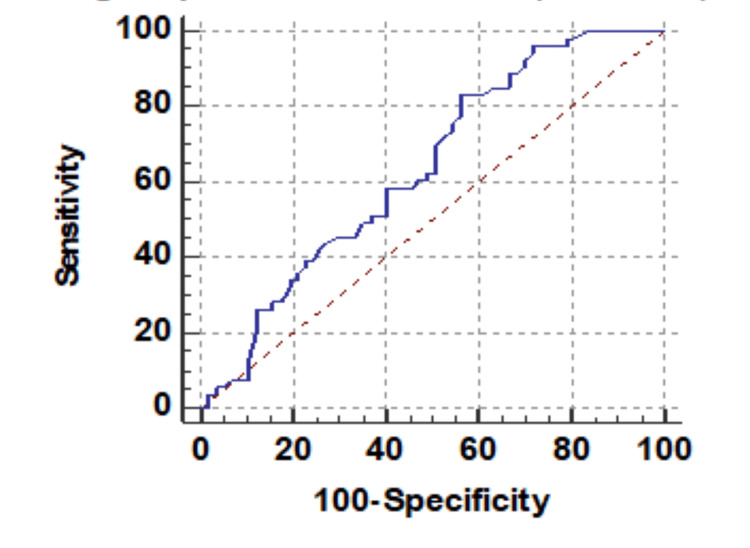
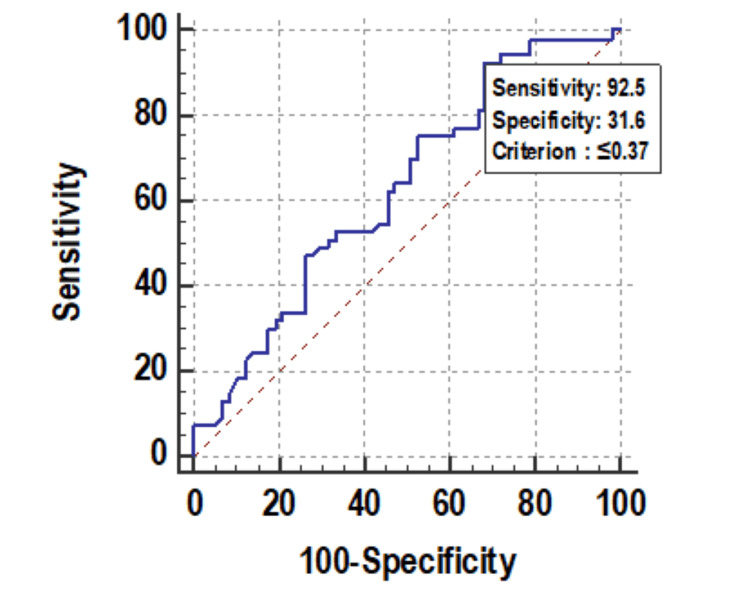
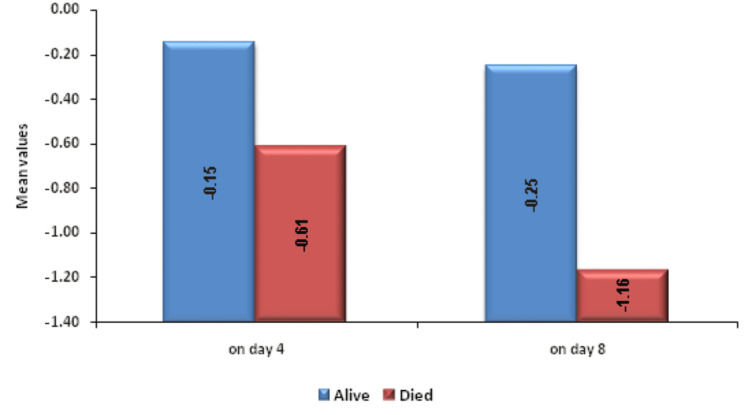
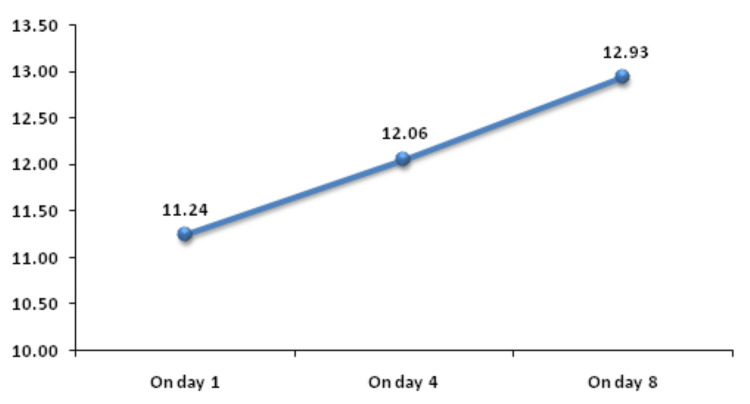
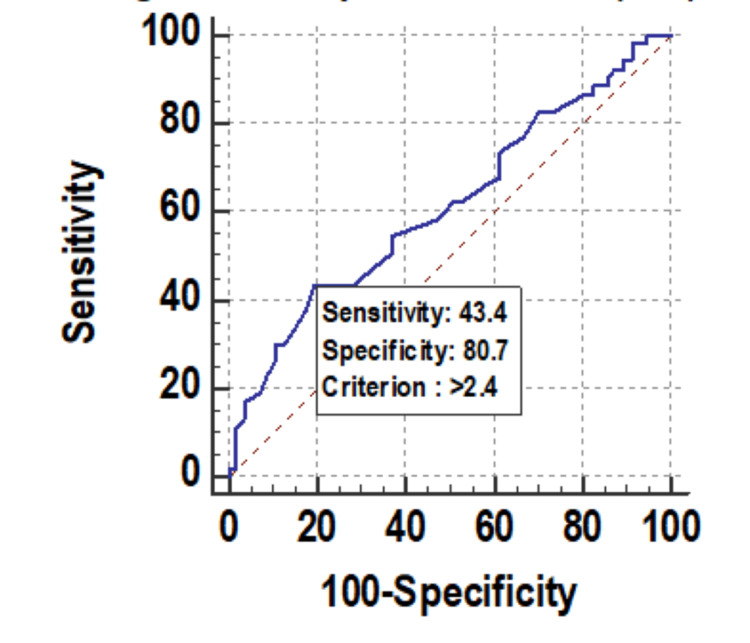
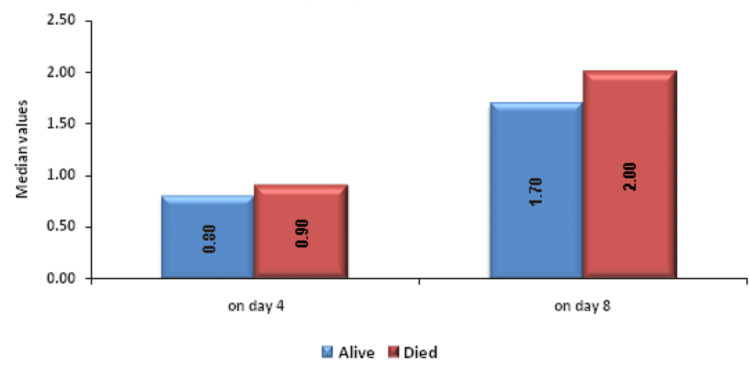
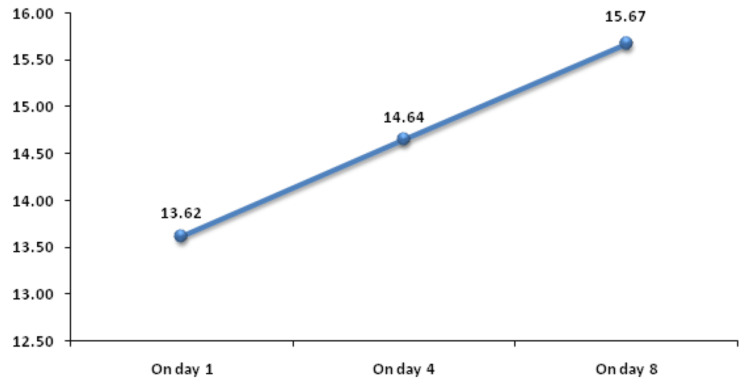
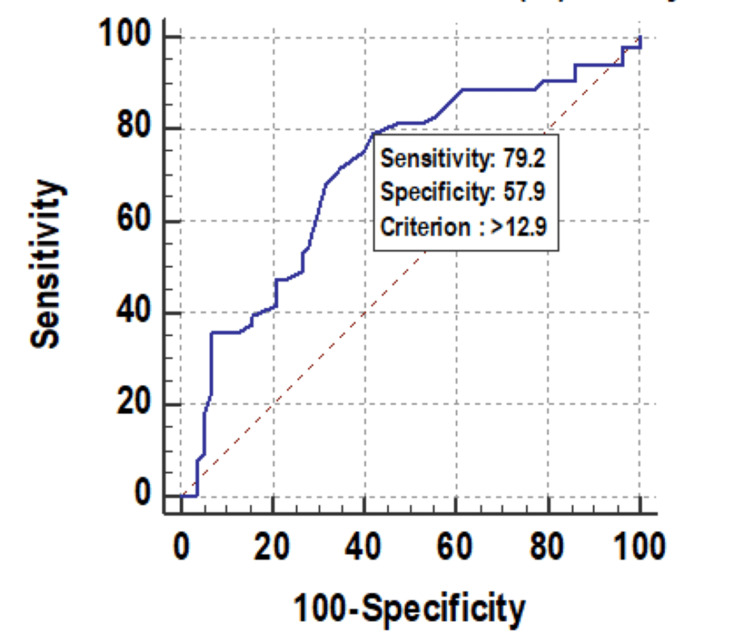
Methods: We prospectively enrolled 110 surgical patients of sepsis in our study admitted to the surgical ward and ICU. We measured RDW, PC, MPV, and PDW on days 1, day 4, and day 8. Receiver operating characteristics (ROC) were generated for prognostic validation of these parameters and mortality in surgical patients with sepsis. Results: We found that higher RDW and PDW on day 1 among non-survivors as compared to survivors on day 1 were significantly associated with mortality. ROC curves showed that RDW and PDW on day 1 could be used to predict mortality in surgical patients with sepsis and it was dynamic changes in PC on day 4 and day 8 along with a change in MPV on day 8, which was significantly associated with mortality.
Conclusion: The major findings of our study were baseline value of RDW and PDW on day 1 and continuous decrease in PC and increase in MPV over one week were significantly associated with mortality. So, it is better to monitor dynamic changes in PC and MPV in combination with baseline RDW and PDW. So, these parameters can be promising markers to assess prognosis in surgical patients with sepsis.
Keywords: mean platelet volume (mpv); mortality; platelet count (plt); platelet distribution width; red cell distribution width (rdw); sepsis.
Copyright © 2023, Dixit et al.
Conflict of interest statement
The authors have declared that no competing interests exist.
Figures
References
-
- Red cell distribution width as a novel predictor of mortality in ICU patients. Wang F, Pan W, Pan S, Ge J, Wang S, Chen M. Ann Med. 2011;43:40–46. - PubMed
-
- Red cell distribution width as a prognostic marker in patients with community-acquired pneumonia. Lee JH, Chung HJ, Kim K, Jo YH, Rhee JE, Kim YJ, Kang KW. Am J Emerg Med. 2013;31:72–79. - PubMed
-
- Thrombocytopenia and prognosis in intensive care. Vanderschueren S, De Weerdt A, Malbrain M, Vankersschaever D, Frans E, Wilmer A, Bobbaers H. Crit Care Med. 2000;28:1871–1876. - PubMed
-
- Mean platelet volume trend in sepsis: is it a useful parameter? Becchi C, Al Malyan M, Fabbri LP, Marsili M, Boddi V, Boncinelli S. https://www.minervamedica.it/en/journals/minerva-anestesiologica/article.... Minerva Anestesiol. 2006;72:749–756. - PubMed
-
- Platelet indices are novel predictors of hospital mortality in intensive care unit patients. Zhang Z, Xu X, Ni H, Deng H. J Crit Care. 2014;29:885–886. - PubMed
LinkOut - more resources
Full Text Sources