. 2023 Apr 13;26(5):106665.
doi: 10.1016/j.isci.2023.106665. eCollection 2023 May 19.

Reliable and robust control of nucleus centering is contingent on nonequilibrium force patterns

Affiliations

Reliable and robust control of nucleus centering is contingent on nonequilibrium force patterns

Ishutesh Jain et al. iScience. .

Abstract

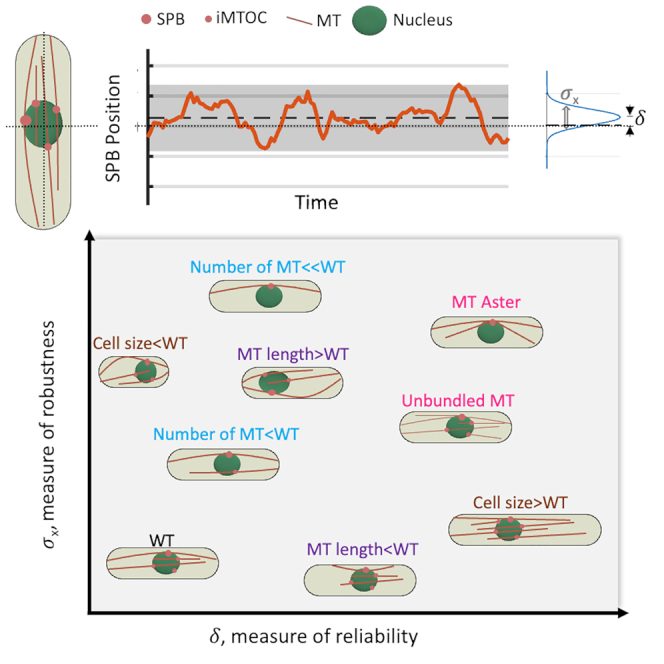
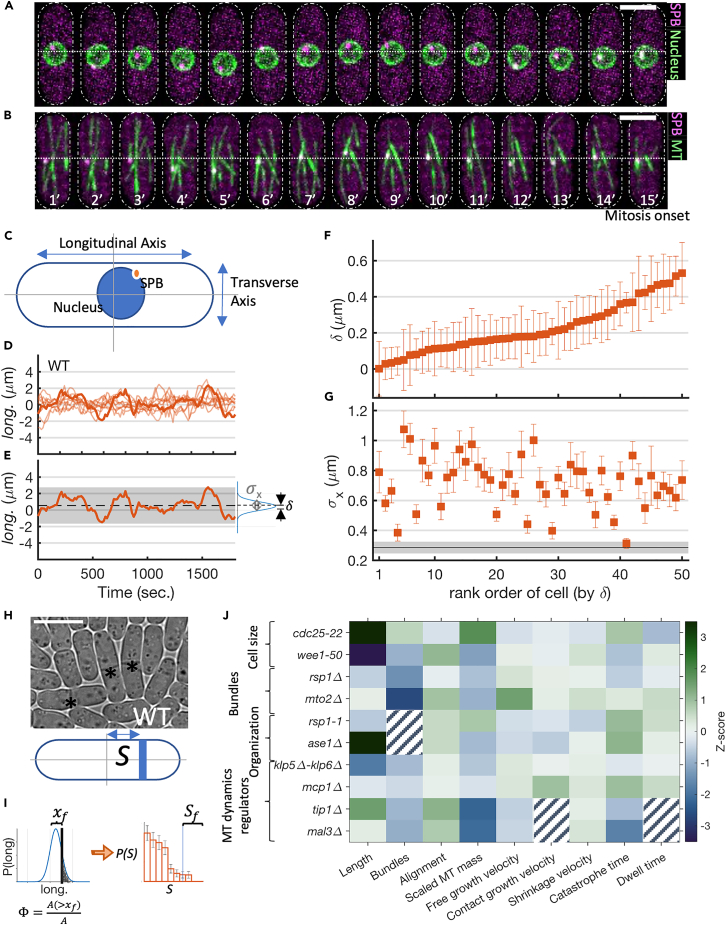
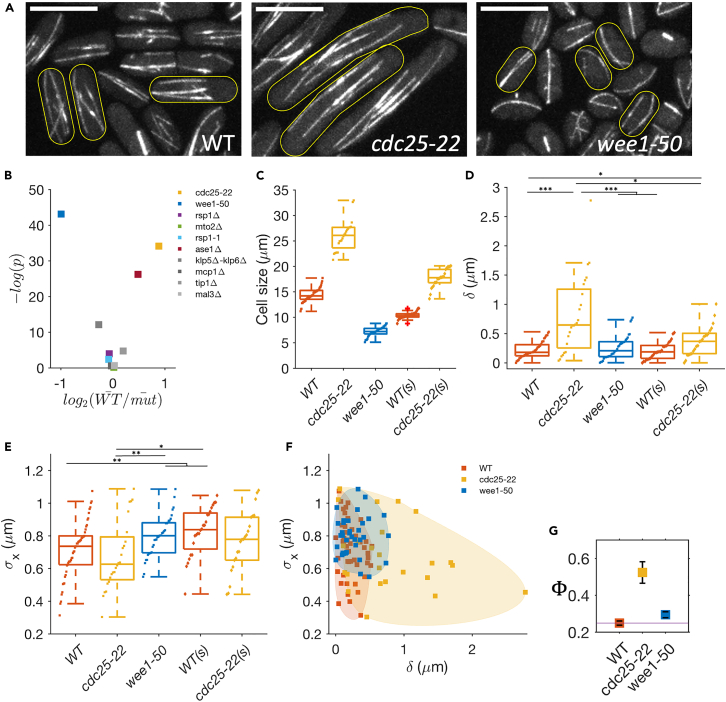
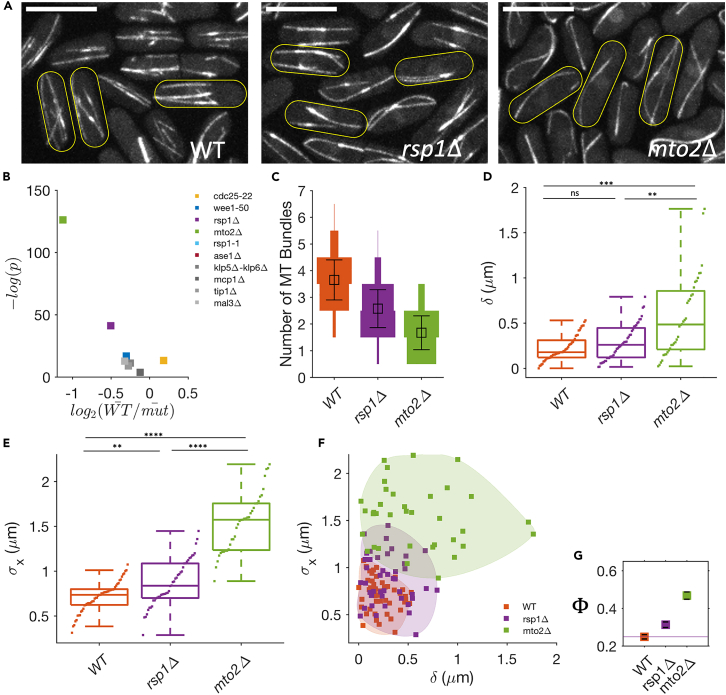
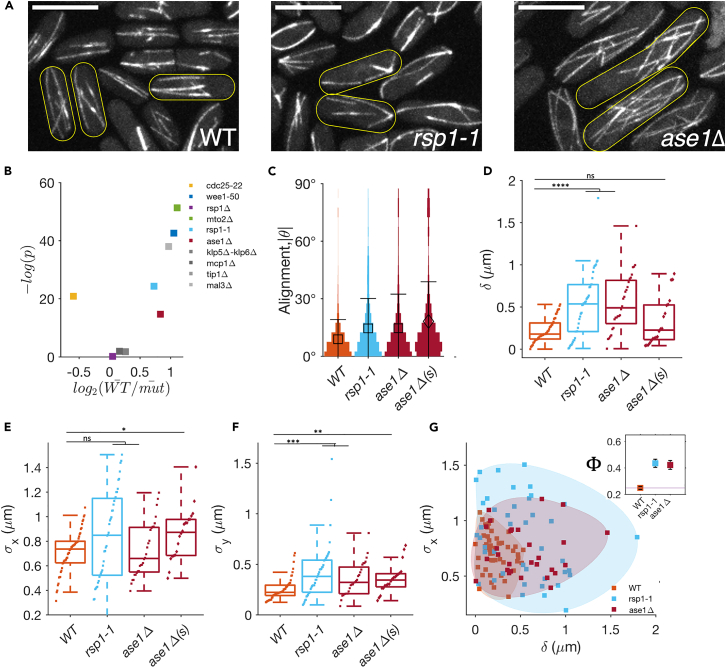
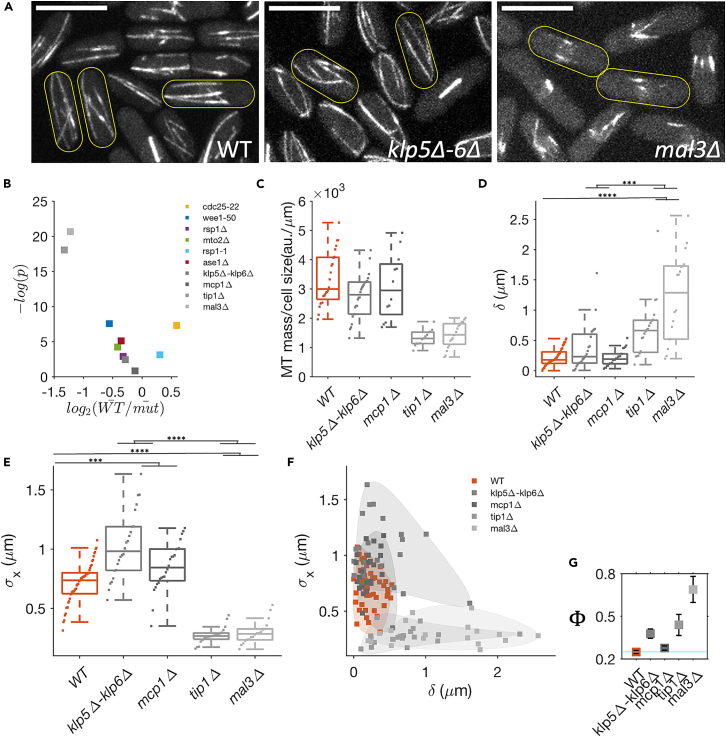
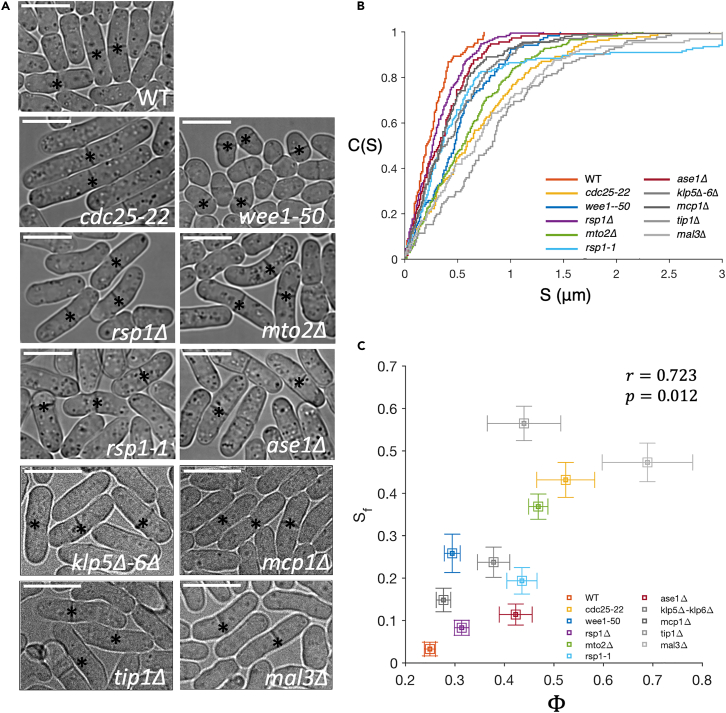
Cell centers their division apparatus to ensure symmetric cell division, a challenging task when the governing dynamics is stochastic. Using fission yeast, we show that the patterning of nonequilibrium polymerization forces of microtubule (MT) bundles controls the precise localization of spindle pole body (SPB), and hence the division septum, at the onset of mitosis. We define two cellular objectives, reliability, the mean SPB position relative to the geometric center, and robustness, the variance of the SPB position, which are sensitive to genetic perturbations that change cell length, MT bundle number/orientation, and MT dynamics. We show that simultaneous control of reliability and robustness is required to minimize septum positioning error achieved by the wild type (WT). A stochastic model for the MT-based nucleus centering, with parameters measured directly or estimated using Bayesian inference, recapitulates the maximum fidelity of WT. Using this, we perform a sensitivity analysis of the parameters that control nuclear centering.

Keywords: Biological sciences; Microbiology; Molecular biology; Molecular microbiology.


Conflict of interest statement

The authors declare no competing interests.

Figures

None
Graphical abstract
Figure 1
Figure 1
Dynamics of the nucleus and SPB in WT cells (A and B) Time-lapse images of nucleus centering before the mitosis onset. (A) Representative example of the nuclear envelope (Cut11-GFP) and SPB (Sid4-mCherry) fluctuation in WT cell. (B) EnvyGFP-Atb2 Sid4-mCherry tagged strain (WT) showing the dynamics of SPB and MTs. Time-interval 1 min, scale-bar 10 μm. (C) For each cell, we define an internal coordinate system with the origin at the cell centroid and the longitudinal axis aligned with the x axis. By convention, the cells are oriented so that the time-average of longitudinal and transverse displacement of SPB w.r.t. the geometric center of the cell falls in the first quadrant. (D) Example trajectories of longitudinal displacement of SPB. (E) From such trajectories, we estimated the mean longitudinal displacement of SPB from the cell center (δ) and standard deviation in SPB position (σx) for each cell. (F and G) Distribution of δ and σx in WT cells sorted by δ. The error bars show standard error, estimated using the moving-block bootstrap method with a block size equal to the autocorrelation time., The black line (shaded area) in (g) is the mean σx (±SE) in the MT destabilizing drug (MBC)-treated cells. (H) (Top) Examples of septum position in WT cells. (Bottom) The septum position S is the distance of the septum from the cell center. (I) To quantify the functional role of δ and σx we define a distance xf from the cell center beyond which the septum localization is considered a failure. The fraction of cells (Sf) whose septum localizes beyond xf depends on δ and σx. We calculate the failure-coefficient of SPB localization (Φ), by approximating the distribution of SPB as a Gaussian characterized by δ and σx, as a readout to likely septum-mislocalization. Φ=A(>xf)/A, where A(>xf)=xfp(l)dl and A=p(l)dl. (J) We use systematic perturbations in cell length, the number of MT bundles, MT organization, and MT growth dynamics regulator to understand the role of force patterning in determining SPB positioning. The heatmap shows the difference between various functional attributes between the WT and the mutant quantified using the Z score = =jmutjWTσjWT, where jmut and jWT represent the mean values for jth feature of mutant and wild type, respectively, and σjWT is the standard deviation observed in the WT strain in the jth feature (hatched blocks denote cases where the features are ill defined).
Figure 2
Figure 2
SPB dynamics is sensitive to deviations of cell length from WT (A) MT organization in WT, cdc25-22 (long), and wee1-50 (small) cells. Scale bar 10 μm. (B) Scatterplot of statistical significance (p-value) versus magnitude of change (fold change) in cell length w.r.t WT cells in studied strains. cdc25-22 and wee1-50 show the most variation in the cell length. (C) Cell length distribution at the onset of mitosis (for WT and wee1-50) and in the long cdc25-22 cells (also Figure S6). (D) The mean longitudinal displacement of SPB from the cell center (δ) for each cell was obtained from SPB dynamics data (see Figure S2). δ increases in the long cells irrespective of the function of Cdc25. (E) Standard deviation in SPB position (σx) for each cell. σx increases in short cells. (F) Scatterplot of δ and σx for WT, cdc25-22, wee1-50 cells. A large fraction of cdc25-22 have δ larger than both WT and wee1-50 and for a given value of δ small wee1-50 have higher σx than the WT or cdc25-22. (G) For each strain, we calculate the mean Φ as a function of δ and σx as a measure of nucleus mislocalization. (error bars are SE). [∗∗∗ for p ≤ 10−4, ∗∗ for p ≤ 0.005, ∗ for p < 0.05, Wilcoxon rank-sum test. N = 20–50 cells.].
Figure 3
Figure 3
Fidelity of nucleus centering is affected by the number of MT bundles (A) MT organization in WT, rsp1Δ, and mto2Δ cells. Scale bar = 10 μm. (B) Scatterplot of statistical significance (p-value) versus magnitude of change (fold change) in the number of MT bundles w.r.t WT cells in studied strains. (C) Distribution of the number of MT bundles with a mean equal to 3.7 (WT), 2.5 (rsp1Δ), and 1.6 (mto2Δ) (error bars are SD) (also Figure S6). (D) Mean longitudinal displacement of SPB from the cell center (δ) for each cell obtained from SPB dynamics data (see Figure S3). (E) Standard deviation in SPB position (σx) for each cell. σx increases with a decrease in the number of MT bundles. (F) Scatterplot of δ and σx for WT, rsp1Δ, and mto2Δ cells. For a given δ,σx follows the trend WT<rsp1Δ<mto2Δ. (G) The mean Φ as a function of δ and σx as a measure of nucleus mislocalization. (error bars are SE). [∗∗∗∗ for p ≤ 10−5, ∗∗∗ for p ≤ 10−4, ∗∗ for p ≤ 0.005, ∗ for p < 0.05, ns is not significant. Wilcoxon rank-sum test. N = 20–50 cells.].
Figure 4
Figure 4
Orientation patterning of MTs affects the fidelity of nucleus centering (A) MT organization in WT, rsp1-1, and ase1Δ cells. In rsp1-1 cells, MTs are arranged in an aster-like fashion, whereas in ase1Δ cells, MTs are unbundled and disorganized. Scale bar = 10 μm. (B) Scatterplot of statistical significance (p-value) versus magnitude of change (fold change) in the alignment of MT w.r.t WT cells in studied strains. Apart from rsp1-1 and ase1Δ, wee1-50, mto2Δ, and mal3Δ also have a large deviation in MT alignment. However, in wee1-50 and mto2Δ, this large deviation is partly a result of buckled MTs; in the mal3Δ cells, mean MT length is small. Moreover, rsp1-1 and ase1Δ have distinct unbundled MT organization. (C) Distribution of alignment of MTs quantified by the absolute local angle |θ| of MT filament relative to the longitudinal axis of the cell. Both rsp1-1 and ase1Δ cells show large angular deviation. The small ase1Δ cells show much larger angular deviation than the ase1Δ cells. (D) Mean longitudinal displacement of SPB from the cell center (δ) for each cell obtained from SPB dynamics data (see Figure S4). (E) Standard deviation in SPB position (σx) for each cell. (F) Transverse fluctuations of SPB (σy) in WT, rsp1-1, ase1Δ, and small ase1Δ cells. (G) Scatterplot of δ and σx for WT, rsp1-1, and ase1Δ cells. Both rsp1-1 and ase1Δ occupy a wider region in the objective space. Inset: The mean Φ as a function of δ and σx as a measure of nucleus mislocalization. (error bars are SE). [∗ ∗ ∗∗ for p ≤ 10−5, ∗ ∗ ∗ for p ≤ 10−4, ∗∗ for p ≤ 0.005, ∗ for p < 0.05, ns is not significant. Wilcoxon rank-sum test. N = 20–50 cells.].
Figure 5
Figure 5
Optimal centering of the nucleus requires favorable MT growth dynamics (A) MT organization in MT growth dynamics impaired mutants (also Figure S5). Scale bar 10 μm. (B) Scatterplot of statistical significance (p-value) versus magnitude of change (fold change) in the scaled MT mass w.r.t WT cells in studied strains. mal3Δ and tip1Δ (both are MT growth factors) have low MT mass. However, we also observed a reduction in MT mass in klp5Δ-klp6Δ. (C) MT mass, measured from the intensity of MT fluorescence, scaled with cell length (also Figure S6). (D) Mean longitudinal displacement of SPB from the cell center (δ) for each cell obtained from SPB dynamics data (see Figure S5). (E) Standard deviation in SPB position from the cell center (σx) for each cell. (F) Scatterplot of δ and σx. The mal3Δ and tip1Δ strains, with attenuated MT growth, have large δ in the majority of the cells. In klp5Δ-klp6Δ and mcp1Δ strains, many cells have much higher σx than the WT. (G) The mean Φ as a function of δ and σx as a measure of nucleus mislocalization. (error bars are SE). [∗∗∗∗ for p ≤ 10−5, ∗∗∗ for p ≤ 10−4, ∗∗ for p ≤ 0.005, ∗ for p < 0.05, ns is not significant. Wilcoxon rank-sum test. N = 20–50 cells.].
Figure 6
Figure 6
Proper positioning of the septum is contingent on nucleus centering (A) Panel shows examples of septum location in different strains. Scale bars 10 μm. Asterisks (∗) mark the septa. (B) Cumulative distributions of S for various stains (also Figure S6 for p values between these strains). (C) Fraction of cells with failed septum localization (Sf) correlates with mean failure-coefficient of SPB localization Φ for the different strains, indicating the relevance of the combined optimization of δ and σx. Error bars represent standard error. The error bar on Sf is estimated using 100 boot-strapped replicas (N = 120–200 cells).
Figure 7
Figure 7
Stochastic model recapitulates the optimality of WT (A) (Top-left panel) Cumulative distribution of τcat (magenta) obtained from Mal3 strain. A gamma distribution gives the best fit (black curve) for the distribution of τcat. (Other panels) Parameters obtained using the Bayesian analysis of the τcat obtained for various strain utilizing EnvyGFP-Atb2 Sid4-mCherry background. The red line shows the cumulative distribution from experiment. The black curve shows the full distribution inferred using Bayesian analysis. The dotted curve is truncated distribution obtained using the estimated parameters (black curve) with truncation at the minimum and maximum of experimentally observed τcat for respective strains. (B) Schematic depicting elements of the theoretical model for MT-driven nucleus centering. The MTs originate from MTOCs (blue dots) mounted on the periphery of a rigid nucleus. The direction of the MT growth is represented by red arrows. The pushing forces arising at the MT cell wall contacts are represented by black arrow (see main text and supplemental information for a detail description). (C) Example trajectories of SPB obtained from simulations. (D and E) Statistics of δ (D) and σx (E) obtained using the parameters listed in (C). The dotted lines are experimental values of means (wide-lines) and standard deviation (thin-lines) for respective statistics. Error bars are standard deviation. (F and G) Discrete contour-plots showing the systematic effect of variation in cell length and number of MTs on δ (F) and σx (G). Color-bar scale is in μm. The rest of the parameter-set are same as in (C). (H) A discrete contour-plot showing the effect of variation in cell length and number of MTs on failure-coefficient of SPB localization Φ. The dashed curves are iso-contours for two values of Φ. (I–L) Bivariate probability distribution of δ and σx. Scatterplots show cell-to-cell variations. The contour shows probability distribution estimated by fitting a 2D-Gaussian after convolving the data points with a symmetric Gaussian kernel. Color bar scale shows probability density. (I) Experimental data from WT strain showing cell-to-cell variation in σx are larger than δ suggesting that the control on δ is stiffer than on σx. (J) Simulations with parameters listed in (C) with the cell length following the experimentally observed cell length variation. (K) Simulations with perfect correlation between left (l) and right (r) MT force generators, in terms of their local orientations, and iMTOC localization on the nucleus. (L) Simulations with uncorrelated left-right MTs orientation.

Similar articles

Cited by

References

    1. Chan Y.H.M., Marshall W.F. How cells know the size of their organelles. Science. 2012;337:1186–1189. doi: 10.1126/science.1223539. - DOI - PMC - PubMed
    1. Marshall W.F., Young K.D., Swaffer M., Wood E., Nurse P., Kimura A., Frankel J., Wallingford J., Walbot V., Qu X., Roeder A.H.K. What determines cell size? BMC Biol. 2012;10:101. doi: 10.1186/17417007-10-101. - DOI - PMC - PubMed
    1. Bornens M. Organelle positioning and cell polarity. Nat. Rev. Mol. Cell Biol. 2008;9:874–886. doi: 10.1038/nrm2524. - DOI - PubMed
    1. Pécréaux J., Redemann S., Alayan Z., Mercat B., Pastezeur S., Garzon-Coral C., Hyman A.A., Howard J. The mitotic spindle in the one-cell C. elegans embryo is positioned with high precision and stability. Biophys. J. 2016;111:1773–1784. doi: 10.1016/j.bpj.2016.09.007. - DOI - PMC - PubMed
    1. Minc N., Burgess D., Chang F. Influence of cell geometry on division-plane positioning. Cell. 2011;144:414–426. doi: 10.1016/j.cell.2011.01.016. - DOI - PMC - PubMed

LinkOut - more resources