. 2023 Apr 27:13:1131191.
doi: 10.3389/fonc.2023.1131191. eCollection 2023.

Construction of an interferon regulatory factors-related risk model for predicting prognosis, immune microenvironment and immunotherapy in clear cell renal cell carcinoma

Affiliations

Construction of an interferon regulatory factors-related risk model for predicting prognosis, immune microenvironment and immunotherapy in clear cell renal cell carcinoma

Hao Pan et al. Front Oncol. .

Abstract

Background: Interferon regulatory factors (IRFs) played complex and essential roles in progression, prognosis, and immune microenvironment in clear cell renal cell carcinoma (ccRCC). The purpose of this study was to construct a novel IRFs-related risk model to predict prognosis, tumor microenvironment (TME) and immunotherapy response in ccRCC.

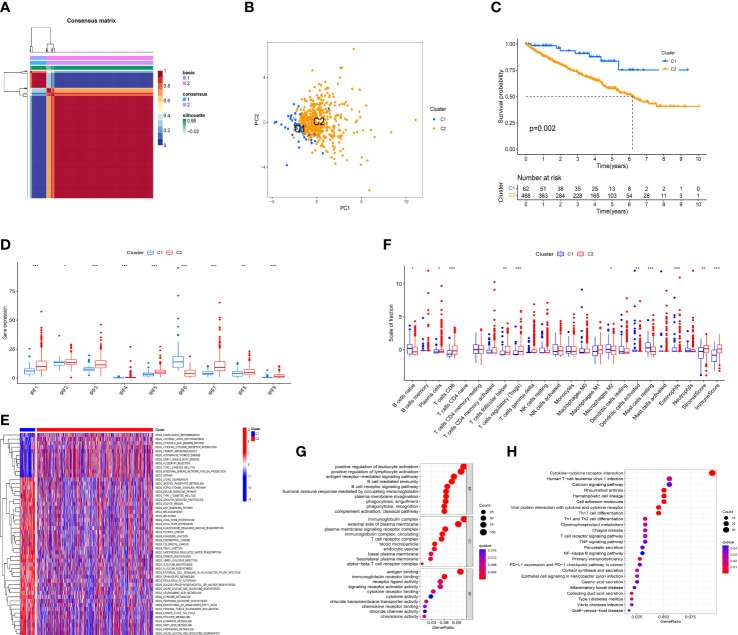
Methods: Multi-omics analysis of IRFs in ccRCC was performed based on bulk RNA sequencing and single cell RNA sequencing data. According to the expression profiles of IRFs, the ccRCC samples were clustered by non-negative matrix factorization (NMF) algorithm. Then, least absolute shrinkage and selection operator (LASSO) and Cox regression analyses were applied to construct a risk model to predict prognosis, immune cells infiltration, immunotherapy response and targeted drug sensitivity in ccRCC. Furthermore, a nomogram comprising the risk model and clinical characteristics was established.

Results: Two molecular subtypes with different prognosis, clinical characteristics and infiltration levels of immune cells were identified in ccRCC. The IRFs-related risk model was developed as an independent prognostic indicator in the TCGA-KIRC cohort and validated in the E-MTAB-1980 cohort. The overall survival of patients in the low-risk group was better than that in the high-risk group. The risk model was superior to clinical characteristics and the ClearCode34 model in predicting the prognosis. In addition, a nomogram was developed to improve the clinical utility of the risk model. Moreover, the high-risk group had higher infiltration levels of CD8+ T cell, macrophages, T follicular helper cells and T helper (Th1) cells and activity score of type I IFN response but lower infiltration levels of mast cells and activity score of type II IFN response. Cancer immunity cycle showed that the immune activity score of most steps was remarkably higher in the high-risk group. TIDE scores indicated that patients in the low-risk group were more likely responsive to immunotherapy. Patients in different risk groups showed diverse drug sensitivity to axitinib, sorafenib, gefitinib, erlotinib, dasatinib and rapamycin.

Conclusions: In brief, a robust and effective risk model was developed to predict prognosis, TME characteristics and responses to immunotherapy and targeted drugs in ccRCC, which might provide new insights into personalized and precise therapeutic strategies.

Keywords: clear cell renal cell carcinoma; drug sensitivity; immunotherapy; interferon regulatory factors; tumor microenvironment.


Conflict of interest statement

The authors declare that the research was conducted in the absence of any commercial or financial relationships that could be construed as a potential conflict of interest.

Figures

Figure 1
Figure 1
The expression levels of the IRF family members between ccRCC samples and normal samples. (A) The mRNA expression levels of the IRF family members in the TCGA-KIRC dataset. (B) The mRNA expression levels of the IRF family members in the GEO dataset. (C) The cell types were identified by single-cell RNA-sequencing analysis. (D) The expression levels of the IRF family members in different types of cell clusters.
Figure 2
Figure 2
Somatic mutation and CNVs frequencies of the IRF family members in ccRCC. (A) Mutation frequency of the IRF family members in 336 patients with ccRCC. (B) CNVs of the IRF family members. (C) Locations of the CNV alterations of the IRF family members on 23 chromosomes. (D) Correlations and prognosis of the IRF family members in ccRCC patients.
Figure 3
Figure 3
QRT-PCR and IHC analyses of the IRF family members. (A) The relative mRNA expression levels of the IRF family members between ccRCC and normal tissues were validated by qRT-PCR. (B) The AOD values of the IRF family members between ccRCC and normal tissues were compared. (C) Representative IHC staining of the IRF family members between ccRCC and normal tissues were shown. * p<0.05, ** p<0.01, *** p<0.001.
Figure 4
Figure 4
Identification of IRFs-related molecular subtypes. (A) Consensus map of NMF clustering (k = 2). (B) PCA plot of the expression profiling of IRFs. (C) KM analysis of OS between the two molecular subtypes. (D) The differences in the expression levels of IRF family members between the two molecular subtypes. (E) Heatmap of biological pathways between the two molecular subtypes. Activated and inhibited pathways are colored by red and blue, respectively. (F) The differences in immune score, stromal score and immune infiltrating cells between the two molecular subtypes. (G) GO enrichment analysis of DEGs between the two molecular subtypes. (H) KEGG pathway enrichment analysis of DEGs between the two molecular subtypes. * p<0.05, ** p<0.01, *** p<0.001.
Figure 5
Figure 5
Construction and validation of an IRFs-related prognostic model. (A) The LASSO Cox regression analysis was performed to filter out the candidate genes. (B) 9 genes were retained to construct a prognostic model using the multivariate Cox regression analysis. (C) The mRNA expression levels of the nine genes between ccRCC samples and normal samples in the TCGA-KIRC dataset. (D) Correlations between IRF family members and risk score. (E, F) KM curves of OS between the low- and high-risk groups in TCGA-KIRC and E-MTAB-1980 datasets. (G, H) ROC curves of the IRFs-related prognostic model in predicting the 1-, 3- and 5-year OS in the TCGA-KIRC and E-MTAB-1980 datasets. * p<0.05, ** p<0.01, *** p<0.001.
Figure 6
Figure 6
Correlation between risk score and clinical characteristics. (A, C) Univariate and multivariate Cox regression analyses showed that risk score was an independent prognostic indicator in the TCGA-KIRC dataset. (B, D) Univariate and multivariate Cox regression analyses showed that risk score was an independent prognostic indicator in the E-MTAB-1980 dataset. (E) Differences in clinical characteristics between the low- and high-risk groups in the TCGA-KIRC dataset. (F) Distribution of tumor stages between the low- and high-risk groups. * p<0.05, *** p<0.001.
Figure 7
Figure 7
Assessment of the IRFs-related prognostic model and construction of a nomogram to predict the OS. (A-C) ROC curves of the nomogram in predicting the 1-,3- and 5-year OS in the TCGA-KIRC dataset. (D) C-indexes of the risk score and clinical characteristics. (E) ROC curves of the ClearCode34 model in predicting the 1-, 3- and 5-year OS. (F) The calibration curve of the nomogram in predicting the 1-, 3- and 5-year OS. (G) Construction of a nomogram based on age, gender, stage and risk score. (H) DCA curve of the nomogram. * p<0.05, *** p<0.001
Figure 8
Figure 8
Immune landscape between the low- and high-risk groups. (A) Differences in the stromal score, immune score and ESTIMATE score. (B) Differences in the 16 immune cells and 13 immune-related pathways between the low- and high-risk groups. (C) Correlation between TMB and risk score. (D) Differences in the immune activity score of cancer-immunity cycle steps between the low- and high-risk groups. * p<0.05, ** p<0.01, *** p<0.001.
Figure 9
Figure 9
Evaluation the value of the IRFs-related prognostic model in immunotherapy and drug sensitivity. (A-D) Differences in TIDE, MSI, T cell dysfunction and T cell exclusion between the low- and high-risk groups. (E) ROC curve of IRFs-related prognostic model, TIDE and TIS in predicting the OS. (F) Correlation between risk score and drug sensitivity. *** p<0.001. ns, no significance.

References

    1. Ljungberg B, Bensalah K, Canfield S, Dabestani S, Hofmann F, Hora M, et al. . EAU guidelines on renal cell carcinoma: 2014 update. Eur Urol (2015) 67:913–24. doi: 10.1016/j.eururo.2015.01.005 - DOI - PubMed
    1. Motzer RJ, Hutson TE, Cella D, Reeves J, Hawkins R, Guo J, et al. . Pazopanib versus sunitinib in metastatic renal-cell carcinoma. New Engl J Med (2013) 369:722–31. doi: 10.1056/NEJMoa1303989 - DOI - PubMed
    1. Rini BI, Campbell SC, Escudier B. Renal cell carcinoma. Lancet (London England) (2009) 373:1119–32. doi: 10.1016/S0140-6736(09)60229-4 - DOI - PubMed
    1. Gill DM, Agarwal N, Vaishampayan U. Evolving treatment paradigm in metastatic renal cell carcinoma. American society of clinical oncology educational book. American society of clinical oncology. Annu Meeting (2017) 37:319–29. doi: 10.1200/EDBK_174469 - DOI - PMC - PubMed
    1. Motzer RJ, Penkov K, Haanen J, Rini B, Albiges L, Campbell MT, et al. . Avelumab plus axitinib versus sunitinib for advanced renal-cell carcinoma. New Engl J Med (2019) 380:1103–15. doi: 10.1056/NEJMoa1816047 - DOI - PMC - PubMed