. 2023 Jun:61:101253.
doi: 10.1016/j.dcn.2023.101253. Epub 2023 May 10.

Early childhood household instability, adolescent structural neural network architecture, and young adulthood depression: A 21-year longitudinal study

Affiliations

Early childhood household instability, adolescent structural neural network architecture, and young adulthood depression: A 21-year longitudinal study

Felicia A Hardi et al. Dev Cogn Neurosci. 2023 Jun.

Abstract

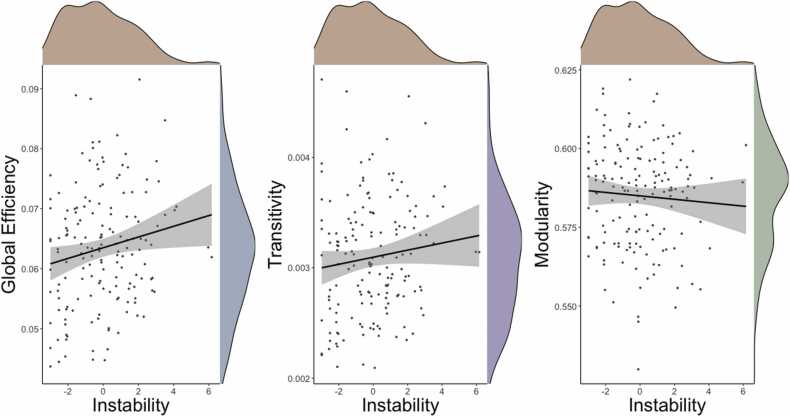
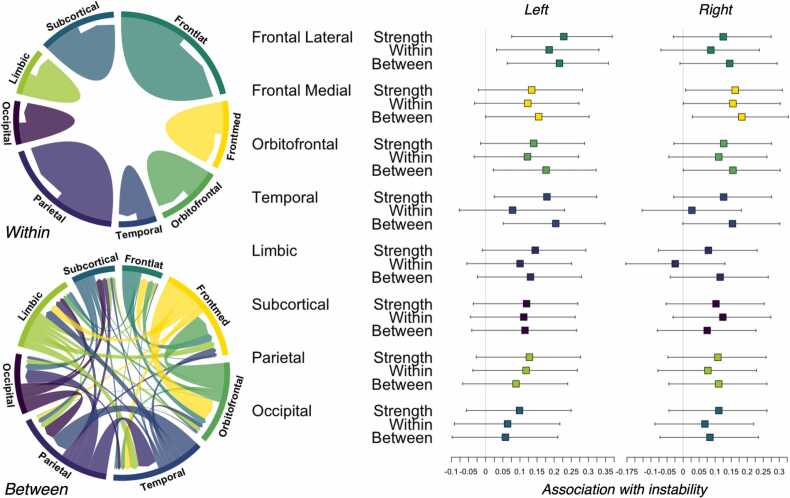
Unstable and unpredictable environments are linked to risk for psychopathology, but the underlying neural mechanisms that explain how instability relate to subsequent mental health concerns remain unclear. In particular, few studies have focused on the association between instability and white matter structures despite white matter playing a crucial role for neural development. In a longitudinal sample recruited from a population-based study (N = 237), household instability (residential moves, changes in household composition, caregiver transitions in the first 5 years) was examined in association with adolescent structural network organization (network integration, segregation, and robustness of white matter connectomes; Mage = 15.87) and young adulthood anxiety and depression (six years later). Results indicate that greater instability related to greater global network efficiency, and this association remained after accounting for other types of adversity (e.g., harsh parenting, neglect, food insecurity). Moreover, instability predicted increased depressive symptoms via increased network efficiency even after controlling for previous levels of symptoms. Exploratory analyses showed that structural connectivity involving the left fronto-lateral and temporal regions were most strongly related to instability. Findings suggest that structural network efficiency relating to household instability may be a neural mechanism of risk for later depression and highlight the ways in which instability modulates neural development.

Keywords: Depression; Instability; Network architecture; Structural network.


Conflict of interest statement

Declaration of Competing Interest The authors declare that they have no known competing financial interests or personal relationships that could have appeared to influence the work reported in this paper.

Figures

Fig. 1
Fig. 1
Structural networks subdivided into 8 subregions. Structural nodes and edges for one subject. Structural networks were subdivided into 8 regions based on the AAL2 anatomical parcellation (Rolls et al., 2015). Details on each node and coordinates are available in Supplemental. Within-region connections are depicted in the same color as the subregion, while between-regions connections are shown in grey. Thickness of edges (i.e., connections) differ based on edge weight (i.e., structural connectivity strength). Edges shown in 25 % sparsity for visualization purposes only and figures were created using BrainNet Viewer (Xia et al., 2013).
Fig. 2
Fig. 2
Associations between household instability and white matter structural networks. Zero-order correlations between instability and structural network properties. From left to right: greater instability was related to greater structural network efficiency (b* = 0.173, p = .028), but not transitivity (b* = 0.143, p = .149) or modularity (b* = − 0.062, p = .432). Distributions for each variable are shown in brown (instability), blue (global efficiency), purple (clustering), and green (modularity). Outliers (n = 2) were omitted for ease of visualization; results were consistent with or without inclusion of outliers. Household instability was represented by standardized scores.
Fig. 3
Fig. 3
Path model testing associations among early instability, other types of childhood adversity, and adolescent structural networks. Associations between instability and global efficiency remained (b* [SE] = 0.183 [0.077], p = .017) even after adjusting for other types of early adversity (i.e., harsh parenting, neglect, food insecurity). Additionally, harsh parenting was also associated with greater transitivity (b* [SE] = 0.312 [0.142], p = .029). Model was adjusted for demographic covariates (gender, ethnoracial identity, birth city, puberty, economic hardship) and had excellent fit (CFI = 0.986; TLI = 0.968; RMSEA = 0.036; SRMR = 0.042). Standardized coefficients are shown, and dotted path lines indicate non-significant estimated paths.
Fig. 4
Fig. 4
Early household instability indirectly related to depression at young adulthood via adolescent structural network efficiency. Childhood instability was related to greater structural network efficiency (b*[SE] = 0.192 [0.077], p = .013), which in turn related to greater depressive symptoms at young adulthood (b*[SE] = 0.523 [0.168], p = .002). Global efficiency indirectly explains the association between instability and depression (b*[SE] = 0.100 [0.049], p = .042). Model had excellent fit (CFI = 0.987; TLI = 0.957; RMSEA = 0.035; SRMR = 0.039) and was adjusted for all covariates (gender, ethnoracial identity, birth city, puberty, economic hardship, harsh parenting, neglect, food insecurity). Standardized coefficients are shown, and dotted path lines indicate non-significant estimated paths.
Fig. 5
Fig. 5
Associations between regional structural connectivity and early instability. LEFT: Circular plots illustrating within-region (i.e., connections between nodes within each region) and between-regions (i.e., connections between nodes of each region with all other regions) structural connectivity of one individual in the sample. RIGHT: Instability was particularly associated with the overall strength of structural paths connected to the left frontal lateral nodes (b* = 0.23, q = 0.029). Additionally, instability was related to connections between left frontal lateral nodes and other regions (b* = 0.19, q = 0.037), as well as connections between left temporal nodes and other regions (b* = 0.20, q = 0.037). Each square box denotes standardized estimate of the association between instability and each subregion connectivity metrics, and whiskers indicate confidence intervals.

References

    1. Andersson J.L.R., Graham M.S., Zsoldos E., Sotiropoulos S.N. Incorporating outlier detection and replacement into a non-parametric framework for movement and distortion correction of diffusion MR images. NeuroImage. 2016;141:556–572. doi: 10.1016/j.neuroimage.2016.06.058. - DOI - PubMed
    1. Angold A., Costello E.J., Messer S.C., Pickles A. Development of a short questionnaire for use in epidemiological studies of depression in children and adolescents. Int. J. Methods Psychiatr. Res. 1995;5(4):237–249.
    1. Bath K.G., Manzano-Nieves G., Goodwill H. Early life stress accelerates behavioral and neural maturation of the hippocampus in male mice. Horm. Behav. 2016;82:64–71. doi: 10.1016/j.yhbeh.2016.04.010. - DOI - PMC - PubMed
    1. Beck A.T., Epstein N., Brown G., Steer R.A. An inventory for measuring clinical anxiety: psychometric properties. J. Consult. Clin. Psychol. 1988:893–897. - PubMed
    1. Beck A.T., Steer R.A., Brown G. Vol. 10. Pearson; 1996. (Beck Depression Inventory–II).

Publication types