Can radiomics be used to detect hypoxic-ischemic encephalopathy in neonates without magnetic resonance imaging abnormalities?
- PMID: 37183229
- PMCID: PMC10421781
- DOI: 10.1007/s00247-023-05680-z
Can radiomics be used to detect hypoxic-ischemic encephalopathy in neonates without magnetic resonance imaging abnormalities?
Abstract
Background: No study has assessed normal magnetic resonance imaging (MRI) findings to predict potential brain injury in neonates with hypoxic-ischemic encephalopathy (HIE).
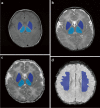
Objective: We aimed to evaluate the efficacy of MRI-based radiomics models of the basal ganglia, thalami and deep medullary veins to differentiate between HIE and the absence of MRI abnormalities in neonates.
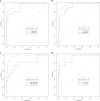
Materials and methods: In this study, we included 38 full-term neonates with HIE and normal MRI findings and 89 normal neonates. Radiomics features were extracted from T1-weighted images, T2-weighted images, diffusion-weighted imaging and susceptibility-weighted imaging (SWI). The different models were evaluated using receiver operating characteristic curve analysis. Clinical utility was evaluated using decision curve analysis.
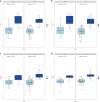
Results: The SWI model exhibited the best performance among the seven single-sequence models. For the training and validation cohorts, the area under the curves (AUCs) of the SWI model were 1.00 and 0.98, respectively. The combined nomogram model incorporating SWI Rad-scores and independent predictors of clinical characteristics was not able to distinguish HIE in patients without MRI abnormalities from the control group (AUC, 1.00). A high degree of fitting and favorable clinical utility was detected using the calibration curve with the Hosmer-Lemeshow test. Decision curve analysis was used for the SWI, clinical and combined nomogram models. The decision curve showed that the SWI and combined nomogram models had better predictive performance than the clinical model.
Conclusions: HIE can be detected in patients without MRI abnormalities using an MRI-based radiomics model. The SWI model performed better than the other models.
Keywords: Brain; Hypoxic–ischemic encephalopathy; Magnetic resonance imaging; Neonate; Radiomics.
© 2023. The Author(s).
Conflict of interest statement
None
Figures


Similar articles
-
Prediction of feeding difficulties in neonates with hypoxic-ischemic encephalopathy using magnetic resonance imaging-derived radiomics features.Pediatr Radiol. 2024 Nov;54(12):2036-2045. doi: 10.1007/s00247-024-06065-6. Epub 2024 Oct 1. Pediatr Radiol. 2024. PMID: 39349660
-
Radiomics based of deep medullary veins on susceptibility-weighted imaging in infants: predicting the severity of brain injury of neonates with perinatal asphyxia.Eur J Med Res. 2023 Jan 6;28(1):9. doi: 10.1186/s40001-022-00954-y. Eur J Med Res. 2023. PMID: 36609425 Free PMC article.
-
A radiomics-based study of deep medullary veins in infants: Evaluation of neonatal brain injury with hypoxic-ischemic encephalopathy via susceptibility-weighted imaging.Front Neurosci. 2023 Jan 17;16:1093499. doi: 10.3389/fnins.2022.1093499. eCollection 2022. Front Neurosci. 2023. PMID: 36733926 Free PMC article.
-
Temporal Evolution of Signal Alterations in the Deep Gray Nuclei in term Neonates With Hypoxic-Ischemic Brain Injury: A Comprehensive Review.J Child Neurol. 2023 Aug;38(8-9):550-556. doi: 10.1177/08830738231188561. Epub 2023 Jul 27. J Child Neurol. 2023. PMID: 37499176 Review.
-
Neuroimaging in the term newborn with neonatal encephalopathy.Semin Fetal Neonatal Med. 2021 Oct;26(5):101304. doi: 10.1016/j.siny.2021.101304. Epub 2021 Oct 29. Semin Fetal Neonatal Med. 2021. PMID: 34736808 Free PMC article. Review.
Cited by
-
Prediction of feeding difficulties in neonates with hypoxic-ischemic encephalopathy using magnetic resonance imaging-derived radiomics features.Pediatr Radiol. 2024 Nov;54(12):2036-2045. doi: 10.1007/s00247-024-06065-6. Epub 2024 Oct 1. Pediatr Radiol. 2024. PMID: 39349660
References
MeSH terms
Grants and funding
LinkOut - more resources
Full Text Sources

