. 2023 Jul;22(7):e13865.
doi: 10.1111/acel.13865. Epub 2023 May 15.

PTEN-induced kinase 1 is associated with renal aging, via the cGAS-STING pathway

Affiliations

PTEN-induced kinase 1 is associated with renal aging, via the cGAS-STING pathway

Min Heui Ha et al. Aging Cell. 2023 Jul.

Abstract

Mitochondrial dysfunction is considered to be an important mediator of the pro-aging process in chronic kidney disease, which is continuously increasing worldwide. Although PTEN-induced kinase 1 (PINK1) regulates mitochondrial function, its role in renal aging remains unclear. We investigated the association between PINK1 and renal aging, especially through the cGAS-STING pathway, which is known to result in an inflammatory phenotype. Pink1 knockout (Pink1-/- ) C57BL/6 mice and senescence-induced renal tubular epithelial cells (HKC-8) treated with H2 O2 were used as the renal aging models. Extensive analyses at transcriptomic-metabolic levels have explored changes in mitochondrial function in PINK1 deficiency. To investigate whether PINK1 deficiency affects renal aging through the cGAS-STING pathway, we explored their expression levels in PINK1 knockout mice and senescence-induced HKC-8 cells. PINK1 deficiency enhances kidney fibrosis and tubular injury, and increases senescence and the senescence-associated secretory phenotype (SASP). These phenomena were most apparent in the 24-month-old Pink1-/- mice and HKC-8 cells treated with PINK1 siRNA and H2 O2 . Gene expression analysis using RNA sequencing showed that PINK1 deficiency is associated with increased inflammatory responses, and transcriptomic and metabolomic analyses suggested that PINK1 deficiency is related to mitochondrial metabolic dysregulation. Activation of cGAS-STING was prominent in the 24-month-old Pink1-/- mice. The expression of SASPs was most noticeable in senescence-induced HKC-8 cells and was attenuated by the STING inhibitor, H151. PINK1 is associated with renal aging, and mitochondrial dysregulation by PINK1 deficiency might stimulate the cGAS-STING pathway, eventually leading to senescence-related inflammatory responses.

Keywords: PINK1; STING; chronic kidney disease; mitochondria; renal aging.


Conflict of interest statement

The authors declare no conflicts of interest.

Figures

FIGURE 1
FIGURE 1
PINK1 deficiency increases renal fibrosis and tubular injury. (a) Representative photomicrographs of periodic acid‐Schiff‐stain of Pink1+/+ and Pink1−/− mice kidneys at the age of 4 and 24 months. A semiquantitative assessment of renal tubular injury score was performed. Scale bar = 100 μm. (b) Representative photomicrographs of Masson's Trichrome‐stained Pink1+/+ and Pink1−/− mice kidneys at the age of 4 and 24 months. A semiquantitative assessment of renal fibrosis was performed. Scale bar = 50 μm. (c) Western blotting of kidney injury molecule‐1 (Kim‐1) and neutrophil gelatinase‐associated lipocalin (NGAL). (d) Quantification of albuminuria in Pink1+/+ and Pink1−/− mice at the age of 4 and 24 months. (e) Measurement of serum creatinine in Pink1+/+ and Pink1−/− mice kidneys at the age of 4 and 24 months. Mean ± standard error of mean. *p < 0.05, **p < 0.01, ***p < 0.001 vs. Pink1+/+ 4 M, # p < 0.05, ## p < 0.01, ### p < 0.001 vs. Pink1−/− 4 M, p < 0.05, †† p < 0.01, ††† p < 0.001 vs. Pink1+/+ 24 M, M, months.
FIGURE 2
FIGURE 2
PINK1 deficiency increases senescence and senescence‐associated secretory phenotypes, aggravating renal aging and renal tubular epithelial cells. (a) The mRNA levels of senescence signaling mediators (p53, p16, and p21) in Pink1+/+ and Pink1−/− mice at the age of 4 and 24 months. (b) Western blotting of senescence signaling mediators (p53, p16, and p21) and cell cycle markers (proliferating cell nuclear antigen (PCNA) and p‐Rb) in Pink1+/+ and Pink1−/− mice at the age of 4 and 24 months. (c) The mRNA levels of SASPs (CTGF, Fn, a‐SMA, TGF‐β1, NF‐kb, and IL‐1β) in Pink1+/+ and Pink1−/− mice at the age of 4 and 24 months. (d) Western blotting of SASPs (CTGF, Fn, a‐SMA, TGF‐β1, IL‐1β, NF‐kb, and p‐NF‐kb p65) in Pink1+/+ and Pink1−/− mice at the age of 4 and 24 months. (e) Quantitative protein level of PCNA and p‐NF‐kb/NF‐kb for Western blot assay in Pink1+/+ and Pink1−/− mice kidneys at the age of 4 and 24 months. (f) The mRNA levels of senescence signaling mediators, p53, p16, and p21, in siCONT and siPINK1 renal tubular epithelial cells (HKC‐8) with H2O2 treatment. (g) Western blotting of senescence signaling mediators (p53, p16, and p21) and a cell cycle marker (p‐Rb) in siCONT and siPINK1 H2O2‐treated HKC‐8 cells. (h) The mRNA level of SASPs (CTGF, Fibronectin, α‐SMA, TGF‐β1, and IL‐1β) in siCONT and siPINK1 H2O2‐treated HKC‐8 cells. (i) Western blotting of SASPs (Fibronectin, α‐SMA, TGF‐β1, p‐NF‐kb‐p65, and NF‐kb p65) in siCONT and siPINK1 H2O2‐treated HKC‐8 cells. (j) Quantitative protein level of p‐NF‐kb/NF‐kb for Western blot assay in siCONT and siPINK1 H2O2‐treated HKC‐8 cells. mean ± standard error of mean. (a, c, e) *p < 0.05, **p < 0.01, ***p < 0.001 vs. Pink1+/+ 4 M, # p < 0.05, ## p < 0.01, ### p < 0.001 vs. Pink1−/− 4 M, p < 0.05, †† p < 0.01, ††† p < 0.001 vs. Pink1+/+ 24 M, M, months. (f, h, j) *p < 0.05, **p < 0.01, ***p < 0.001 vs. siCONT without H2O2, # p < 0.05, ## p < 0.01, ### p < 0.001 vs. siPINK1 without H2O2, p < 0.05, †† p < 0.01, ††† p < 0.001 vs. siCONT with H2O2, CONT, control.
FIGURE 3
FIGURE 3
Gene enrichment analysis comparing Pink1+/+ and Pink1−/− mice at 24 months. (a) The volcano plot shows statistically significant differentially expressed genes based on log2‐fold change of Pink1−/− 24‐month‐old mice, compared to Pink1+/+ 24 month‐old mice. The significant differentially expressed proteins are shaded in red, and the significance threshold at p‐value 0.05 is indicated by the dashed line. (b) The GO analysis and (c) KEGG pathway enrichment analysis of significantly expressed proteins (p < 0.05). The bubble graphs of each presents top 20 most functionally enriched pathways. The data were analyzed using DAVID bioinformatics tools. (d) Heatmap of top 6 significantly increased (red) or decreased (blue) genes associated with inflammatory responses between Pink1−/− 24‐month‐old mice and Pink1+/+ 24‐month‐old mice.
FIGURE 4
FIGURE 4
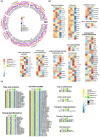
Transcriptional change and metabolic simulation comparing in Pink1+/+ and Pink1−/− mice at 4 and 24 months. (a) The circular heatmap demonstrates the z‐score statistics of gene expression of mitochondrial complexes, comparing Pink1−/− to Pink1+/+ mice, at the age of 4 and 24 months. Statistical significance was determined using the z‐score. (b) The differential expression of mitochondrial respiration and biogenetic pathways. Analysis on mitochondrial fatty acid oxidation, TCA cycle, ATP/ADP‐Pi exchange, fatty acid synthesis, mitochondrial fatty acid synthesis (mtFASII), folate metabolism, NADPH synthesis, coenzyme Q biosynthesis, gluconeogenesis, glycolysis and integrater stress response comparing Pink1−/− to Pink1+/+ mice at the age of 4 and 24 months. Statistical significance was determined using the z‐score. (c) The heatmaps show flux values of mitochondrial metabolic pathways from Pink1+/+ and Pink1−/− mice at the age of 4 and 24 months. The leftmost bar indicates fluxes whose results correspond to p < 0.05 (black) or p values between 0.05 and 0.1 (gray). Heatmap color scales indicate row‐wise Z‐scores for a particular flux.
FIGURE 5
FIGURE 5
PINK1 deficiency leads to mitochondrial dysfunction in aging mice models and tubular epithelial cells treated with H2O2. (a) Measurement of seahorse XF cell mitochondrial oxygen consumption rate (OCR) test assay performed on siCONT and siPINK1 renal tubular epithelial cells treated with H2O2. (b) PINK1 deficiency affects basal respiration, maximal respiratory capacity, ATP production, and spare respiration capacity. (c, d) The comparison of LC3B and Tom20 colocalization in siPINK1 cells, to control cells, under H2O2 treatment. (e) Western blotting of mitophagy markers (Parkin, p62, LC3 I and II) in siCONT and siPINK1 H2O2‐treated HKC‐8 cells. (f, g) The levels of 8‐OH‐dG in Pink1+/+ and Pink1−/− mice kidney at ages 4 and 24 months (h, i) Representative transmission electron microscopy images from Pink1+/+ and Pink1−/− mice kidney at ages 4 and 24 months. Mean ± standard error of mean. (b, d) *p < 0.05, **p < 0.01, ***p < 0.001 vs. siCONT without H2O2, # p < 0.05, ## p < 0.01, ### p < 0.001 vs. siPINK1 without H2O2, p < 0.05, †† p < 0.01, ††† p < 0.001 vs. siCONT with H2O2, CONT, control. (g, i) *p < 0.05, **p < 0.01, ***p < 0.001 vs. Pink1+/+ 4 M, # p < 0.05, ## p < 0.01, ### p < 0.001 vs. Pink1−/− 4 M, p < 0.05, †† p < 0.01, ††† p < 0.001 vs. Pink1+/+ 24 M, M, months.
FIGURE 6
FIGURE 6
PINK1 deficiency activates cGAS‐STING pathway in aging mice model and tubular epithelial cells treated with H2O2. (a) The mRNA levels of cGAS and STING in Pink1+/+ and Pink1−/− mice kidney tissue at 4 and 24 months. (b) Western blotting of cGAS and STING in Pink1+/+ and Pink1−/− mice kidney tissue at 4 and 24 months. (c) The change of cGAS, STING, senescence signaling mediator and SASPs in siPINK1 and H2O2 treated cells on STING inhibitor, H‐151. (d) Schematic diagram summarizing role of PINK1 on renal aging. PINK1 deficiency enhances mitochondrial dysfunction known to be one of the STING activators, and eventually leads to renal aging presented by increased inflammatory response. Mean ± standard error of mean. (a) *p < 0.05, **p < 0.01, ***p < 0.001 vs. Pink1+/+ 4 M, # p < 0.05, ## p < 0.01, ### p < 0.001 vs. Pink1−/− 4 M, p < 0.05, †† p < 0.01, ††† p < 0.001 vs. Pink1+/+ 24 M, M, months (c) *p < 0.05, **p < 0.01, ***p < 0.001 vs. siCONT+H2O2, # p < 0.05, ## p < 0.01, ### p < 0.001 vs. siPINK1+ H2O2, CONT, control.

References

    1. Anders, S. , Pyl, P. T. , & Huber, W. (2015). HTSeq – a python framework to work with high‐throughput sequencing data. Bioinformatics, 31(2), 166–169. 10.1093/bioinformatics/btu638 - DOI - PMC - PubMed
    1. Bhansali, S. , Bhansali, A. , Walia, R. , Saikia, U. N. , & Dhawan, V. (2017). Alterations in mitochondrial oxidative stress and Mitophagy in subjects with prediabetes and type 2 diabetes mellitus. Frontiers in Endocrinology, 8, 347. 10.3389/fendo.2017.00347 - DOI - PMC - PubMed
    1. Bhatia, D. , Capili, A. , & Choi, M. E. (2020). Mitochondrial dysfunction in kidney injury, inflammation, and disease: Potential therapeutic approaches. Kidney Research and Clinical Practice, 39(3), 244–258. 10.23876/j.krcp.20.082 - DOI - PMC - PubMed
    1. Bhatia, D. , & Choi, M. E. (2019). The emerging role of Mitophagy in kidney diseases. Journal of Life Science (Westlake Village), 1(3), 13–22. 10.36069/jols/20191203 - DOI - PMC - PubMed
    1. Bhatia, D. , Chung, K. P. , Nakahira, K. , Patino, E. , Rice, M. C. , Torres, L. K. , … Choi, M. E. (2019). Mitophagy‐dependent macrophage reprogramming protects against kidney fibrosis. JCI Insight, 4(23), e132826. 10.1172/jci.insight.132826 - DOI - PMC - PubMed

Publication types