

Optimizing assays of zebrafish larvae swimming performance for drug discovery
- PMID: 37183669
- PMCID: PMC10485652
- DOI: 10.1080/17460441.2023.2211802
Optimizing assays of zebrafish larvae swimming performance for drug discovery
Abstract
Introduction: Zebrafish larvae are one of the few vertebrates amenable to large-scale drug discovery screens. Larval swimming behavior is often used as an outcome variable and many fields of study have developed assays for evaluating swimming performance. An unintended consequence of this wide interest is that details related to assay methodology and interpretation become scattered across the literature. The aim of this review is to consolidate this information, particularly as it relates to high-throughput approaches.
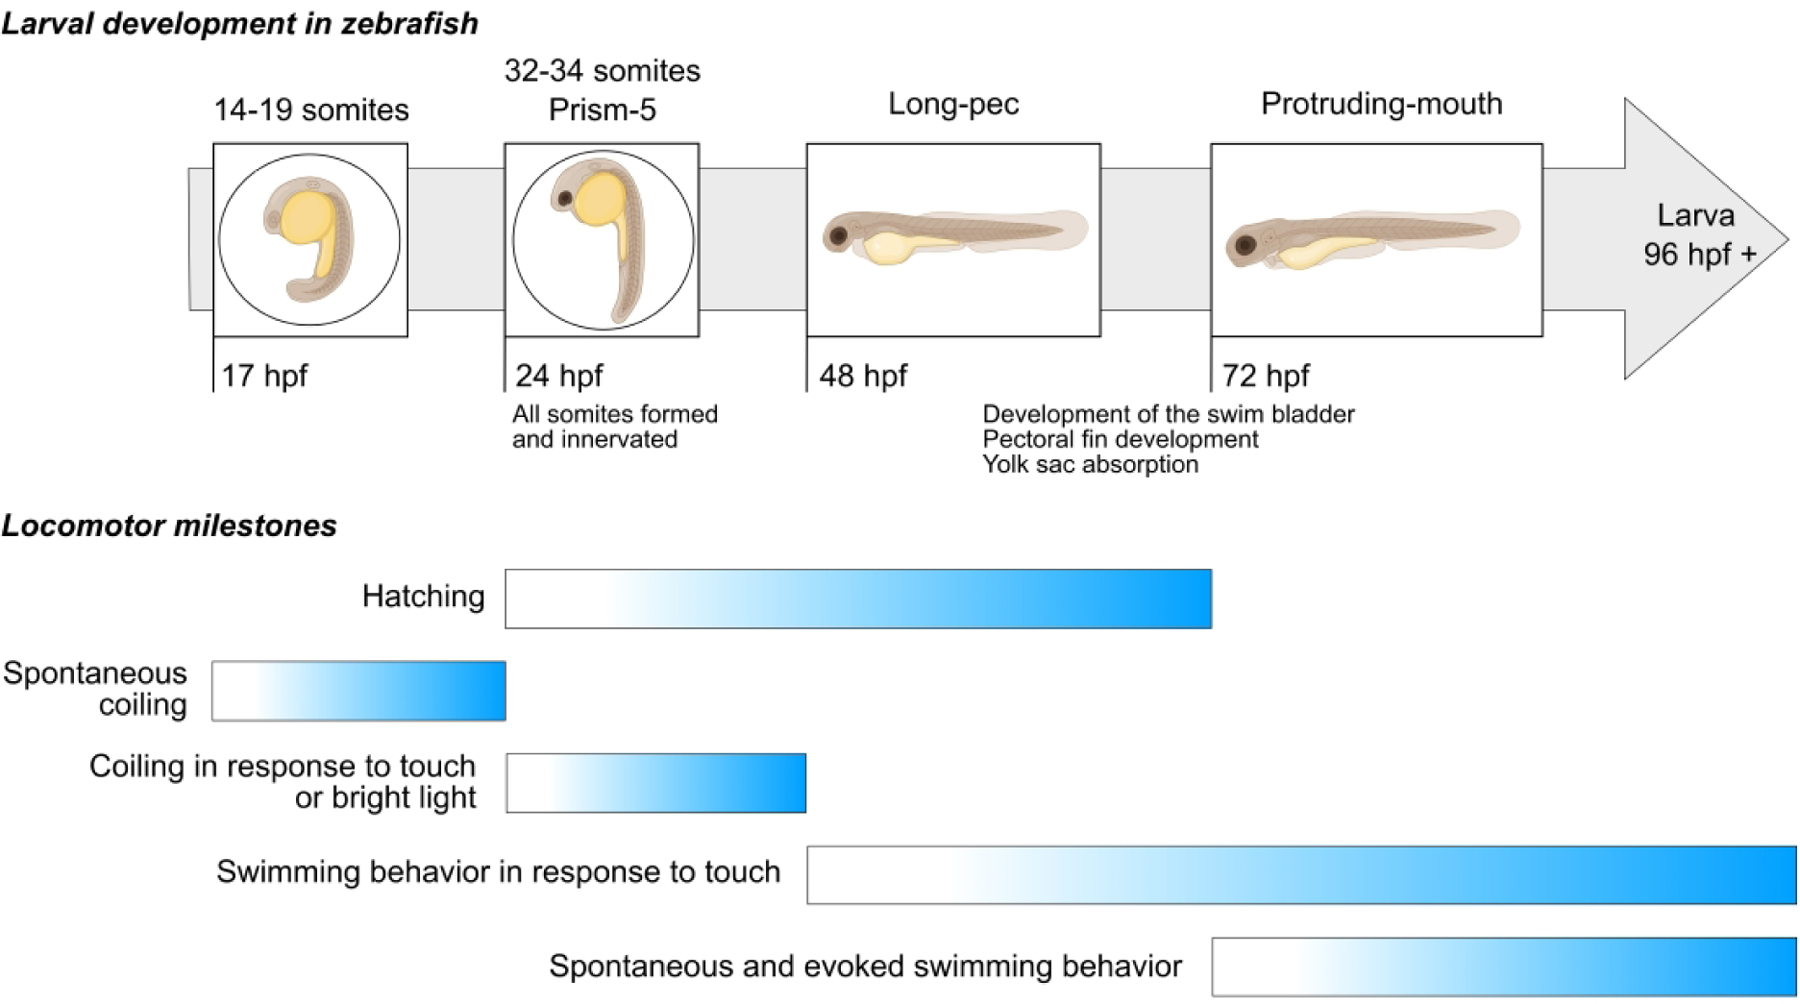
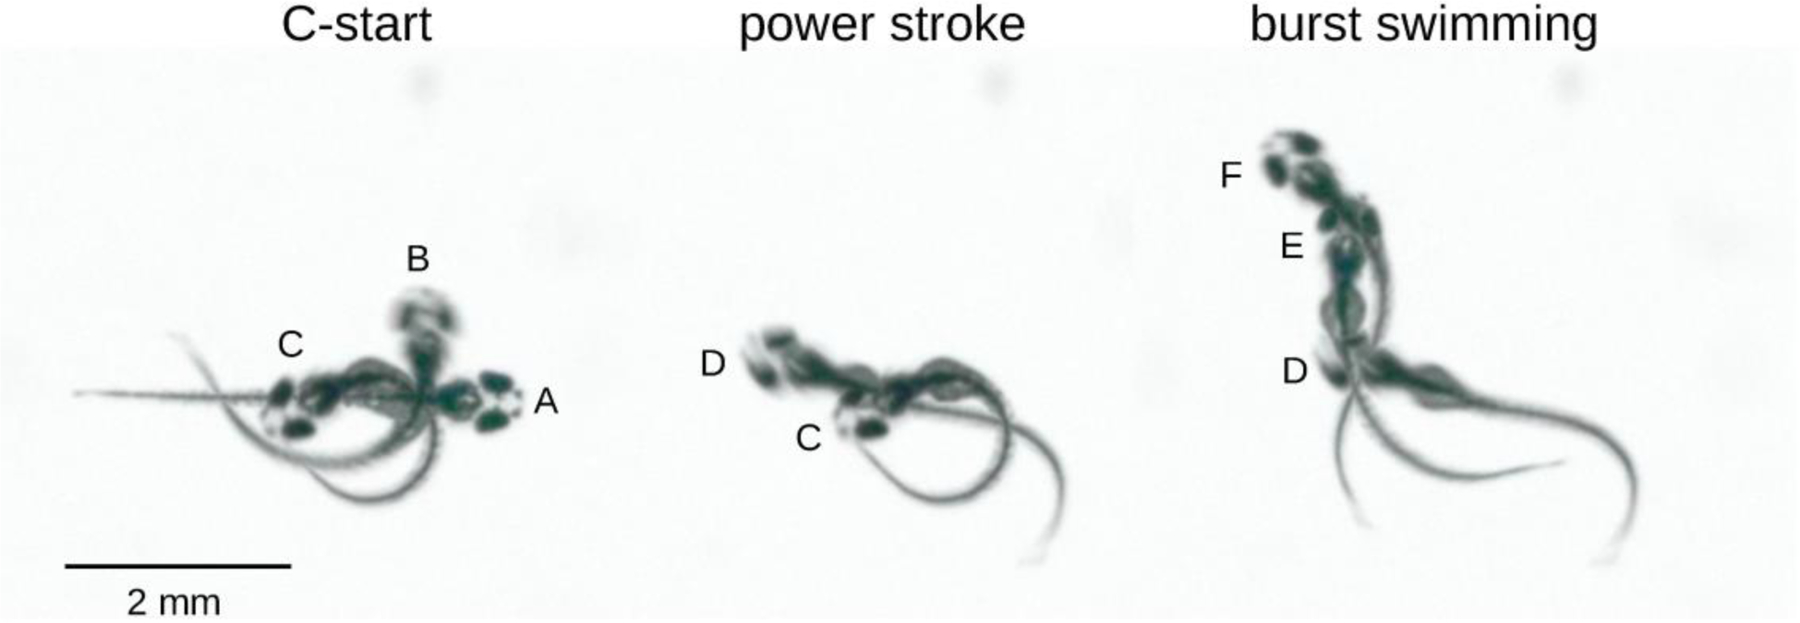
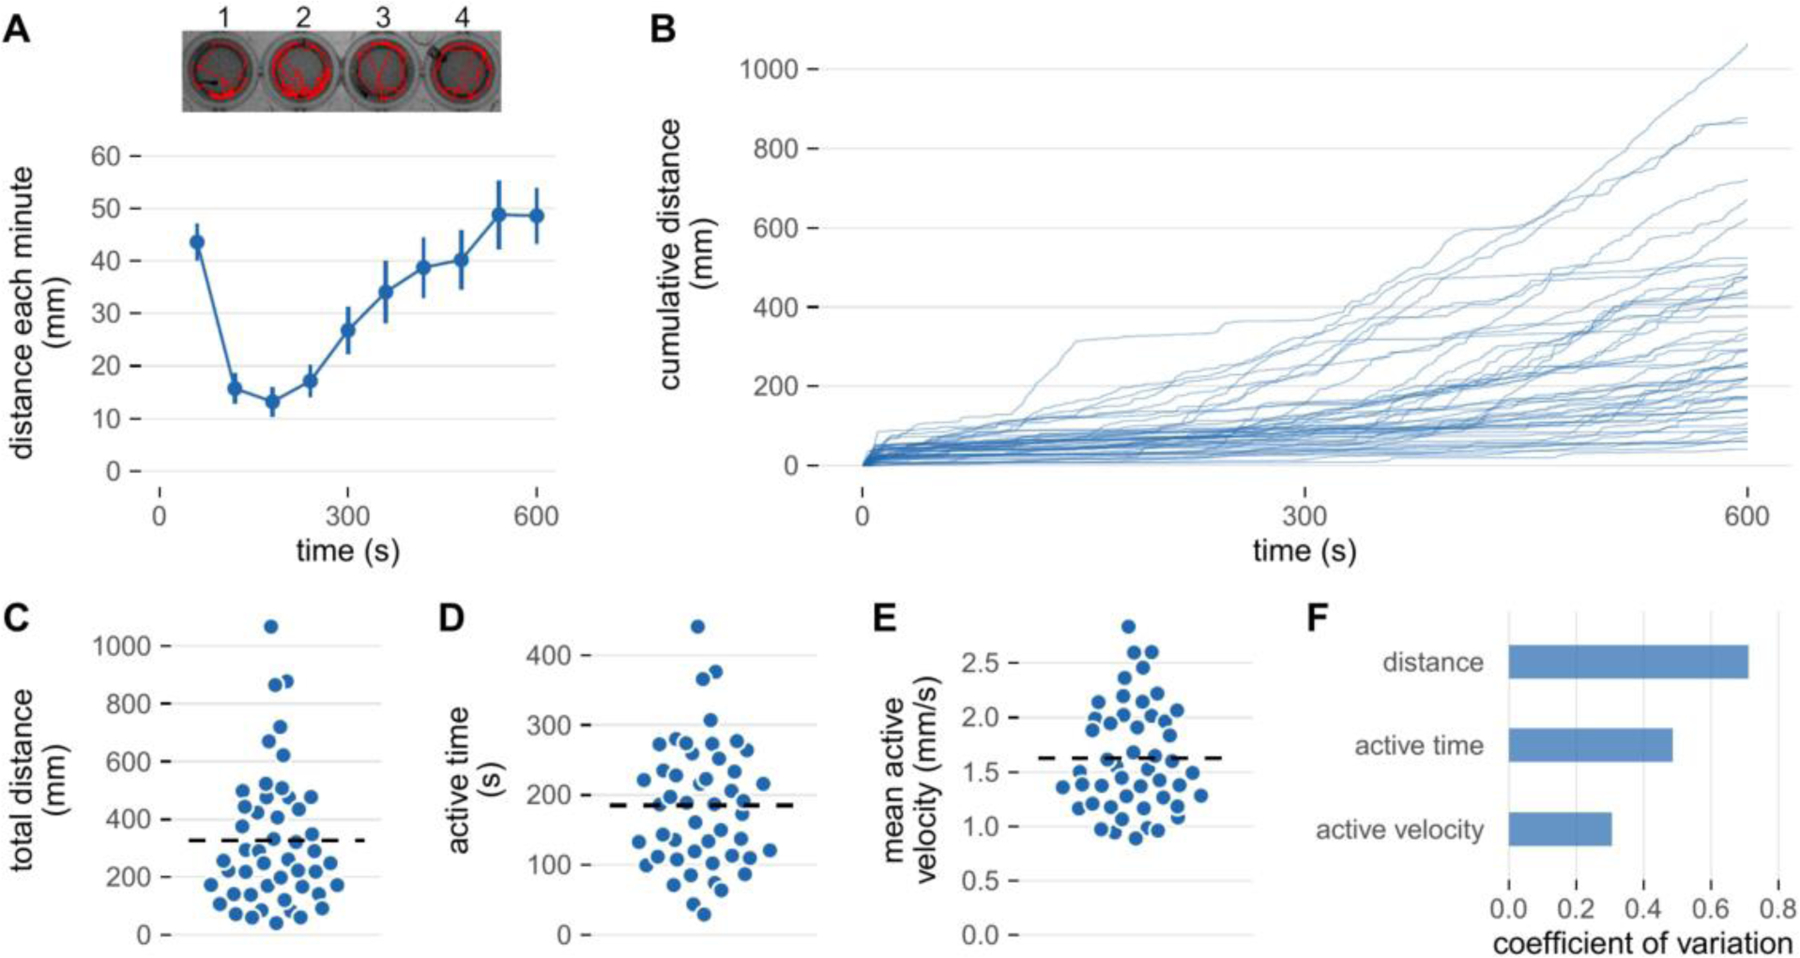
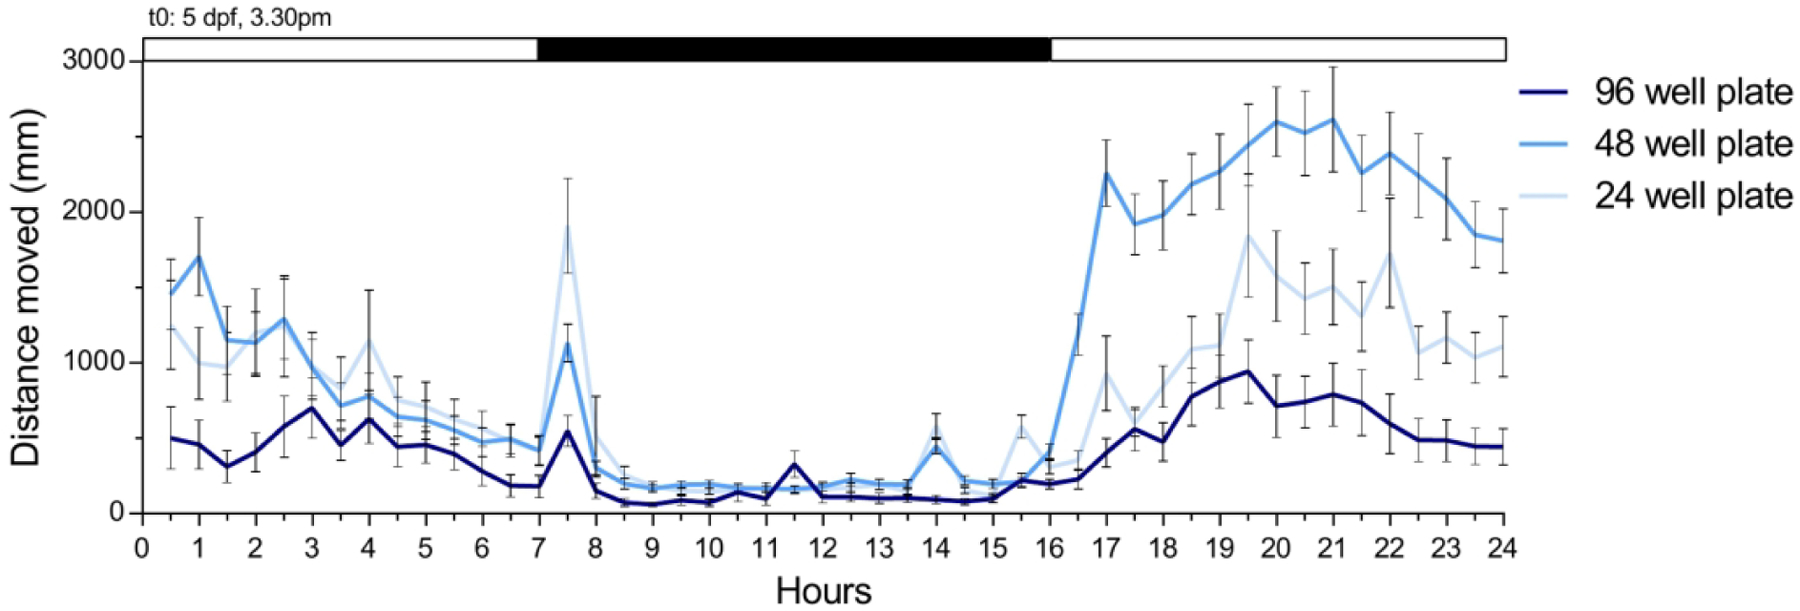
Areas covered: The authors describe larval swimming behaviors as this forms the basis for understanding their experimentally evoked swimming or spontaneous activity. Next, they detail how swimming activity can serve as an outcome variable, particularly in the multi-well formats used in large-scale screening studies. They also highlight biological and technical factors that can impact the sensitivity and variability of these measurements.
Expert opinion: Careful attention to animal husbandry, experimental design, data acquisition, and interpretation of results can improve screen outcomes by maximizing swimming activity while minimizing intra- and inter-larval variability. The development of more sensitive, quantitative methods of assessing swimming performance that can be incorporated into high-throughput workflows will be important in order to take full advantage of the zebrafish model.
Keywords: Danio rerio; Zebrafish; biomechanics; drug development; locomotion; swimming.
Conflict of interest statement
Figures
Similar articles
-
Swimming of larval zebrafish: fin-axis coordination and implications for function and neural control.J Exp Biol. 2004 Nov;207(Pt 24):4175-83. doi: 10.1242/jeb.01285. J Exp Biol. 2004. PMID: 15531638
-
Movement and function of the pectoral fins of the larval zebrafish (Danio rerio) during slow swimming.J Exp Biol. 2011 Sep 15;214(Pt 18):3111-23. doi: 10.1242/jeb.057497. J Exp Biol. 2011. PMID: 21865524
-
Action sequencing in the spontaneous swimming behavior of zebrafish larvae - implications for drug development.Sci Rep. 2017 Jun 9;7(1):3191. doi: 10.1038/s41598-017-03144-7. Sci Rep. 2017. PMID: 28600565 Free PMC article.
-
The Use of Larval Zebrafish (Danio rerio) Model for Identifying New Anxiolytic Drugs from Herbal Medicine.Zebrafish. 2018 Aug;15(4):321-339. doi: 10.1089/zeb.2018.1562. Epub 2018 May 31. Zebrafish. 2018. PMID: 29851363 Review.
-
Inconsistencies in variable reporting and methods in larval zebrafish behavioral assays.Neurotoxicol Teratol. 2023 Mar-Apr;96:107163. doi: 10.1016/j.ntt.2023.107163. Epub 2023 Feb 8. Neurotoxicol Teratol. 2023. PMID: 36758822 Free PMC article. Review.
Cited by
-
Toxicity assessment of VX in zebrafish: multi-organ toxicity evaluation and tissue distribution visualization using DESI-MSI.Arch Toxicol. 2025 Aug 19. doi: 10.1007/s00204-025-04148-3. Online ahead of print. Arch Toxicol. 2025. PMID: 40828198
-
Automated detection of complex zebrafish seizure behavior at scale.Commun Biol. 2025 Jun 5;8(1):872. doi: 10.1038/s42003-025-08310-6. Commun Biol. 2025. PMID: 40473736 Free PMC article.
-
High resolution kinematic approach for quantifying impaired mobility of dystrophic zebrafish larvae.bioRxiv [Preprint]. 2024 Dec 9:2024.12.05.627004. doi: 10.1101/2024.12.05.627004. bioRxiv. 2024. PMID: 39713379 Free PMC article. Preprint.
-
Modeling zebrafish escape swim reveals maximum neuromuscular power output and efficient body movement adaptation to increased water viscosity.iScience. 2025 Feb 17;28(3):112056. doi: 10.1016/j.isci.2025.112056. eCollection 2025 Mar 21. iScience. 2025. PMID: 40124491 Free PMC article.
-
Standardization of zebrafish drug testing parameters for muscle diseases.Dis Model Mech. 2024 Jan 1;17(1):dmm050339. doi: 10.1242/dmm.050339. Epub 2024 Jan 18. Dis Model Mech. 2024. PMID: 38235578 Free PMC article.
References
-
- Streisinger G, Walker C, Dower N, et al. Production of clones of homozygous diploid zebra fish (Brachydanio Rerio). Nature 1981;291:293–296. - PubMed
-
- Kimmel CB, Ballard WW, Kimmel SR, et al. Stages of embryonic development of the zebrafish. Dev Dyn 1995;203:253–310. - PubMed
-
- Nüsslein-Volhard C The zebrafish issue of Development. Development. 2012;139:4099–4103. - PubMed
-
- Nasevicius A, Ekker SC. Effective targeted gene ‘knockdown’ in zebrafish. Nat Genet 2000;26:216–220. - PubMed
Publication types
MeSH terms
Grants and funding
LinkOut - more resources
Full Text Sources