. 2023 May 15;133(10):e162188.
doi: 10.1172/JCI162188.

Cardiac pericytes mediate the remodeling response to myocardial infarction

Affiliations

Cardiac pericytes mediate the remodeling response to myocardial infarction

Pearl Quijada et al. J Clin Invest. .

Abstract

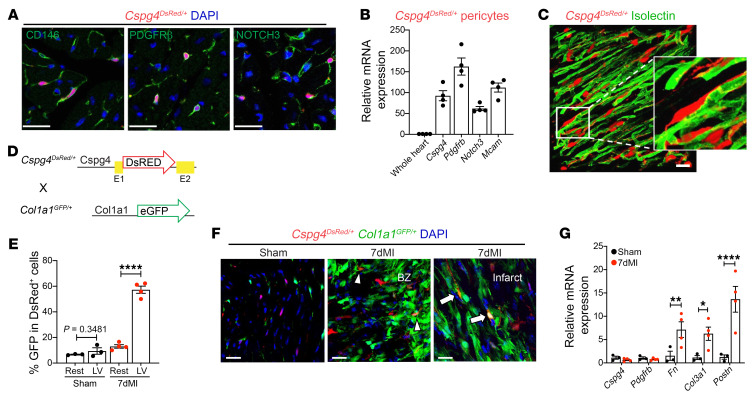
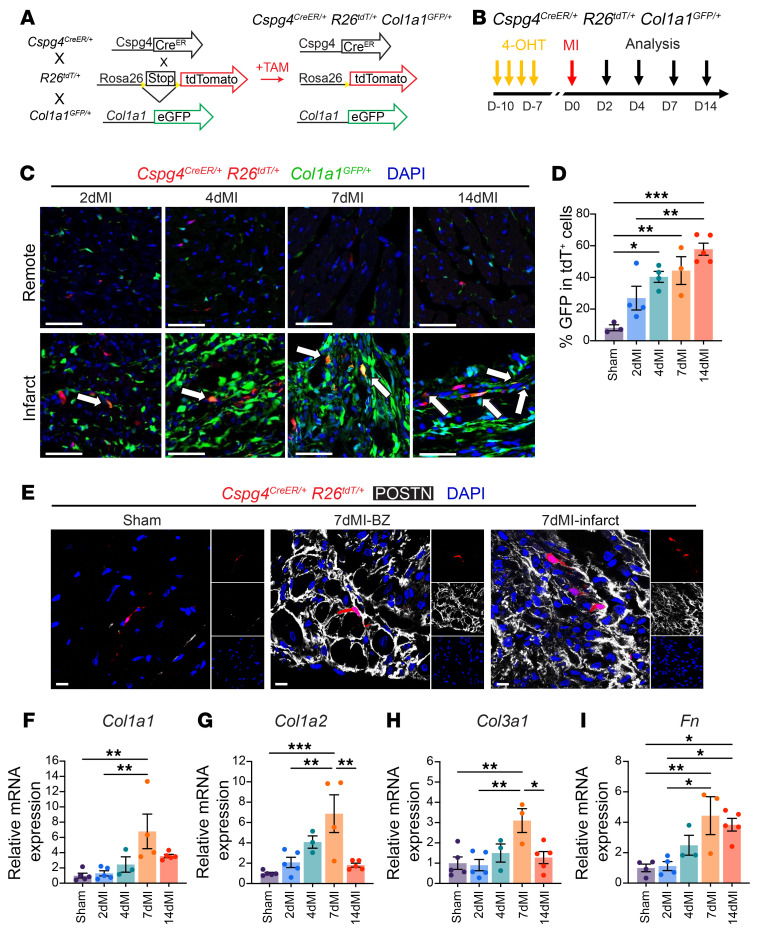
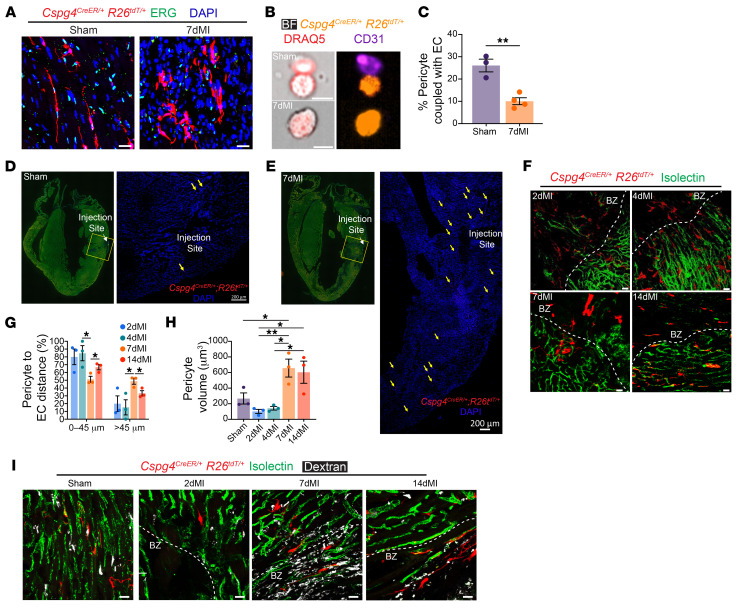
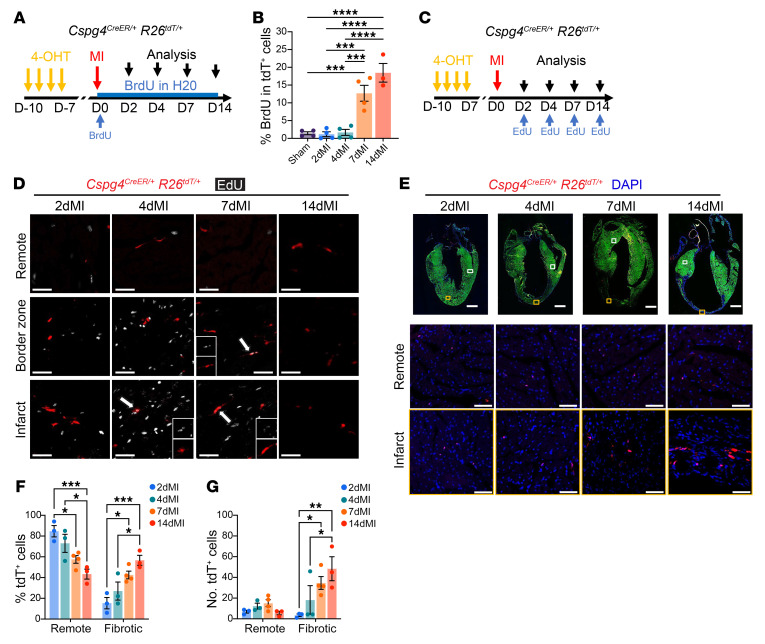
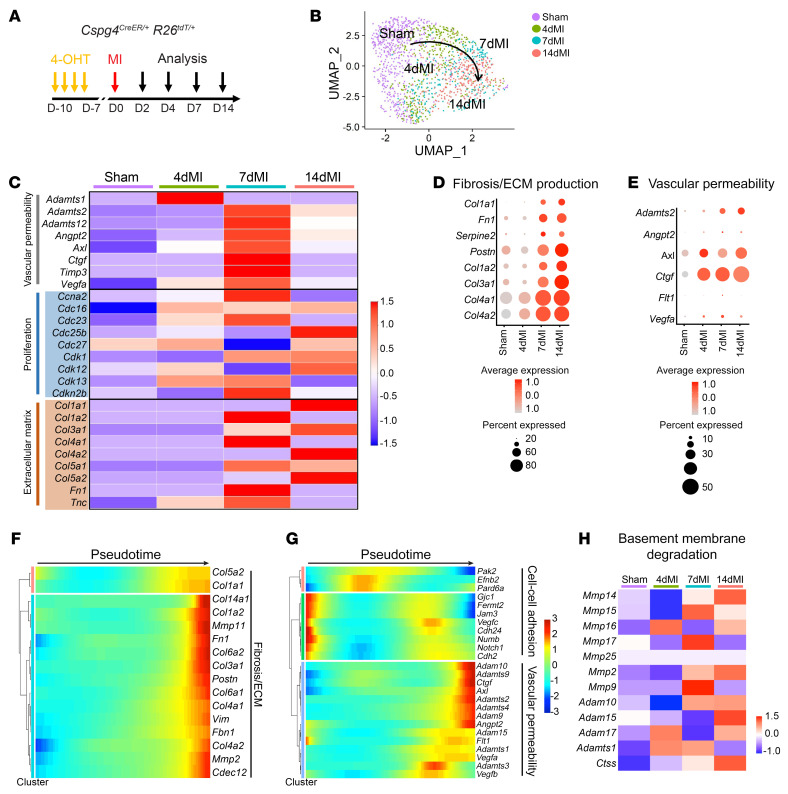
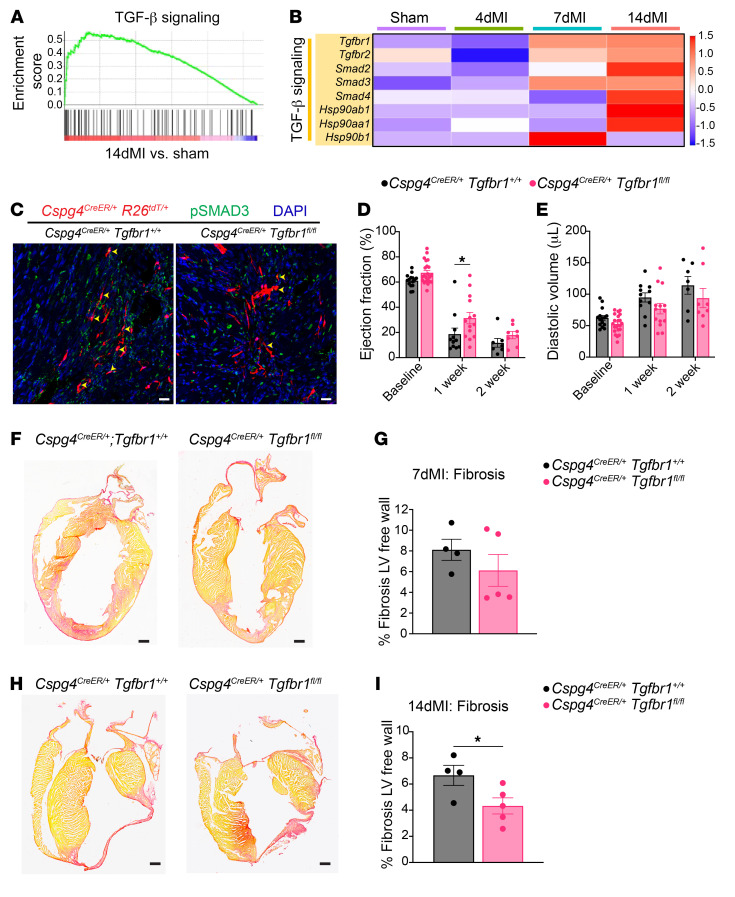
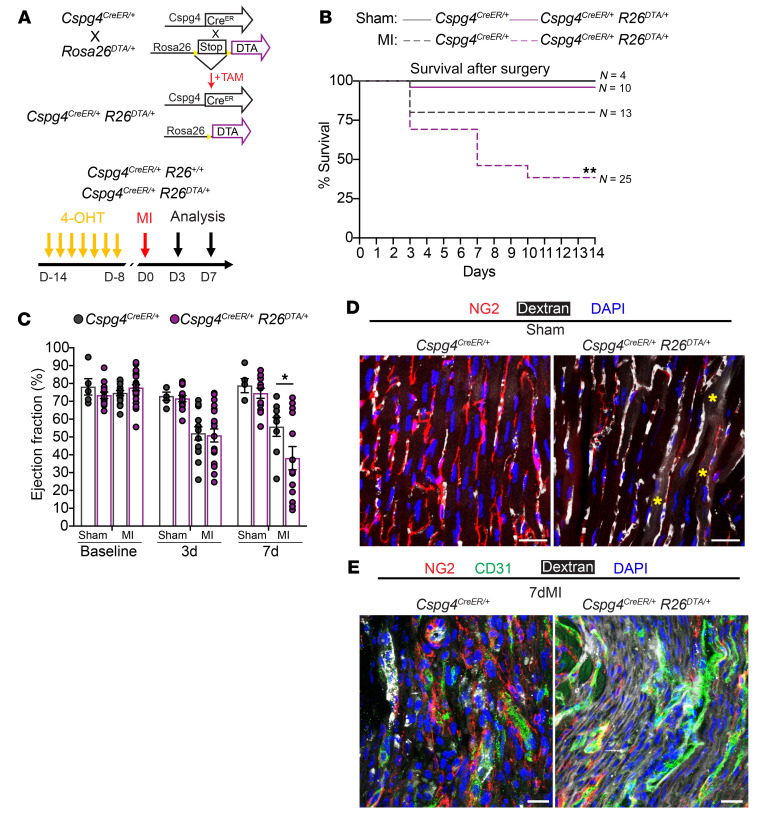
Despite the prevalence of pericytes in the microvasculature of the heart, their role during ischemia-induced remodeling remains unclear. We used multiple lineage-tracing mouse models and found that pericytes migrated to the injury site and expressed profibrotic genes, coinciding with increased vessel leakage after myocardial infarction (MI). Single-cell RNA-Seq of cardiac pericytes at various time points after MI revealed the temporally regulated induction of genes related to vascular permeability, extracellular matrix production, basement membrane degradation, and TGF-β signaling. Deleting TGF-β receptor 1 in chondroitin sulfate proteoglycan 4-expressing (Cspg4-expressing) cells reduced fibrosis following MI, leading to a transient improvement in the cardiac ejection fraction. Furthermore, genetic ablation of Cspg4-expressing cells resulted in excessive vascular permeability, a decline in cardiac function, and increased mortality in the second week after MI. These data reveal an essential role for cardiac pericytes in the control of vascular homeostasis and the fibrotic response after acute ischemic injury, information that will help guide the development of novel strategies to preserve vascular integrity and attenuate pathological cardiac remodeling.

Keywords: Cardiology; Cardiovascular disease; Fibrosis; Pericytes; Vascular Biology.


Figures

Figure 1
Figure 1. Cspg4+ cardiac pericytes express Col1a1 after MI.
(A) DsRed+ cells (red) in Cspg4DsRed/+ hearts expressed the pericyte markers CD146, PDGFRβ, and Notch3 (markers are shown in green). Images are representative of 3 experiments. (B) Pericyte marker genes were highly expressed in DsRed+ cells isolated by FACS compared with expression in whole, unsorted heart samples. n = 4 hearts. (C) DsRed+ pericytes were closely associated with isolectin+ vasculature in healthy Cspg4DsRed/+ hearts. Images are representative of 3 experiments. (D) Experimental strategy for the generation of Cspg4DsRed/+ Col1a1GFP/+ double-transgenic mice. (E) The percentage of DsRed+ pericytes that coexpressed GFP in Cspg4DsRed/+ Col1a1GFP/+ hearts increased in the left ventricle (LV) seven days after MI compared with sham-operated control hearts. n =3 sham and n = 4 MI hearts. An unpaired, 2-tailed Student’s t test was conducted to compare sham and 7-day post-MI (7dMI) hearts (rest and LV). (F) DsRed+GFP+ cells were observed in the BZ and infarct areas in Cspg4DsRed/+ Col1a1GFP/+ hearts. Arrowheads indicate DsRed+ cells with low GFP expression, and arrows represent DsRed+ cells with high expression of GFP. Images are representative of 3 sham and 4 MI experiments. (G) Relative gene expression in DsRed+ cells collected by FACS and analyzed following RT-qPCR. n = 3 sham and n = 4 MI hearts. An unpaired, 2-tailed Student’s t test was conducted to compare sham and 7dMI samples for each gene. Scale bars: 20 μm. *P < 0.05, **P < 0.01, and ****P < 0.0001.
Figure 2
Figure 2. Cspg4-lineage pericytes accumulate in the infarct area and express Col1a1 after MI.
(A) Breeding plan for the generation of Cspg4CreER/+ Rosa26tdT/+ Col1a1GFP/+ triple-transgenic mice. (B) Schematic for TAM injection before MI. Hearts were analyzed 2, 4, 7, and 14 days (D) after MI. (C) Representative images of the left ventricular free wall of Cspg4CreER/+ Rosa26tdT/+ Col1a1GFP/+ hearts during MI. tdTomato+GFP+ cells were observed in the infarct region (bottom) compared with the remote region (top). Scale bars: 50 μm for both infarct and remote regions. Images are representative of 4 2dMI, 4 4dMI, 3 7dMI, and 5 14dMI experiments. Arrows highlight tdTomato+GFP+ cells. (D) GFP expression in tdTomato+ (tdT+) cells increased over the MI period as analyzed by flow cytometry. n = 3 sham, n = 4 2dMI, n = 4 4dMI, n = 3 7dMI, and n = 5 14dMI hearts. (E) POSTN was expressed in tdTomato+ lineage–traced pericytes following 7 days of MI in the BZ and infarct areas but not in noninjured hearts of the sham-operated mice. Scale bars: 20 μm for infarct and remote regions. Images are representative of 3 sham and 3 7dMI experiments. (FI) Relative gene expression of profibrotic and ECM genes in tdTomato+ cells collected via FACS from sham and MI hearts. n = 4–5 sham, n = 4–5 2dMI, n = 3 4dMI, n = 3–4 7dMI, and n = 5 14dMI hearts. *P < 0.05, **P < 0.01, and ***P < 0.001, by 1-way ANOVA with Tukey’s multiple-comparison test (D and FI).
Figure 3
Figure 3. Cardiac pericytes dissociate from the microvasculature following MI.
(A) Using IHC, the evaluation of Cspg4-lineage cells (red) was relative to ECs identified by the nuclear protein marker ERG (green) 7 days after infarction. Scale bars: 20 μm. (B) Analysis of pericyte-EC interactions using Amnis ImageStream Technology following sham surgery or 7 days of MI. Pericytes are labeled in orange, ECs are labeled with CD31 antibody (purple), and nucleated cells were visualized by staining with DRAQ5 (red) and overlayed with bright-field images. Scale bars: 10 μm. Images in A and B are representative of 3 sham and 4 7dMI experiments. (C) Pericyte-EC interactions were reduced in Cspg4-lineage mice following 7 days of MI. n = three sham and n = four 7dMI hearts. An unpaired, 2-tailed Student’s t test was performed to compare sham and 7dMI hearts. (D) Sham and (E) 7dMI Cspg4CreER/+ R26tdT/+ mice were subjected to an intramyocardial injection of 2 μL TAM immediately followed by surgery. (D) tdTomato+ pericytes were observed near the injection site in the sham-operated animals, whereas (E) tdTomato+ pericytes were discovered proximal and distal to the injection site following 7 days of MI. Yellow arrows indicate tdTomato+ cells. Scale bars: 200 μm. Images in D and E are representative of 3 sham and MI experiments each. (F) Visualization of pericytes relative to intact microvasculature in MI-injured hearts around the BZ regions. Isolectin (intact vasculature) is shown in green. Scale bars: 20 μm. (G) Percentage of pericytes in regions proximal (0–45 μm) or distal to the BZ area (>45 μm) following a time course of MI. n = 3 each for sham, 2dMI, 4dMI, 7dMI, and 14dMI hearts. Data were analyzed by 1-way ANOVA with Tukey’s multiple-comparison test. (H) Pericyte volume (μm3) was increased at post-MI days 7 and 14. n = 3 sham, 2dMI, 4dMI, 7dMI and 14dMI hearts. Data were analyzed by 1-way ANOVA with Tukey’s multiple-comparison test. (I) Visualization of pericytes relative to intact and leaky microvasculature in healthy (sham-treated) or MI-injured hearts around the BZ regions. Isolectin (intact vasculature, green) and dextran (leaky vasculature, white) was administered to mice on the day of isolation. Scale bars: 20 μm. Data in F and I are representative of 3 sham, 2dMI, 4dMI, 7dMI, and 14dMI experiments. *P < 0.05 and **P < 0.01.
Figure 4
Figure 4. Cspg4-lineage cardiac pericytes proliferate in the infarcted area.
(A) Schematic of BrdU administration. After surgery, Cspg4CreER/+ Rosa26tdT/+ mice received a single injection of BrdU, followed by ad libitum administration of water containing BrdU. (B) Flow cytometric analysis of the percentage of BrdU+tdTomato+ cells in Cspg4CreER/+ Rosa26tdT/+ mouse hearts that had undergone sham or MI operation. n = 4 sham, 2dMI, 4dMI, 7dMI hearts and n = 3 14dMI hearts. Data were analyzed by 1-way ANOVA with Tukey’s multiple-comparison test. (C) Schematic of Cspg4CreER/+ Rosa26tdT/+ mice subjected to single injections of EdU for 4 hours at specified MI time points. Analyses are representative of four 2dMI, 4dMI, and 7dMI experiments, and three 14dMI experiments. (D) Proliferating (EdU+, white) tdTomato+ cells were found within the BZ and infarct area (arrows) but not in the remote area. Scale bars: 50 μm. (E) Representative images show the localization of tdTomato+ cells in the remote and infarct areas during MI. Scale bars: 50 μm (remote and infarct regions) and 1 mm (whole heart images). Images are representative of four 2dMI, 4dMI, 14dMI experiments, and three 7dMI experiments. The (F) percentage and (G) number of tdTomato+ cells in the fibrotic regions of the heart increased during MI and relative to the remote region. n = 3 sham, 2dMI, 4dMI, and 14dMI hearts and n = four 7dMI hearts. Data were analyzed by 1-way ANOVA with Tukey’s multiple-comparison test. *P < 0.05, **P < 0.01, ***P < 0.001, and ****P < 0.0001.
Figure 5
Figure 5. Single-cell transcriptional sequencing of cardiac pericytes reveals the induction of profibrotic gene signatures following MI.
(A) Schematic for TAM injection before MI. Hearts were analyzed 4, 7, and 14 days after MI. (B) UMAP of single pericytes isolated from sham-operated hearts and after specified time points after MI. (C) Heatmap representation of genes associated with vascular permeability, cell proliferation, and ECM production in sham and MI isolated pericytes. The scale represents normalized expression. (D and E) Dot plots indicating the expression of selected marker genes associated with fibrosis and vascular permeability in sham and MI pericytes. The colored scale represents the average expression levels. The dot size represents the percentage of cells expressing the gene of interest. (F and G) Pseudotime expression of genes related to fibrosis and ECM, cell-cell adhesion, and vascular permeability in cardiac pericytes. The scale represents normalized expression. (H) Heatmap representation of genes associated with basement membrane degradation in sham and MI isolated pericytes. The scale represents normalized expression.
Figure 6
Figure 6. Deletion of Tgfbr1 in cardiac pericytes.
(A) GSEA of TGF-β signaling in pericytes isolated from hearts 14 days after sham or MI surgery. (B) Heatmap representation of genes related to TGF-β signaling in cardiac pericytes isolated from sham-operated hearts and hearts at early and late stages of MI. The scale represents normalized expression. (C) Immunohistochemical analysis of pericytes (red) and p-SMAD3 (green) in control and experimental mice 7 days after MI. Yellow arrowheads highlight p-SMAD3 in tdTomato+ pericytes. Scale bars: 20 μm. Images are representative of 3 control and 3 experimental hearts. Evaluation of (D) cardiac function through the measurement of ejection fraction and (E) cardiac morphometry by analysis of left ventricular diastolic volume in control Cspg4CreER/+ Tgfbr1+/+ and experimental Cspg4CreER/+ Tgfbr1fl/fl mice. n = 15 control and n = 22 experimental mice at baseline; n = 11 control and n = 14 experimental mice 1 week after MI; n = 7 control and n = 8 experimental mice 2 weeks after MI. Data were analyzed by 2-way ANOVA with Šidák’s multiple-comparison test. Fibrosis in control and experimental mice (F and G) 7 days after MI and (H and I) 14 days after MI as measured by Picrosirius red staining. Collagen fibers, red. Live myocardium, yellow. n = 4 control and n = 5 experimental mice were analyzed by unpaired, 2-tailed Student’s t test. Scale bars: 500 μm. Data in F and H are representative of 4 control and 5 experimental hearts. *P < 0.05.
Figure 7
Figure 7. Cspg4-lineage pericytes are required for vascular stability after MI.
(A) Schematic representation for the generation of Cspg4CreE2/+ R26DTA/+ mice before TAM administration and performance of sham or MI surgery. (B) Kaplan-Meier survival curve for control Cspg4CreER/+ and experimental Cspg4CreERT2/+ R26DTA/+ mice following sham or MI surgery. Cspg4CreER/+ sham, n = 4 and MI, n = 13; Cspg4CreERT2/+ R26DTA/+ sham, n = 10 and MI, n = 25. Survival curves were analyzed using a log-rank (Mantel-Cox) test. (C) The ejection fraction was measured in sham-operated and MI-injured animals, starting at baseline and up to 7 days after surgery. Baseline Cspg4CreER/+ sham, n = 5 and MI, n = 15, 3dMI Cspg4CreER/+ sham, n = 5 and MI, n = 13, 7dMI Cspg4CreER/+ sham, n = 5 and MI, n = 8; baseline Cspg4CreERT2/+ R26DTA/+ sham, n = 13 and MI, n = 25, 3dMI Cspg4CreERT2/+ R26DTA/+ sham, n = 13 and MI, n = 19, 7dMI Cspg4CreERT2/+ R26DTA/+ sham, n = 12 and MI, n = 13. Data were analyzed by 2-way ANOVA with Šidák’s multiple-comparison test. (D) Immunohistochemical analysis of sham-operated hearts to visualize pericytes (NG2, red) and dextran-based permeability from the vasculature. (E) Immunohistochemical analysis of hearts 7 days after MI to visualize pericytes (NG2, red) and ECs (CD31, green) and dextran to assess vascular permeability. Scale bars: 20 μm (D and E). Images in D and E are representative of 3 control and 3 experimental hearts. *P < 0.05 and **P < 0.01.

References

    1. Frangogiannis NG. Regulation of the inflammatory response in cardiac repair. Circ Res. 2012;110(1):159–173. doi: 10.1161/CIRCRESAHA.111.243162. - DOI - PMC - PubMed
    1. Travers JG, et al. Cardiac fibrosis: the fibroblast awakens. Circ Res. 2016;118(6):1021–1040. doi: 10.1161/CIRCRESAHA.115.306565. - DOI - PMC - PubMed
    1. Dias Moura Prazeres PH, et al. Pericytes are heterogeneous in their origin within the same tissue. Dev Biol. 2017;427(1):6–11. doi: 10.1016/j.ydbio.2017.05.001. - DOI - PMC - PubMed
    1. Lin SL, et al. Pericytes and perivascular fibroblasts are the primary source of collagen-producing cells in obstructive fibrosis of the kidney. Am J Pathol. 2008;173(6):1617–1627. doi: 10.2353/ajpath.2008.080433. - DOI - PMC - PubMed
    1. Pham TTD, et al. Heart and brain pericytes exhibit a pro-fibrotic response after vascular injury. Circ Res. 2021;129(7):e141–e143. - PMC - PubMed

Publication types