. 2023 Jul 3;378(1880):20220083.
doi: 10.1098/rstb.2022.0083. Epub 2023 May 15.

Developmental origin underlies evolutionary rate variation across the placental skull

Affiliations

Developmental origin underlies evolutionary rate variation across the placental skull

Anjali Goswami et al. Philos Trans R Soc Lond B Biol Sci. .

Abstract

The placental skull has evolved into myriad forms, from longirostrine whales to globular primates, and with a diverse array of appendages from antlers to tusks. This disparity has recently been studied from the perspective of the whole skull, but the skull is composed of numerous elements that have distinct developmental origins and varied functions. Here, we assess the evolution of the skull's major skeletal elements, decomposed into 17 individual regions. Using a high-dimensional morphometric approach for a dataset of 322 living and extinct eutherians (placental mammals and their stem relatives), we quantify patterns of variation and estimate phylogenetic, allometric and ecological signal across the skull. We further compare rates of evolution across ecological categories and ordinal-level clades and reconstruct rates of evolution along lineages and through time to assess whether developmental origin or function discriminate the evolutionary trajectories of individual cranial elements. Our results demonstrate distinct macroevolutionary patterns across cranial elements that reflect the ecological adaptations of major clades. Elements derived from neural crest show the fastest rates of evolution, but ecological signal is equally pronounced in bones derived from neural crest and paraxial mesoderm, suggesting that developmental origin may influence evolutionary tempo, but not capacity for specialisation. This article is part of the theme issue 'The mammalian skull: development, structure and function'.

Keywords: cranial neural crest; development; ecology; morphometrics; skull evolution.


Conflict of interest statement

We declare we have no competing interests.

Figures

Figure 1.
Figure 1.
Developmental origins of cranial elements in the placental skull. Modified from Piekarski et al. [48].
Figure 2.
Figure 2.
Morphometric data shown on Vulpes pallida in oblique, dorsal, lateral and ventral views, from top to bottom. Left: Cranial landmarks (red) and semi-landmarks (gold). Right: Data coloured by cranial elements: nasal (red), premaxilla (orange), maxilla (yellow), jugal (green), frontal (dark green), squamosal (light green), pterygoid (light purple), palatine (pink), parietal (sky blue), occipital (dark blue) and basisphenoid (light blue). Note that the premaxilla, maxilla, squamosal and occipital are further separated into smaller regions in analyses. Regions and morphometric data are detailed further in electronic supplementary material, table S2.
Figure 3.
Figure 3.
Principal component analyses of four representative cranial regions: nasal, ventral maxilla, parietal and basioccipital. PCs 1–4 for all regions provided in electronic supplementary material, figure S1, with interactive PCAs available at https://github.com/anjgoswami/Goswami_et_al_Placental_evolution_2022.
Figure 4.
Figure 4.
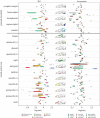
Ecological influences on evolutionary tempo. Rates of evolution in each cranial region, separated by ecological category for diet and locomotion.
Figure 5.
Figure 5.
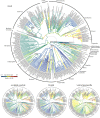
Evolutionary rates per branch for four representative cranial regions. All extracted from analysis with BayesTraits and displaying a variable rates Brownian motion model with a lambda tree transformation. Full results in electronic supplementary material, figure S2.
Figure 6.
Figure 6.
Rates of evolution for each cranial region plotted against time. Results from analyses with BayesTraits using phylogenetic PC scores representing 95% of the total variation, calculated separately for each cranial region. As a result, patterns through time, but not raw rate values, are directly comparable.

References

    1. Simpson GG. 1937. The beginning of the age of mammals. Biol. Rev. 12, 1-46. (10.1111/j.1469-185X.1937.tb01220.x) - DOI
    1. Goswami A, et al. . 2022. Attenuated evolution of mammals through the Cenozoic. Science 378, 377-383. (10.1126/science.abm7525) - DOI - PubMed
    1. Grossnickle DM, Newham E. 2016. Therian mammals experience an ecomorphological radiation during the Late Cretaceous and selective extinction at the K–Pg boundary. Proc. R. Soc. B 283, 20160256. (10.1098/rspb.2016.0256) - DOI
    1. Bertrand OC, et al. . 2022. Brawn before brains in placental mammals after the end-Cretaceous extinction. Science 376, 80-85. (10.1126/science.abl5584) - DOI - PubMed
    1. Lyson TR, et al. . 2019. Exceptional continental record of biotic recovery after the Cretaceous–Paleogene mass extinction. Science 366, 977-983. (10.1126/science.aay2268) - DOI - PubMed

Publication types

LinkOut - more resources