. 2023 Aug 7;220(8):e20221604.
doi: 10.1084/jem.20221604. Epub 2023 May 15.

Identification of an anergic BND cell-derived activated B cell population (BND2) in young-onset type 1 diabetes patients

Affiliations

Identification of an anergic BND cell-derived activated B cell population (BND2) in young-onset type 1 diabetes patients

Zachary C Stensland et al. J Exp Med. .

Abstract

Recent evidence suggests a role for B cells in the pathogenesis of young-onset type 1 diabetes (T1D), wherein rapid progression occurs. However, little is known regarding the specificity, phenotype, and function of B cells in young-onset T1D. We performed a cross-sectional analysis comparing insulin-reactive to tetanus-reactive B cells in the blood of T1D and controls using mass cytometry. Unsupervised clustering revealed the existence of a highly activated B cell subset we term BND2 that falls within the previously defined anergic BND subset. We found a specific increase in the frequency of insulin-reactive BND2 cells in the blood of young-onset T1D donors, which was further enriched in the pancreatic lymph nodes of T1D donors. The frequency of insulin-binding BND2 cells correlated with anti-insulin autoantibody levels. We demonstrate BND2 cells are pre-plasma cells and can likely act as APCs to T cells. These findings identify an antigen-specific B cell subset that may play a role in the rapid progression of young-onset T1D.


Conflict of interest statement

Disclosures: The authors declare no competing interests exist.

Figures

None
Graphical abstract
Figure 1.
Figure 1.
Unsupervised clustering reveals novel B cell subpopulations among T1D and HC donors. (A) Overall schematic of the study and unsupervised clustering analysis. Insulin-binding and tetanus-binding B cells were enriched from the peripheral blood of T1D (n = 38) and HC (n = 40) donors, stained with a panel of B cell–focused antibodies, and processed for mass cytometry. (B) UMAP plots of B cell populations identified through clustering by surface marker expression for T1D and HC donors using mass cytometry. 12 unique B cell subsets were identified for the T1D and HC groups. IgM memory B cells were found only in HC, while IgD memory B cells were found only in T1D subjects (cluster 6). Autoreactive anergic BND cells (CD27 IgMlo IgD+) were divided into two subpopulations, BND1 and BND2, based on differences in activation markers. BND2 cells exhibit increased surface marker expression of CD69, CD80, CD95, and CD11c compared with BND1 cells. (C) Violin plots of insulin-binding levels for each B cell population identified for T1D and HC donors. The red dotted line indicates the cutoff for true insulin-binding versus non-binding B cells. The cutoff was determined using T cell binding and unenriched B cells as negative controls. BND1, BND2, and IgD memory B cells were enriched in insulin-reactivity in T1D subjects, while BND2, CD11c+ MN, and DN2 cells were enriched in insulin-reactivity in HC. (D) Violin plots of tetanus-binding levels for each B cell population for comparison to insulin-binding levels.
Figure S1.
Figure S1.
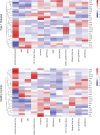
Heatmap of surface marker expression levels in the B cell subsets identified by unsupervised clustering for T1D and HC donors.
Figure S2.
Figure S2.
UMAP projections for insulin-binding-only, tetanus-binding-only, and non-binding-only B cells from T1D and HC donors.
Figure 2.
Figure 2.
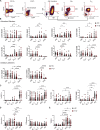
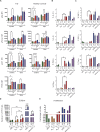
Surface marker expression of BND2 cells demonstrates these cells are recently activated and enriched in insulin reactivity. (A) Manual gating scheme for identification of MN, BND1, BND2, and DN2 populations. (B) Comparison of surface marker expression levels of various activation and inhibitory molecules for MN, BND1, BND2, and DN2. Antibody staining intensity is represented as median metal intensity (MdMI). BND2 cells exhibit significantly increased expression of markers of activation compared to BND1 cells, which is similar to DN2 cells. BND2 cells maintain surface expression of the inhibitory receptors CD72 and CD22 compared with DN2 cells. (C) Comparison of BND2 cells with surface markers associated with PB/plasma cells. BND2 cells have significantly reduced levels of markers associated with PB/plasma cells but are increased in expression of CD71 and CD38 compared with DN2 cells. PB were gated as CD19+ CD38hi CD27hi. (D) Comparison of the frequency of insulin- and tetanus-positive B cells among various B cell subsets. BND1 and BND2 cells are enriched in insulin reactivity, but not tetanus reactivity, compared with DN2 cells. (E) Comparison of the frequency of IgG+ B cells among the various B cell subsets. BND2 cells have increased expression of surface IgG compared to BND1 cells but is decreased compared with DN2 cells. Data generated from T1D (n = 38) and HC (n = 40) donors. Statistical significance determined by mixed-effects model. *P < 0.05, **P < 0.01, ***P < 0.001, ****P < 0.0001.
Figure 3.
Figure 3.
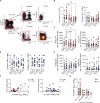
Insulin-binding BND2 cells are increased in young-onset T1D subjects and correlate with insulin autoantibody levels. (A) Gating strategy to determine insulin and tetanus reactivity among antigen enriched fractions. PBMCs were enriched for insulin-binding and tetanus-binding B cells simultaneously using magnetic beads. The enriched fractions were labeled with anti-CD45-113Cd, while the depleted fractions were stained with anti-CD45-89Y. Enriched and depleted fractions were combined and processed through the mass cytometer as one sample. To define/gate on insulin-binding and tetanus-binding B cells, antigen-binding levels in the enriched fraction were compared to the depleted fraction, as well as to T cells (not shown). (B) Insulin-binding BND2 cells are significantly increased in young-onset T1D (≤10 yr old; n = 12) compared with 11–17 yr old (n = 13) T1D and ≥18 yr old (n = 13) T1D groups. Insulin-binding BND2 cells were not increased compared to young ≤10 yr old HC (n = 13), 11–17 yr old HC (n = 12), or ≥18 yr old HC (n = 15). Tetanus-binding BND2 cells are not increased in young-onset T1D, demonstrating specificity of an increase in insulin-reactive B cells. Statistical significance determined by one-way ANOVA with Tukey multiple comparisons post-test. **P < 0.01. (C) Absolute number of insulin- and tetanus-binding BND2 cells in T1D and HC. *P < 0.05 (D) The frequency of insulin- and tetanus-binding DN2 cells were not significantly increased in the young-onset T1D group. (E) Absolute number of insulin- and tetanus-binding DN2 cells are not significantly different. (F) The frequency of insulin-binding BND2 cells, but not DN2 cells, in T1D subjects, irrespective of their age of onset, correlates with anti-insulin antibody titers (mIAA Levels). The black dotted line indicates cutoff value for insulin autoantibody positivity. Statistical significance determined by Spearman’s Correlation, ***P < 0.001. (G) Increased frequency of insulin-binding BND2 cells is associated with carriers of the high-risk HLA-DR4-DQ8 allele (red), whereas decreased frequency of insulin-binding BND2 cells is associated with the T1D protective DQ*0602 allele (green). Black solid bar indicates mean for each group.
Figure 4.
Figure 4.
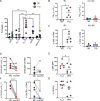
Insulin-binding BND2 cells are increased in the pLN of T1D donors and express increased CD86 expression compared with DN2 cells. (A) The percentage of insulin-reactive B cells among each B cell subset. Insulin-binding B cells were enriched from the pLN of T1D (n = 6) and ND (n = 3) donors using magnetic beads and analyzed using flow cytometry. BND2 cells are enriched in insulin-reactive B cells in T1D donors compared with MN, BND1, DN2, and memory (gated as CD27+) B cells. ND control donors have decreased levels of insulin-reactive B cells. Differences were determined using a mixed-effects model. (B) The percent of insulin-binding (IBC) BND2 cells is increased in T1D donors compared with ND donors. The percentage of non-IBC BND2 cells is not increased, demonstrating islet-antigen specificity of the finding. Statistical significance determined by unpaired Student’s t test. (C) Insulin-binding DN2 cells are also increased in T1D donors, but not non-IBC DN2 cells. Statistical significance determined by unpaired Student’s t tests. (D) IBC BND2 cells exhibit increased expression of the activation molecule CD86 on their cell surface compared to non-IBC BND2 cells in T1D donors. CD86 expression among IBC DN2 cells is decreased in 4/6 T1D donors compared to non-IBC DN2 cells. (E) CD86 expression is significantly increased in insulin-binding BND2 cells compared to DN2 cells in T1D donors. (F) The percent of IBC BND2 cells that are CXCR3+ is significantly increased compared to non-IBC BND2 cells. Similarly, the percentage of IBC DN2 cells that are CXCR3+ is significantly increased compared to non-IBC DN2 cells. (G) The percentage of CXCR3+ insulin-binding BND2 cells is increased, though not significantly, compared to insulin-binding DN2 cells in T1D donors. Statistical significance determined by paired Student’s t tests for D–G. *P < 0.05, **P < 0.01, ****P < 0.0001.
Figure 5.
Figure 5.
BND2 cells do not exhibit an anergic B cell phenotype, produce modest amounts of pro-inflammatory cytokines, and display features consistent with pre-ASCs. (A) BND2 and DN2 cells have higher basal levels of phosphorylated Syk, PLCy2, AKT compared to BND1 and MN cells, likely reflecting recent in vivo activation, both in T1D (n = 5) and HC (n = 5) donors. BND2 cells are still able to mount a signaling response similar to MN B cells after stimulation with anti-IgG F(ab′)2 H&L, suggesting they are not anergic. BND2 and DN2 cells have elevated levels of the inhibitory signaling molecule PTEN, which may also reflect recent in vivo activation. (B) BND2 cells produce increased levels of IL-10, IL-6, TNF-α, and IFN-γ compared with BND1 cells after 6 h in the presence of a protein transport inhibitor. Cytokine production by BND2 cells is similar to DN2 and memory (CD27+) B cells, with the exception that BND2 cells produce some IFN-γ, but not DN2 cells. (C) BND2 and DN2 cells have increased expression of the transcription factor XBP-1, which is associated with plasma cell differentiation. DN2 cells, but not BND2 cells, have increased expression of IRF4, another transcription factor for plasma cell differentiation. BND2 cells have similar levels of the transcription factor T-bet to DN2 cells, which is significantly elevated compared to BND1 cells. (D) BND2 cells display increased differentiation into ASCs compared to MN and BND1 cells, but not to the level of DN2 or memory B cells. B cells from T1D donors differentiate into more ASCs compared to HC donors. (E) The level of proliferation after in vitro culture for ELISpot assay was determined. BND1 cells undergo cell death, while BND2 cells were maintained or slightly proliferated. Dashed red line represents proliferation (above) or loss of cells (cell death). Data presented are from T1D (n = 5) and HC (n = 5) donors. Statistical significance determined by mixed-effects model. *P < 0.05, **P < 0.01, ***P < 0.001, ****P < 0.0001.
Figure 6.
Figure 6.
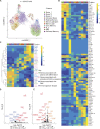
sc-RNA-seq reveals BND2 and DN2 cells share a similar transcriptome, consistent with pre-ASCs. (A) UMAP of B cell clusters identified using scRNA-seq. Naming of B cell clusters was based on varying levels of gene expression of markers associated with activation, naive B cells, memory B cells, and/or isotype. (B) Heatmap of top 10 DEGs for each B cell cluster identified in A. (C) Heatmap of handpicked genes of interest that are known to be associated with plasma cell differentiation, activation or inhibitory receptors, the DN2 B cell subset, and immunoglobulin isotype. Transcriptionally, BND2 cells are similar to the DN2 subset. (D) Volcano plot of DEGs that are significantly different between DN2 and BND2 cells. Blue dots indicate genes that are increased in DN2 cells, while red dots indicated genes that are increased in BND2 cells. Labels for a few hand-picked genes are included. (E) Volcano plot of DEGs that are significantly different between BND1 and BND2 cells. Red dots are genes increased in BND2 cells, while dark yellow dots are genes that are increased in BND1 cells. Data are from an HC donor.
Figure 7.
Figure 7.
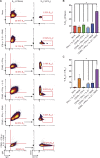
Differentiation of BND1 cells into BND2 cells is driven by a combination of CD40L, IFN-γ, IL-21, and R848. (A) Example cytograms of the gating strategy used to identify the percent of retained BND cells and the percent that differentiated into BND2 cells after stimulation with varying reagents for 4 d. BND1 cells were sorted from HC PBMC samples (n = 4) and stimulated with a combination of different reagents. (B) The frequency of BND1 cells that retained a BND phenotype (CD27, IgMlo, IgD+) after stimulation. (C) The frequency of BND1 cells that differentiated into BND2 cells after stimulation. BND2 cells were defined as CD19+ CD27 IgMlo, IgD+, CD21, CD11c+. Overall, using a combination of CD40L, IFN, IL-21, and R848 maintained the BND phenotype the best, and induced the most differentiation into BND2 cells after stimulation. Data presented are from HC (n = 3) donors, and samples were treated in triplicates. Statistical significance determined by mixed-effects model. *P < 0.05.
Figure S3.
Figure S3.
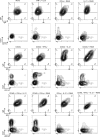
Cytograms of B cell phenotype of BND1 cells after stimulation with the indicated reagents after 5 d. The majority of BND1 (CD19+ CD27 IgMlo IgD+ CD21+ CD11c) cells revert to an MN B cell phenotype (CD19+ CD27 IgM+ IgD+) after stimulation. A combination of CD40L, IFN-γ, IL-21, and R848 provide the best signals to maintain a BND phenotype and drive differentiation of BND1 cells into BND2 (CD19+ CD27 IgMlo IgD+ CD21 CD11c+) cells.

References

    1. Bingley, P.J., Boulware D.C., Krischer J.P., Type G., and Type 1 Diabetes TrialNet Study Group . 2016. The implications of autoantibodies to a single islet antigen in relatives with normal glucose tolerance: Development of other autoantibodies and progression to type 1 diabetes. Diabetologia. 59:542–549. 10.1007/s00125-015-3830-2 - DOI - PMC - PubMed
    1. Calderon, D., Nguyen M.L.T., Mezger A., Kathiria A., Müller F., Nguyen V., Lescano N., Wu B., Trombetta J., Ribado J.V., et al. . 2019. Landscape of stimulation-responsive chromatin across diverse human immune cells. Nat. Genet. 51:1494–1505. 10.1038/s41588-019-0505-9 - DOI - PMC - PubMed
    1. Cambier, J.C., Gauld S.B., Merrell K.T., and Vilen B.J.. 2007. B-Cell anergy: From transgenic models to naturally occurring anergic B cells? Nat. Rev. Immunol. 7:633–643. 10.1038/nri2133 - DOI - PMC - PubMed
    1. Cowan, G.J.M., Miles K., Capitani L., Giguere S.S.B., Johnsson H., Goodyear C., McInnes I.B., Breusch S., Gray D., and Gray M.. 2020. In human autoimmunity, a substantial component of the B cell repertoire consists of polyclonal, barely mutated IgG+ve B cells. Front. Immunol. 11:395. 10.3389/fimmu.2020.00395 - DOI - PMC - PubMed
    1. Cyster, J.G., and Goodnow C.C.. 1995. Antigen-induced exclusion from follicles and anergy are separate and complementary processes that influence peripheral B cell fate. Immunity. 3:691–701. 10.1016/1074-7613(95)90059-4 - DOI - PubMed

Publication types