. 2023 Jul 1;80(7):693-701.
doi: 10.1001/jamaneurol.2023.1135.

Population-Based Estimates for the Prevalence of Multiple Sclerosis in the United States by Race, Ethnicity, Age, Sex, and Geographic Region

Affiliations

Population-Based Estimates for the Prevalence of Multiple Sclerosis in the United States by Race, Ethnicity, Age, Sex, and Geographic Region

Michael Hittle et al. JAMA Neurol. .

Abstract

Importance: Racial, ethnic, and geographic differences in multiple sclerosis (MS) are important factors to assess when determining the disease burden and allocating health care resources.

Objective: To calculate the US prevalence of MS in Hispanic, non-Hispanic Black (hereafter referred to as Black), and non-Hispanic White individuals (hereafter referred to as White) stratified by age, sex, and region.

Design, setting, and participants: A validated algorithm was applied to private, military, and public (Medicaid and Medicare) administrative health claims data sets to identify adult cases of MS between 2008 and 2010. Data analysis took place between 2019 and 2022. The 3-year cumulative prevalence overall was determined in each data set and stratified by age, sex, race, ethnicity, and geography. The insurance pools included 96 million persons from 2008 to 2010. Insurance and stratum-specific estimates were applied to the 2010 US Census data and the findings combined to calculate the 2010 prevalence of MS cumulated over 10 years. No exclusions were made if a person met the algorithm criteria.

Main outcomes and measurements: Prevalence of MS per 100 000 US adults stratified by demographic group and geography. The 95% CIs were approximated using a binomial distribution.

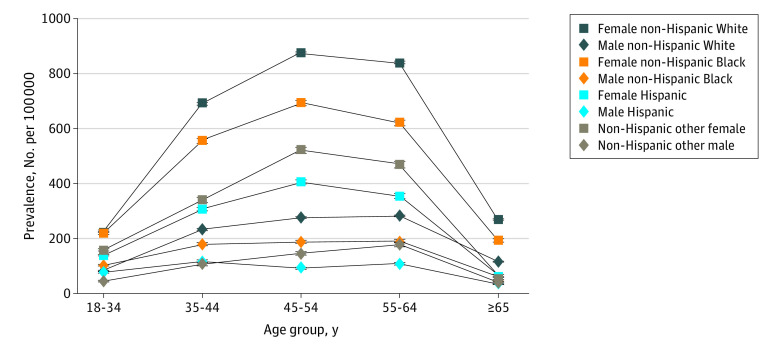
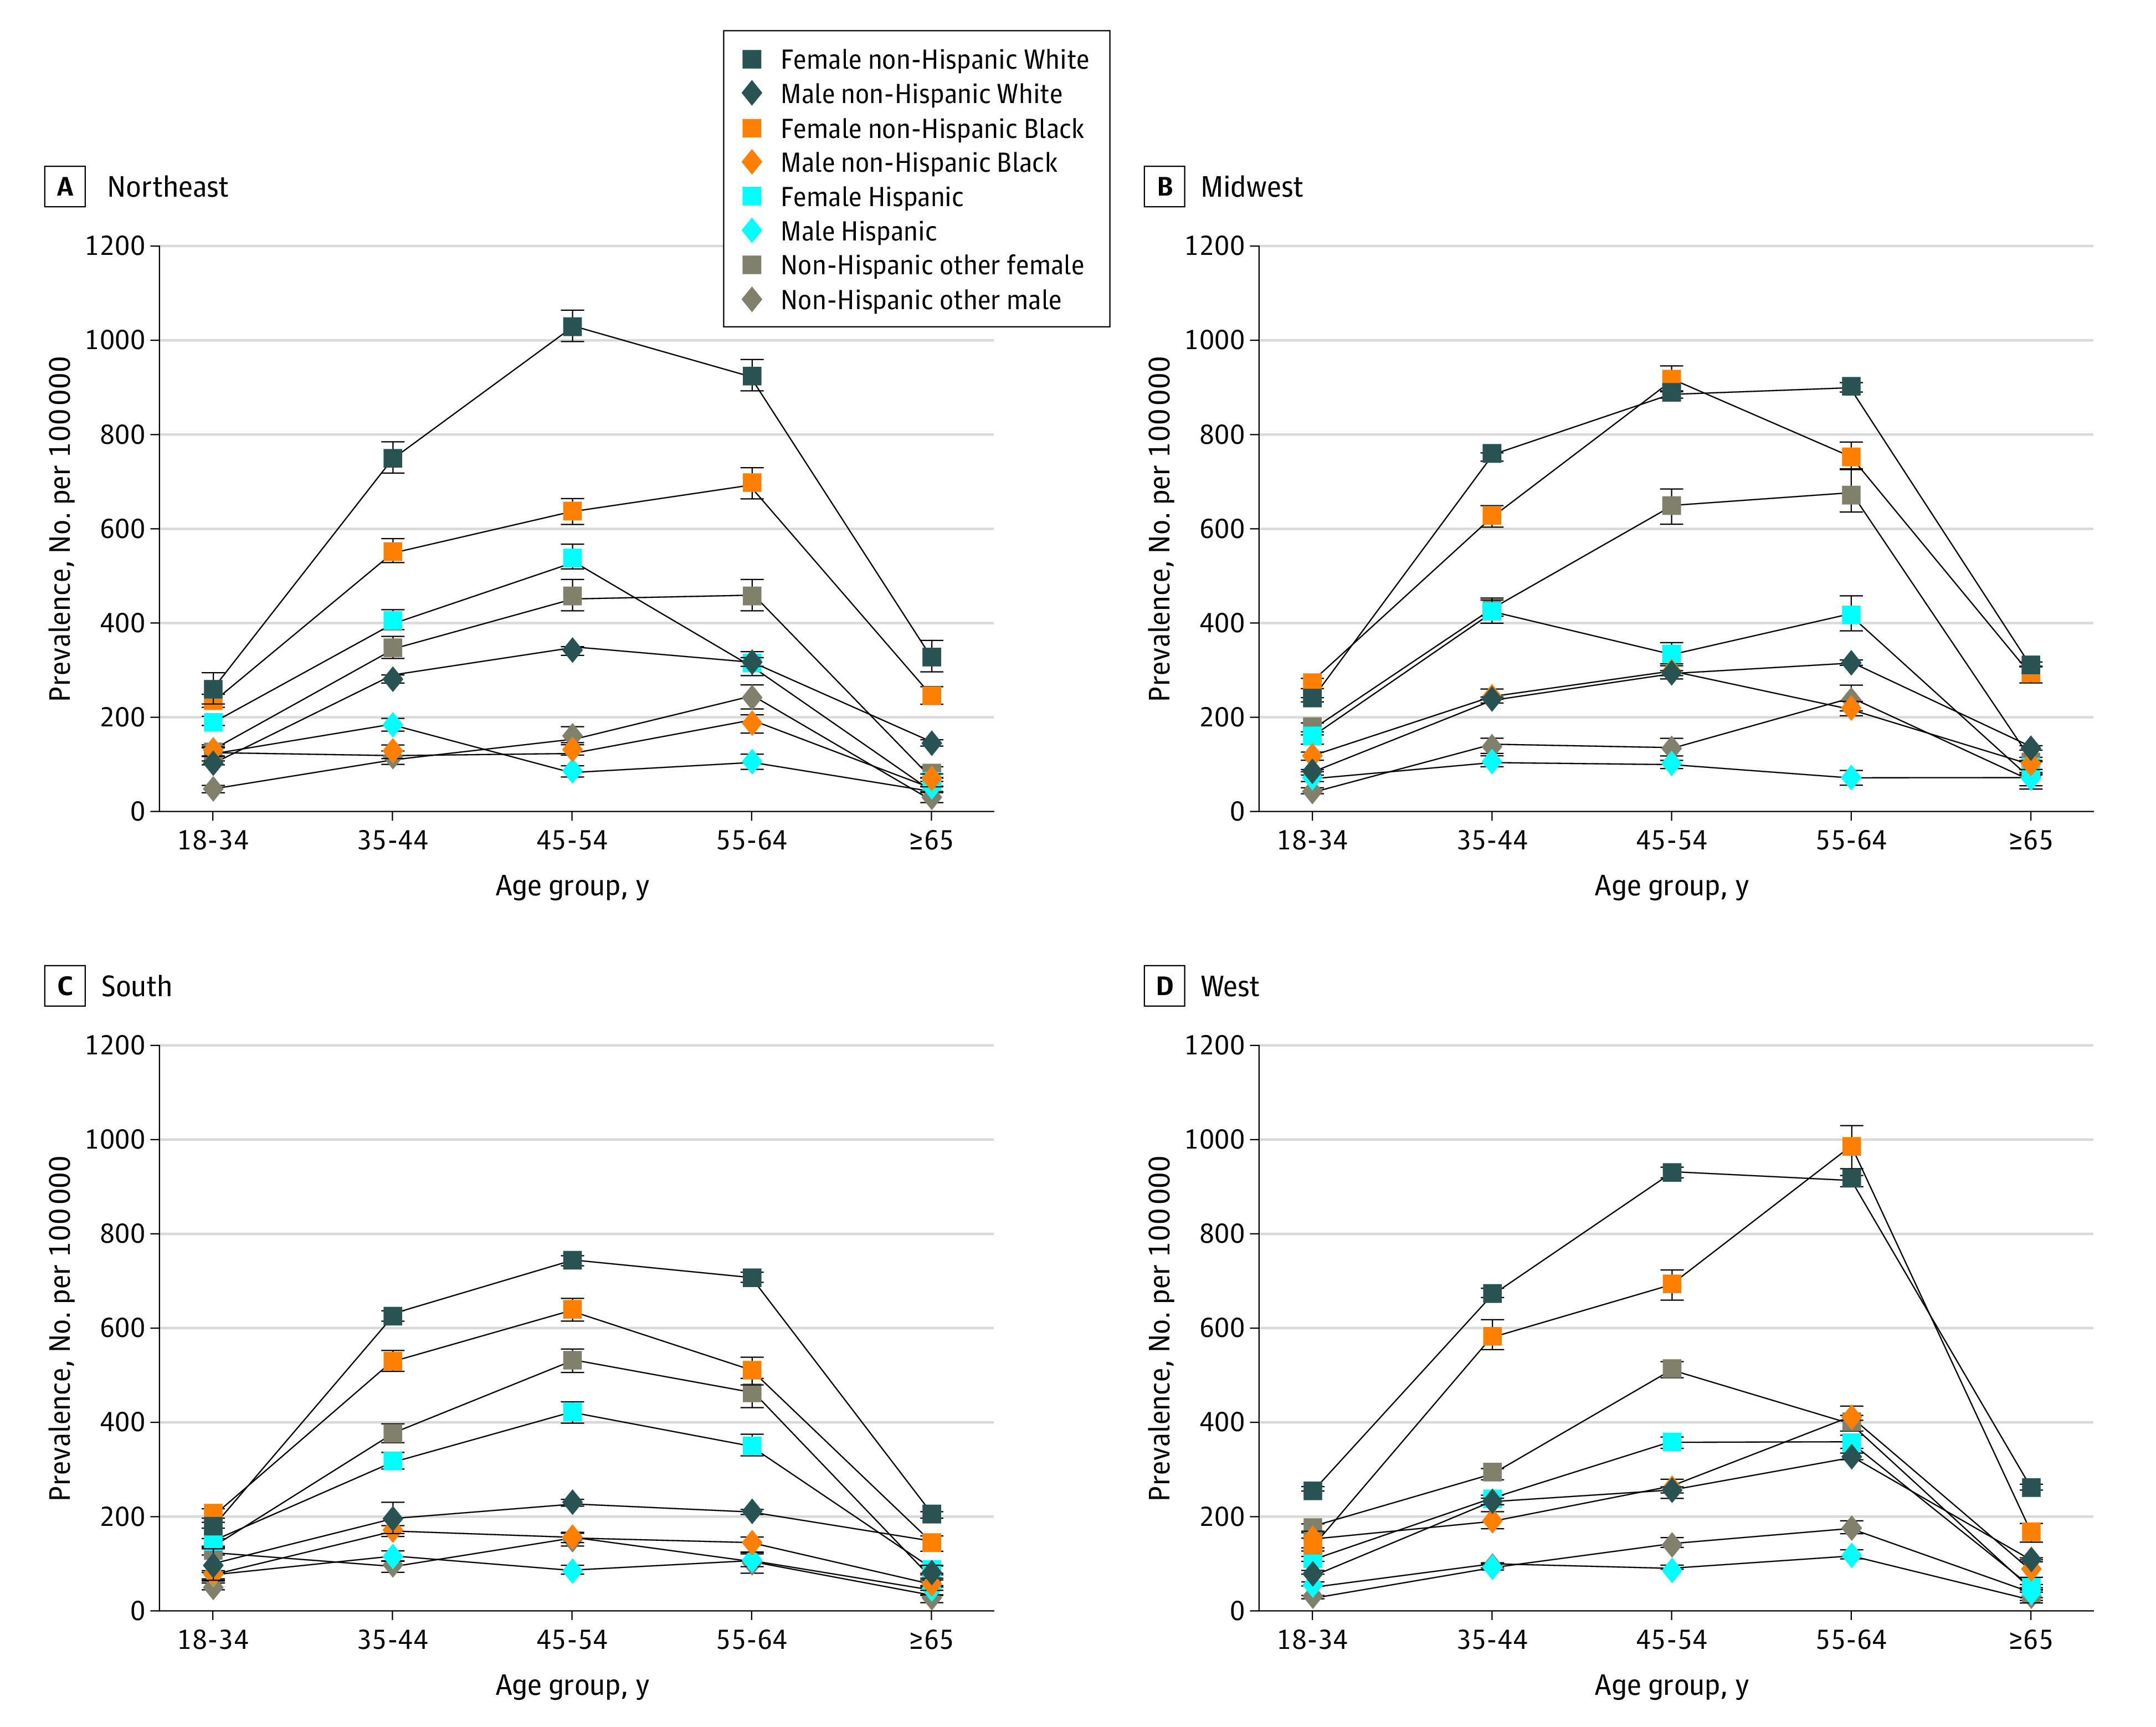
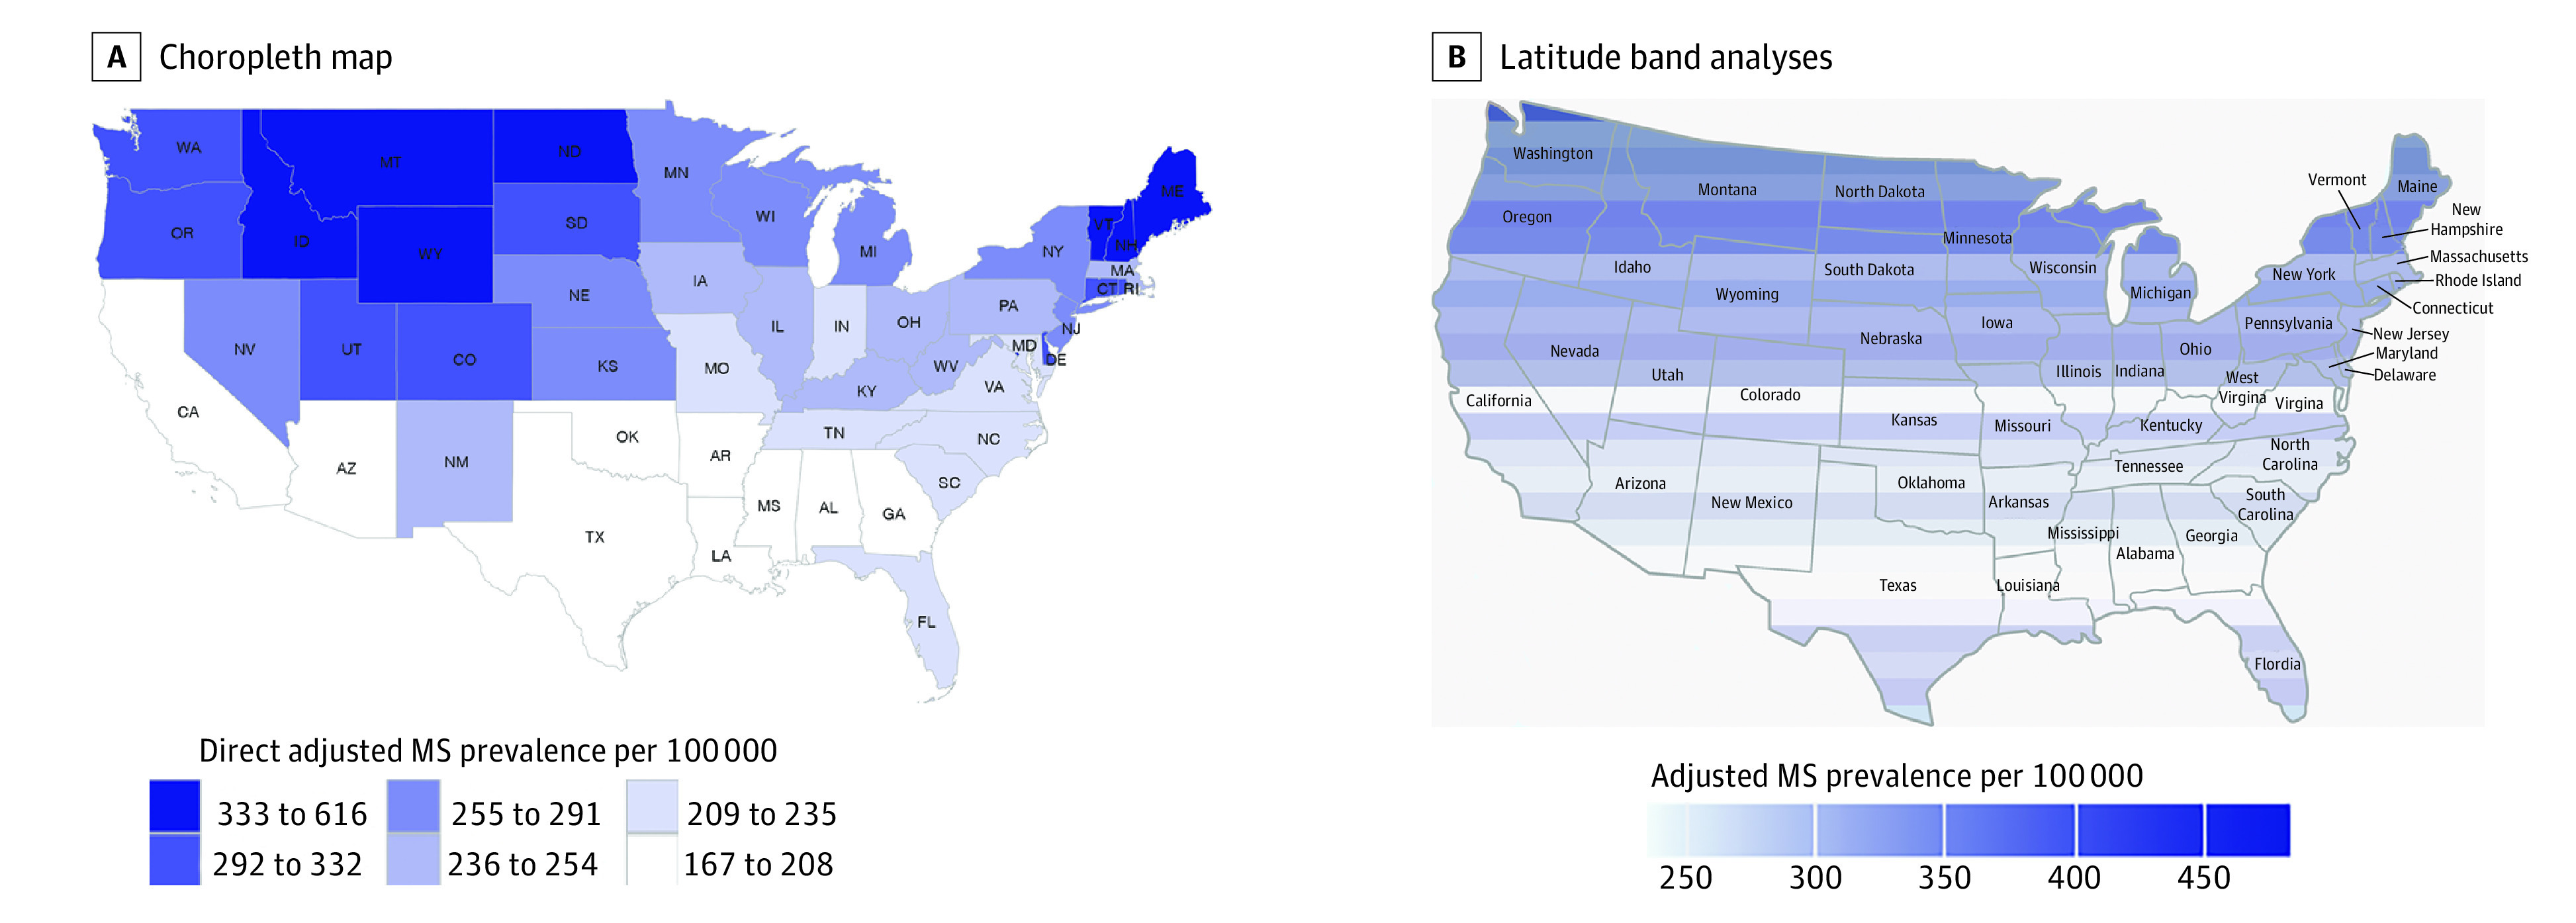
Results: A total of 744 781 persons 18 years and older were identified with MS with 564 426 cases (76%) in females and 180 355 (24%) in males. The median age group was 45 to 54 years, which included 229 216 individuals (31%), with 101 271 aged 18 to 24 years (14%), 158 997 aged 35 to 44 years (21%), 186 758 aged 55 to 64 years (25%), and 68 539 individuals (9%) who were 65 years or older. White individuals were the largest group, comprising 577 725 cases (77%), with 80 276 Black individuals (10%), 53 456 Hispanic individuals (7%), and 33 324 individuals (4%) in the non-Hispanic other category. The estimated 2010 prevalence of MS per 100 000 US adults cumulated over 10 years was 161.2 (95% CI, 159.8-162.5) for Hispanic individuals (regardless of race), 298.4 (95% CI, 296.4-300.5) for Black individuals, 374.8 (95% CI, 373.8-375.8) for White individuals, and 197.7 (95% CI, 195.6-199.9) for individuals from non-Hispanic other racial and ethnic groups. During the same time period, the female to male ratio was 2.9 overall. Age stratification in each of the racial and ethnic groups revealed the highest prevalence of MS in the 45- to 64-year-old age group, regardless of racial and ethnic classification. With each degree of latitude, MS prevalence increased by 16.3 cases per 100 000 (95% CI, 12.7-19.8; P < .001) in the unadjusted prevalence estimates, and 11.7 cases per 100 000 (95% CI, 7.4-16.1; P < .001) in the direct adjusted estimates. The association of latitude with prevalence was strongest in women, Black individuals, and older individuals.

Conclusions and relevance: This study found that White individuals had the highest MS prevalence followed by Black individuals, individuals from other non-Hispanic racial and ethnic groups, and Hispanic individuals. Inconsistent racial and ethnic classifications created heterogeneity within groups. In the United States, MS affects diverse racial and ethnic groups. Prevalence of MS increases significantly and nonuniformly with latitude in the United States, even when adjusted for race, ethnicity, age, and sex. These findings are important for clinicians, researchers, and policy makers.


Conflict of interest statement

Conflict of Interest Disclosures: Mr Hittle reported grants from the National Institutes of Health (NIH) and personal fees from Institute for Clinical Research during the conduct of the study. Dr Culpepper reported grants from National Multiple Sclerosis Society (NMSS) during the conduct of the study, support from the Veterans Health Administration MS Center of Excellence, and being a member of the NMSS Health Care Delivery and Policy Research study section. Dr Langer-Gould reported being principal investigator for 2 industry-sponsored phase 3 clinical trials (Biogen Idec, Hoffmann-LaRoche) and 1 industry-sponsored observation study (Biogen Idec) and grant support from the NIH, National Institute of Neurological Disorders and Stroke (NINDS), Patient-Centered Outcomes Research Institute, and NMSS. Dr Marrie reported being co-investigator on trials sponsored by Roche and Biogen outside the submitted work; support from the Waugh Family Chair in Multiple Sclerosis; research funding from Canadian Institutes of Health Research, Research Manitoba, Multiple Sclerosis Society of Canada, Multiple Sclerosis Scientific Foundation, Consortium of MS Centers, and NMSS; and serving on the editorial board of Neurology. Dr Cutter reported being a member of data and safety monitoring boards for Applied Therapeutics, AI Therapeutics, AstraZeneca, Avexis Pharmaceuticals, AMO Pharmaceuticals, Apotek, Biolinerx, Brainstorm Cell Therapeutics, Bristol Myers Squibb/Celgene, CSL Behring, Galmed Pharmaceuticals, Green Valley Pharma, Horizon Pharmaceuticals, Immunic, Karuna Therapeutics, Mapi Pharmaceuticals, Modigenetech/Prolor, Merck, Merck/Pfizer, Mitsubishi Tanabe Pharma Holdings, Opko Biologics, Prothena Biosciences, Novartis, Regeneron, Neurim, Sanofi-Aventis, Reata Pharmaceuticals, Receptos/Celgene, Teva Pharmaceuticals, National Heart, Lung, and Blood Institute (protocol review committee), Eunice Kennedy Shriver National Institute of Child Health and Human Development (Obstetric-Fetal Pharmacology Research Center oversight committee), University of Texas Southwestern, University of Pennsylvania, and Visioneering Technologies; being a member of consulting or advisory boards for Atara Biotherapeutics, Argenix, Bioeq, Consortium of MS Centers (grant), Genzyme, Genentech, Innate Therapeutics, Klein-Buendel Incorporated, Medimmune, Medday, Novartis, Opexa Therapeutics, Roche, Savara, Somahlution, Teva Pharmaceuticals, Transparency Life Sciences, and TG Therapeutics; receiving personal fees from Alexion, Antisense Therapeutics, Biogen, Clinical Trial Solutions, Entelexo Biotherapeutics, Genzyme, Genentech, GW Pharmaceuticals, Immunic, Immunosis, Klein-Buendel Incorporated, Merck/Serono, Novartis, Perception Neurosciences, Protalix Biotherapeutics, Regeneron, Roche, and SAB Biotherapeutics; and receiving personal fees from Pythagoras (company owned for consulting) outside the submitted work. Dr Kaye reported funding from the Agency for Toxic Substances and Disease Registry, NMSS, and Association for the Accreditation of Human Research Protection Programs. Dr Wagner reported funding from the Agency for Toxic Substances and Disease Registry and NMSS. Dr LaRocca reported being previously employed full-time by the NMSS. Dr Nelson reported grants from the Centers for Disease Control and Prevention, NIH, and NMSS; contracts from the Agency for Toxic Substances and Diseases Registry; compensation for serving as a consultant to Acumen; and being on a data monitoring committee for Neuropace. Dr Wallin reported serving on data safety monitoring boards for the NIH NINDS; being a member of the NMSS Health Care Delivery and Policy Research study section; and receiving funding support from the NMSS and Department of Veterans Affairs Merit Review Research Program. No other disclosures were reported.

Figures

Figure 1.
Figure 1.. 2010 Prevalence of Multiple Sclerosis per 100 000 Adults Cumulated Over 10 Years in the United States by Age, Sex, Race, and Ethnicity
Figure 2.
Figure 2.. 2010 Prevalence of Multiple Sclerosis per 100 000 Adults Cumulated Over 10 Years in the United States by Age, Sex, Race, Ethnicity, and US Geographic Census Region: Northeast (Region 1), Midwest (Region 2), South (Region 3), and West (Region 4)
Figure 3.
Figure 3.. Maps of Direct Age-, Sex-, Race-, and Ethnicity-Adjusted Prevalence of Multiple Sclerosis (MS) per 100 000 Cumulated Over 10 Years by Latitude in the Contiguous United States, 2008-2010
The choropleth map represents state-aggregated analyses. The latitude band analyses used Optum Clinformatics Data Mart data only.

Comment in

References

    1. Wallin MT, Culpepper WJ, Campbell JD, et al. ; US Multiple Sclerosis Prevalence Workgroup . The prevalence of MS in the United States: a population-based estimate using health claims data. Neurology. 2019;92(10):e1029-e1040. doi: 10.1212/WNL.0000000000007035 - DOI - PMC - PubMed
    1. Bjornevik K, Cortese M, Healy BC, et al. Longitudinal analysis reveals high prevalence of Epstein-Barr virus associated with multiple sclerosis. Science. 2022;375(6578):296-301. doi: 10.1126/science.abj8222 - DOI - PubMed
    1. Lanz TV, Brewer RC, Ho PP, et al. Clonally expanded B cells in multiple sclerosis bind EBV EBNA1 and GlialCAM. Nature. 2022;603(7900):321-327. doi: 10.1038/s41586-022-04432-7 - DOI - PMC - PubMed
    1. Buron MD, Chalmer TA, Sellebjerg F, et al. Initial high-efficacy disease-modifying therapy in multiple sclerosis: a nationwide cohort study. Neurology. 2020;95(8):e1041-e1051. doi: 10.1212/WNL.0000000000010135 - DOI - PubMed
    1. Frey WA. Diversity Explosion: How New Racial Demographics Are Remaking America. Brookings Institution Press; 2018:1-20.

Publication types