. 2023 May 24;43(21):3876-3894.
doi: 10.1523/JNEUROSCI.2002-22.2023. Epub 2023 Apr 25.

Human-Like Modulation Sensitivity Emerging through Optimization to Natural Sound Recognition

Affiliations

Human-Like Modulation Sensitivity Emerging through Optimization to Natural Sound Recognition

Takuya Koumura et al. J Neurosci. .

Abstract

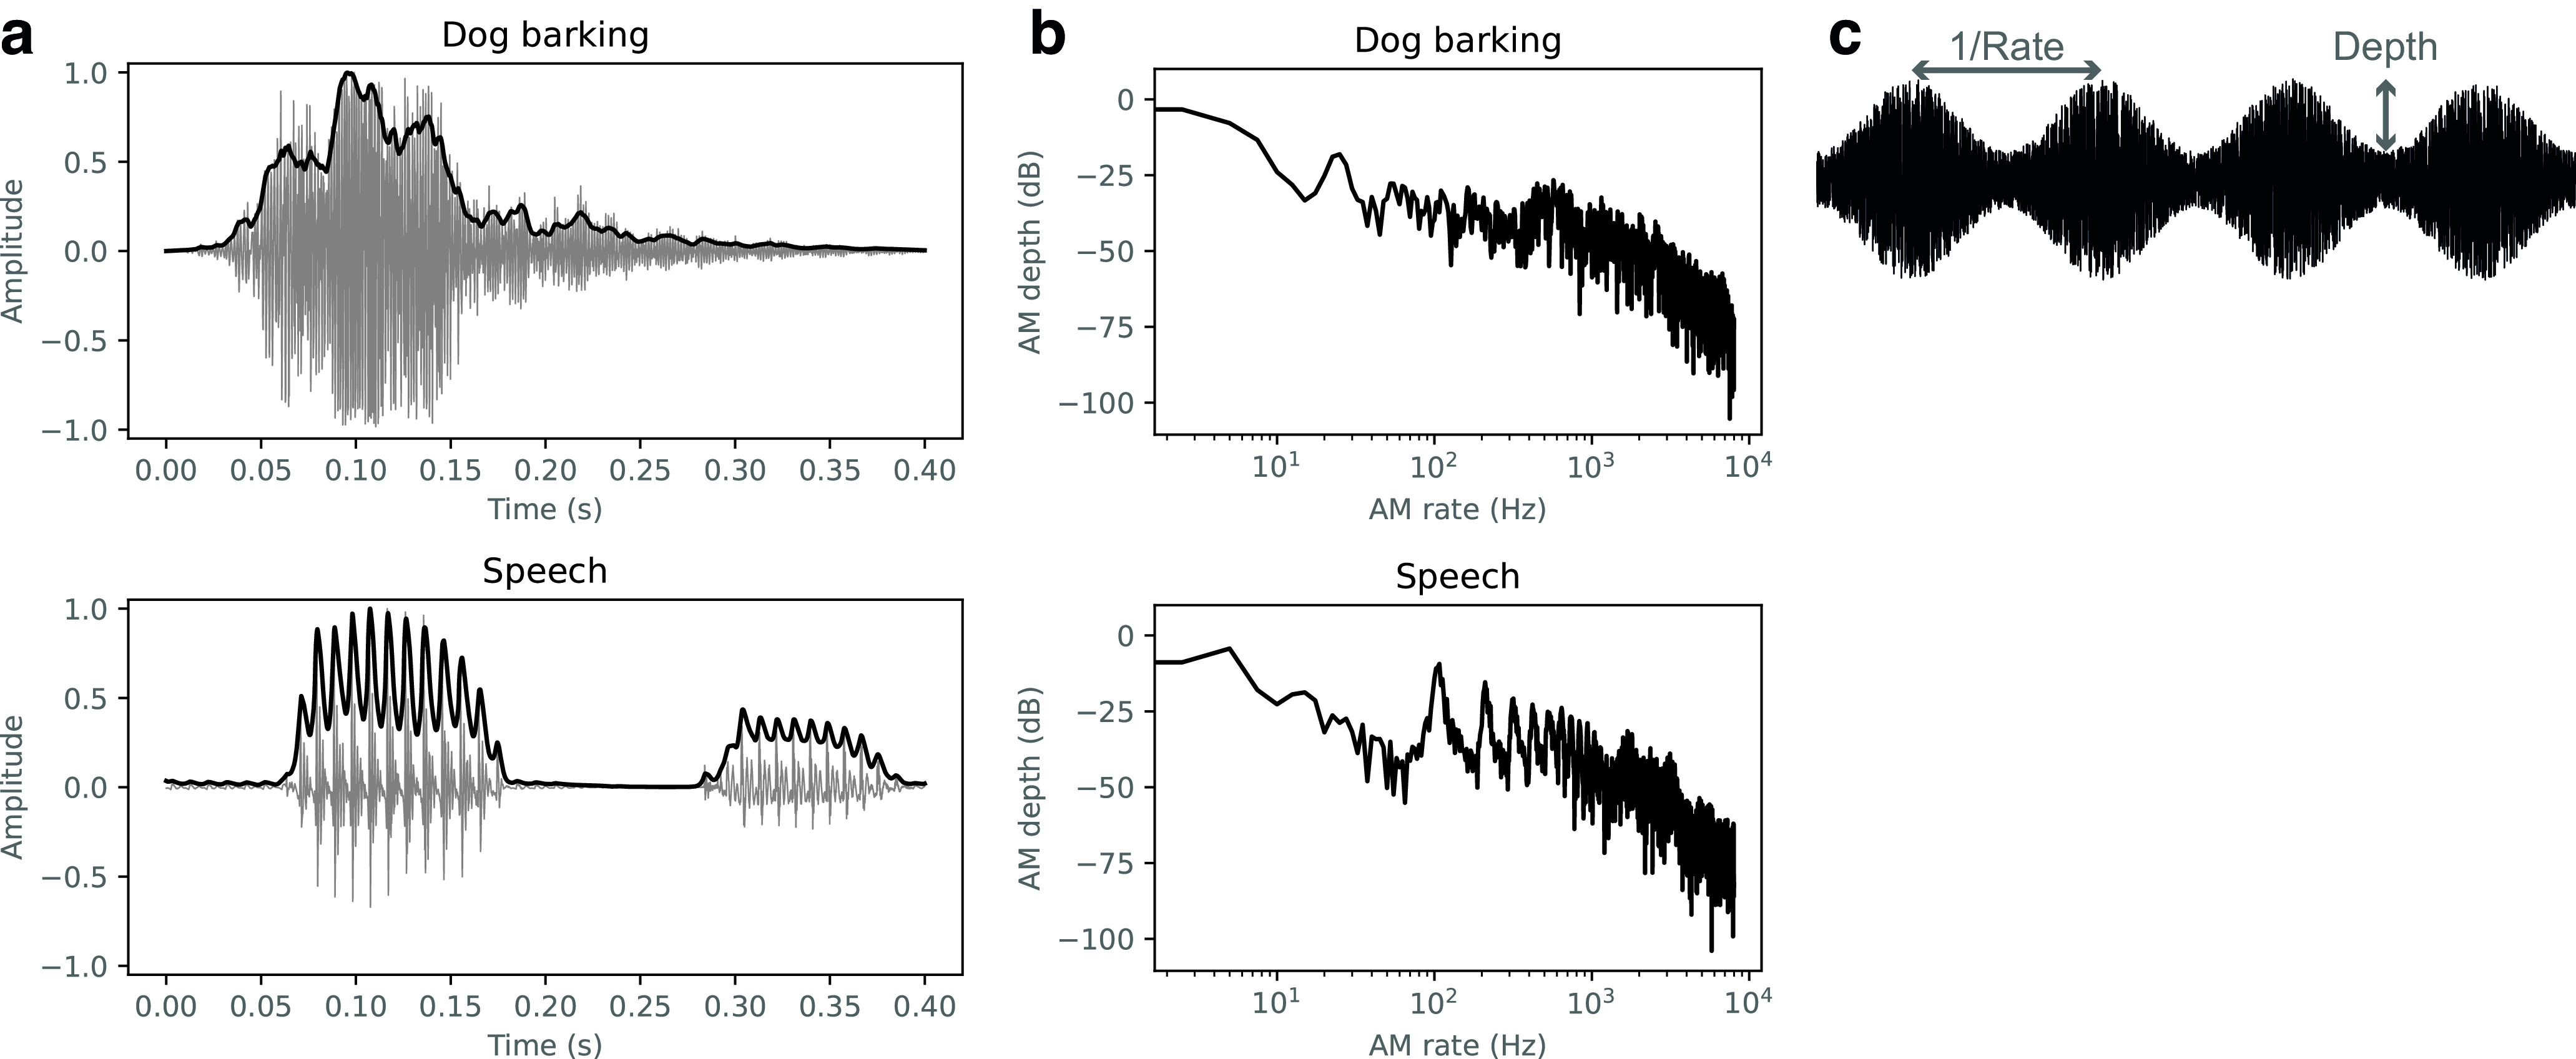
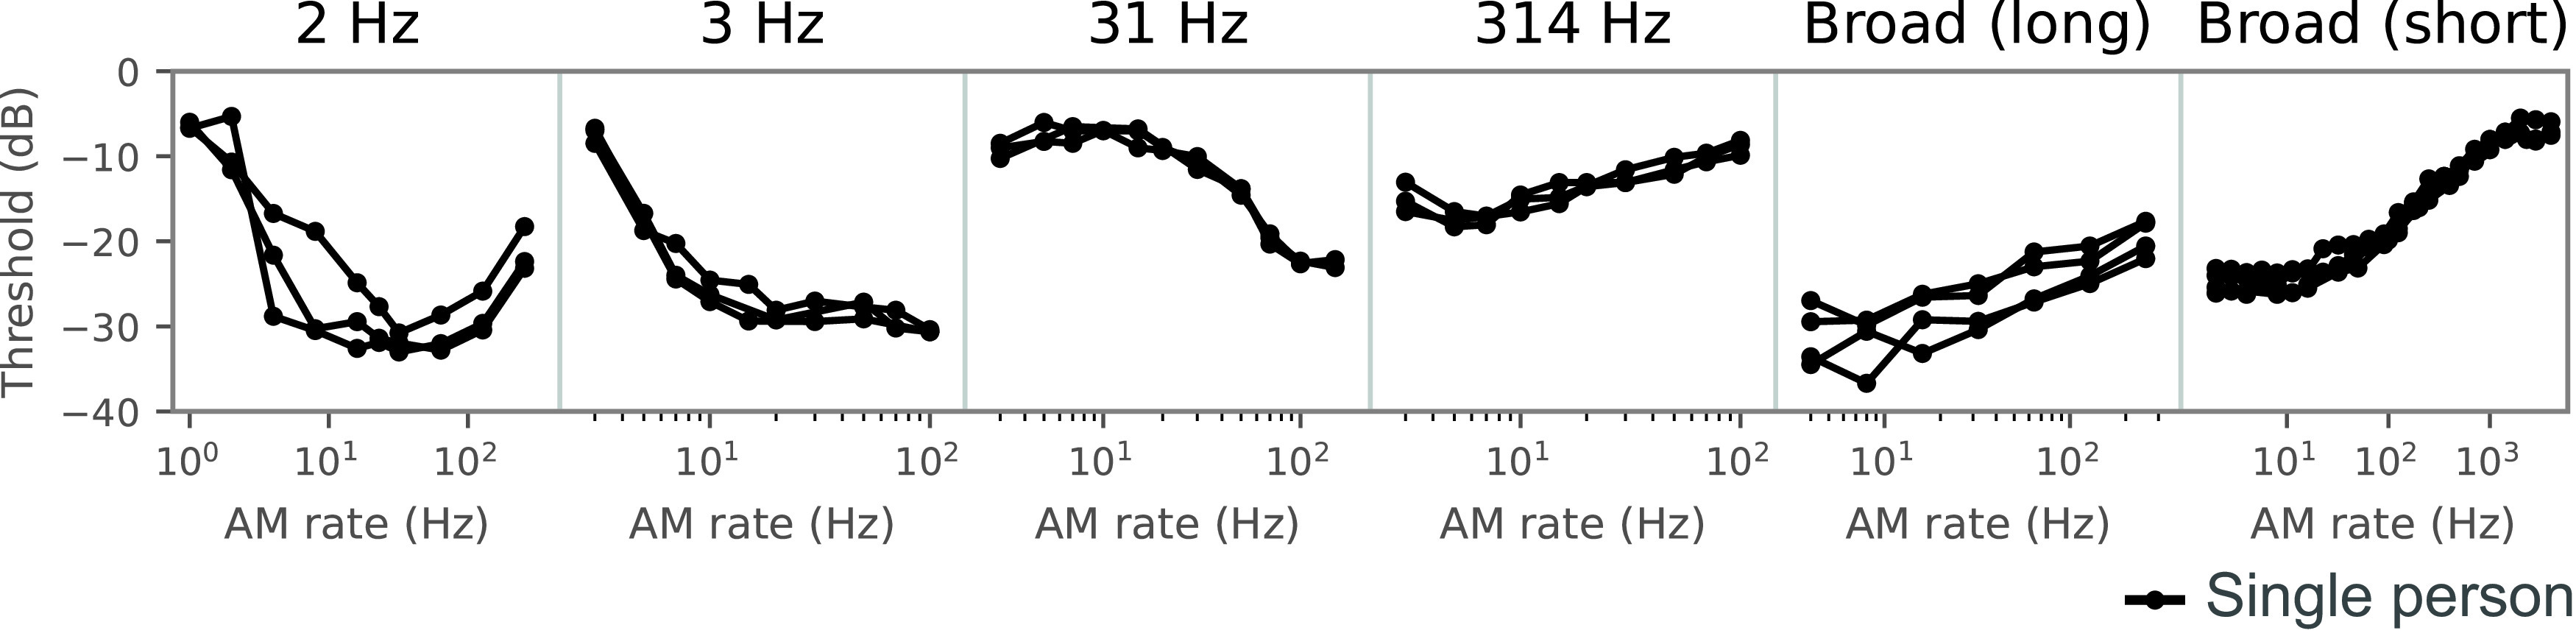
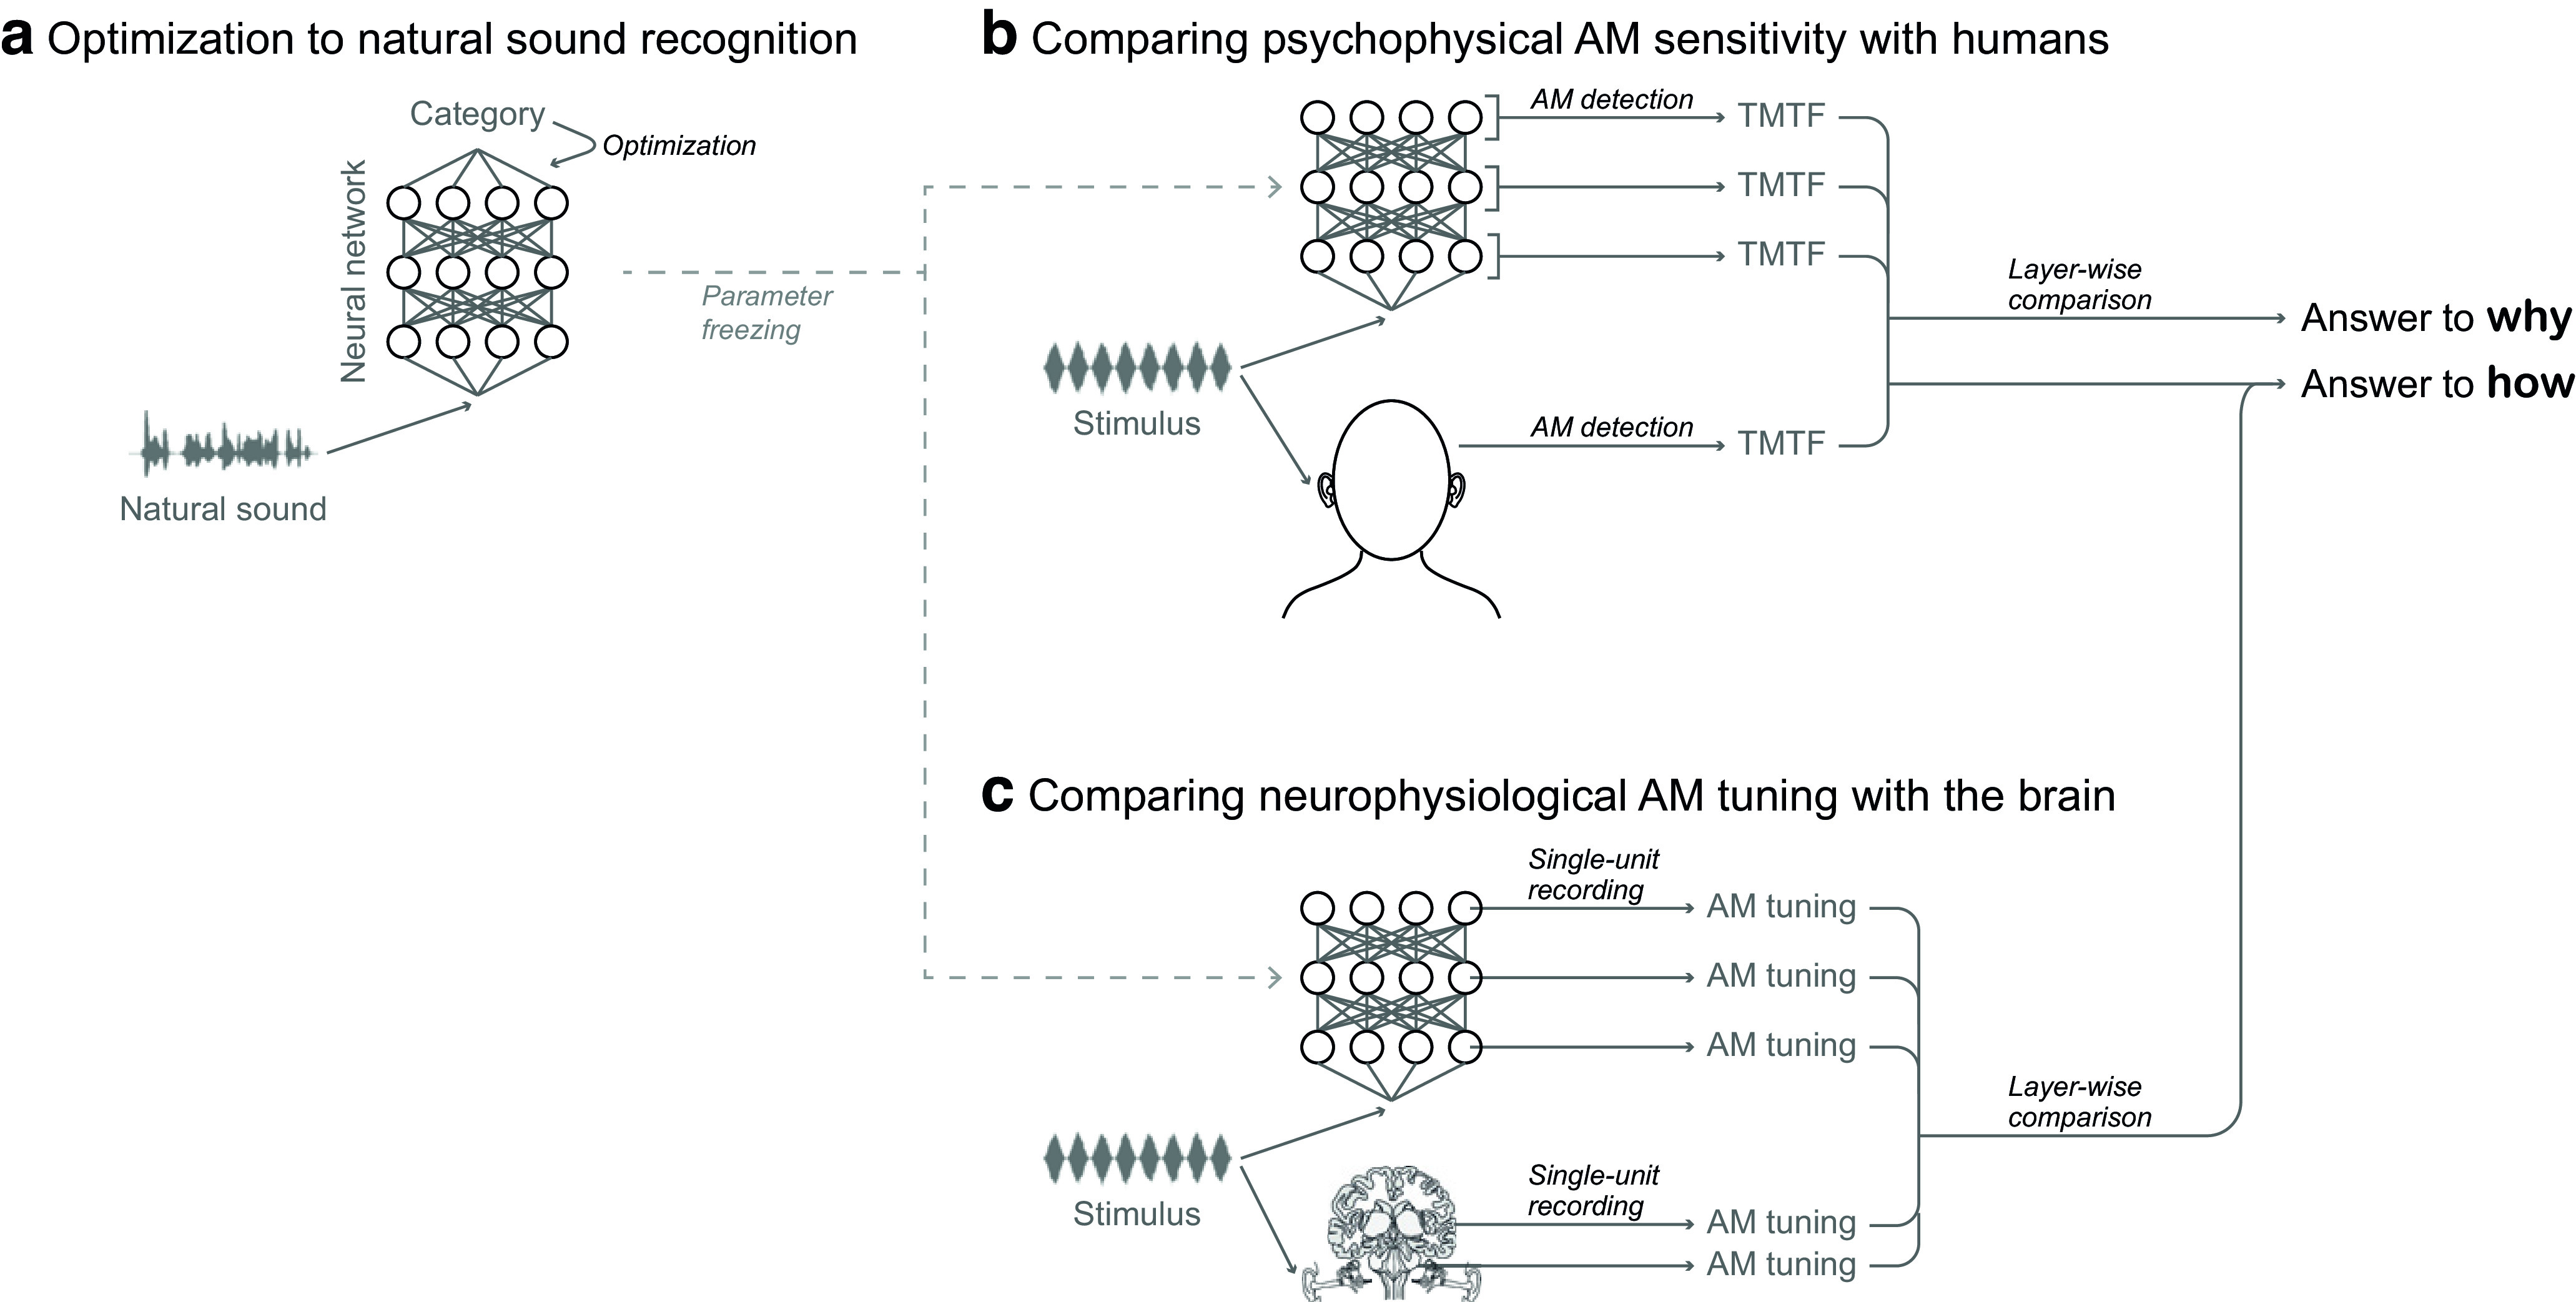
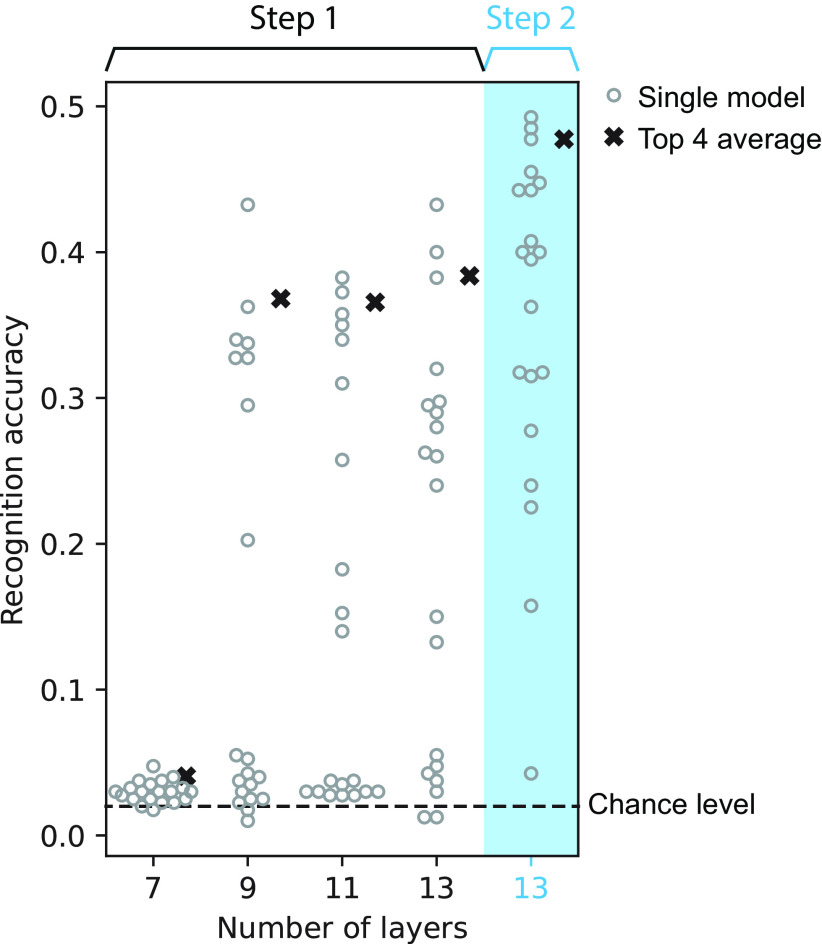
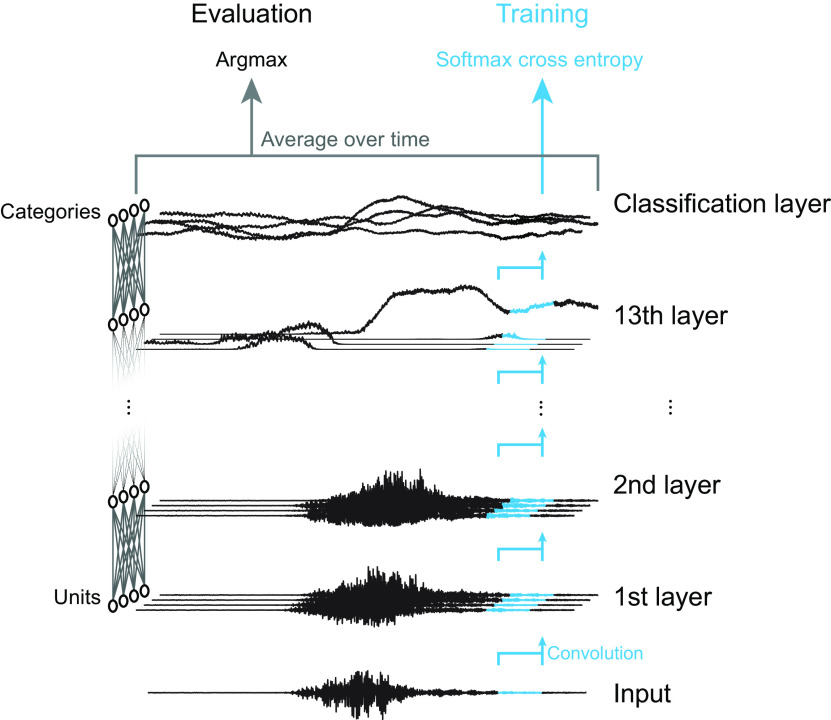
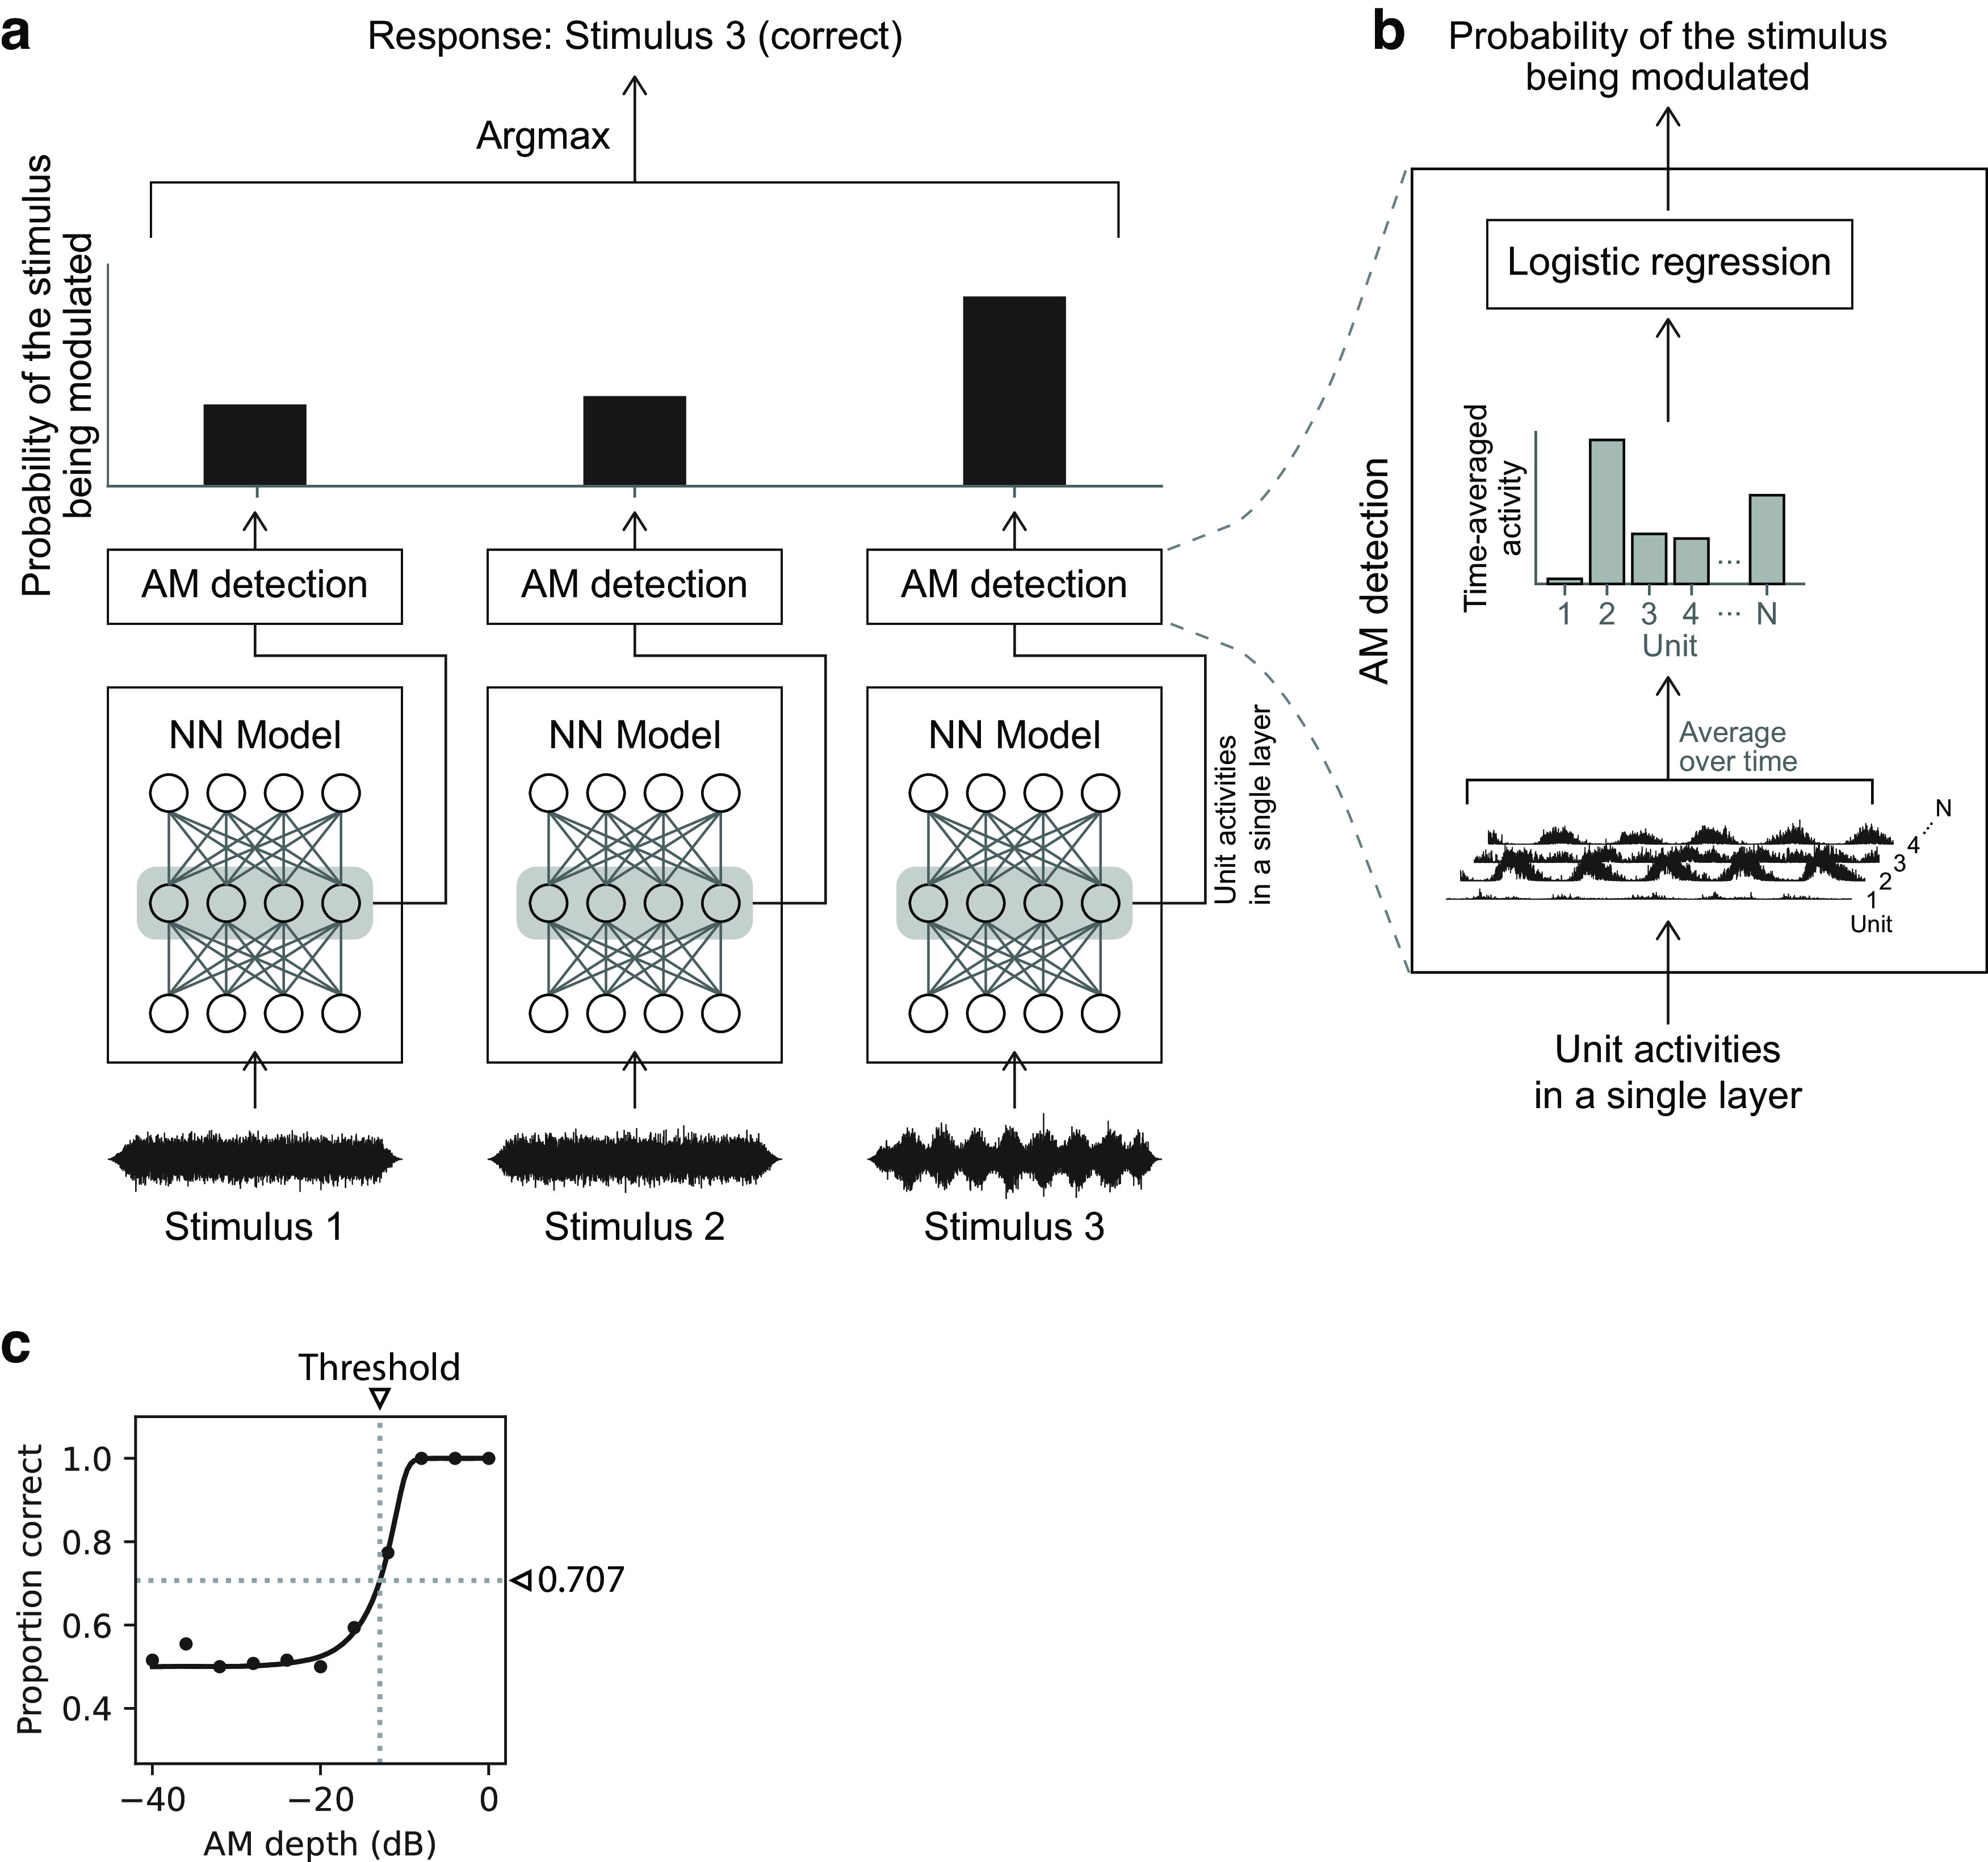
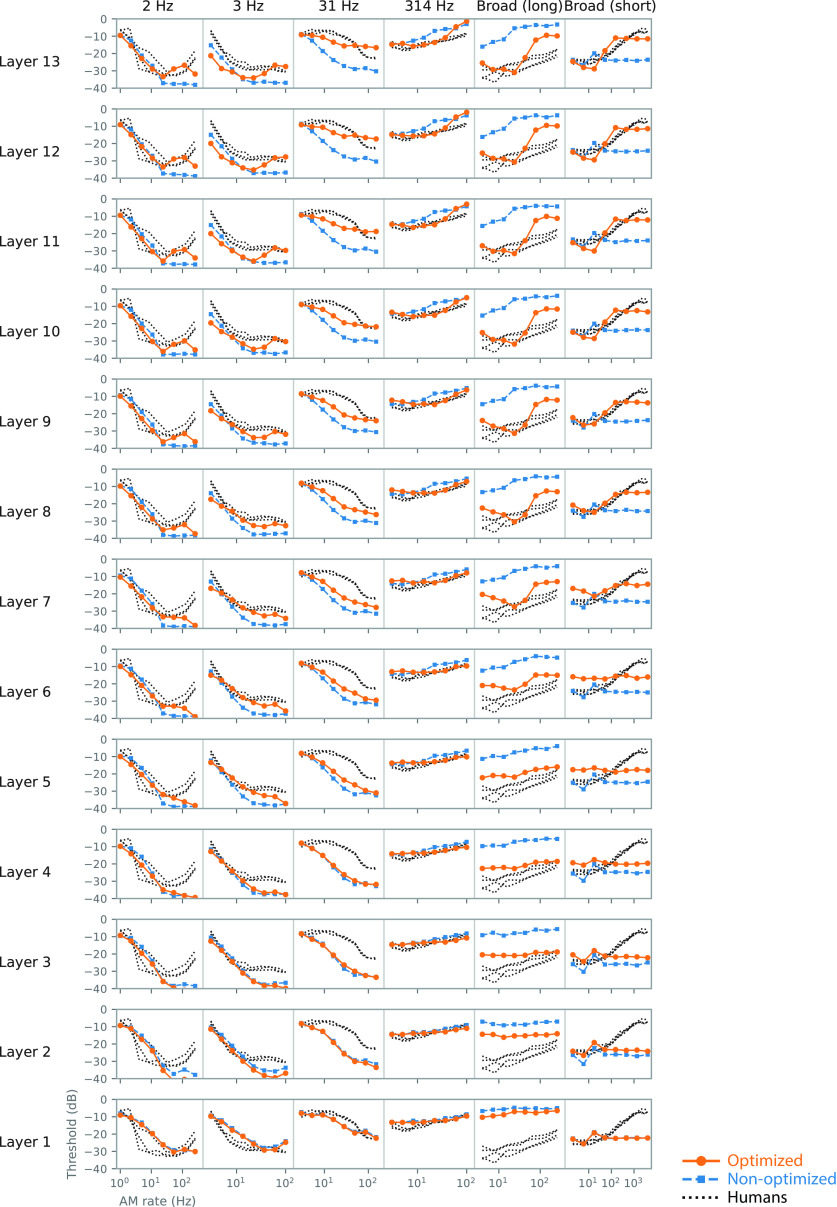
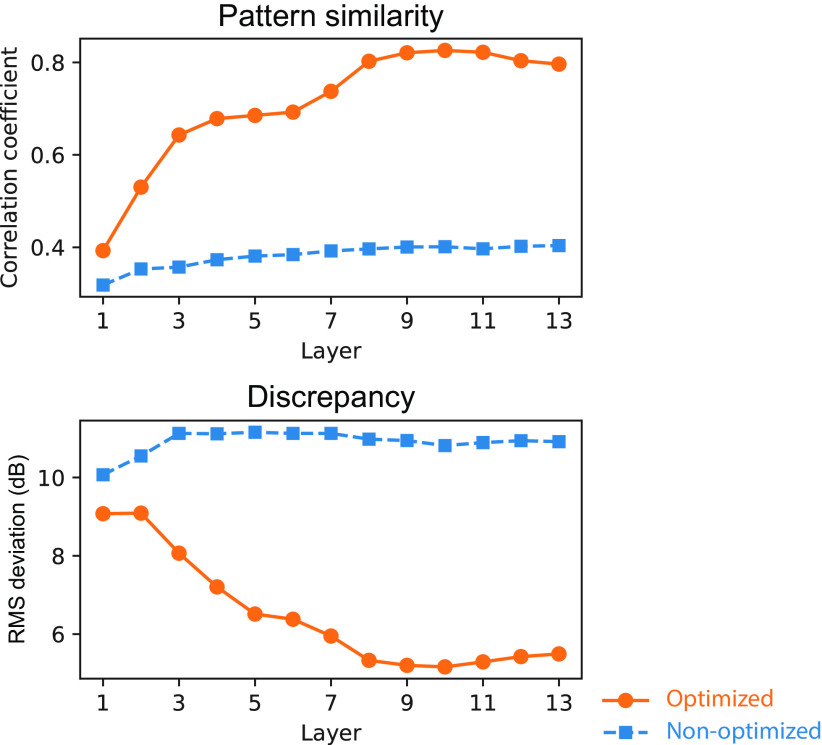
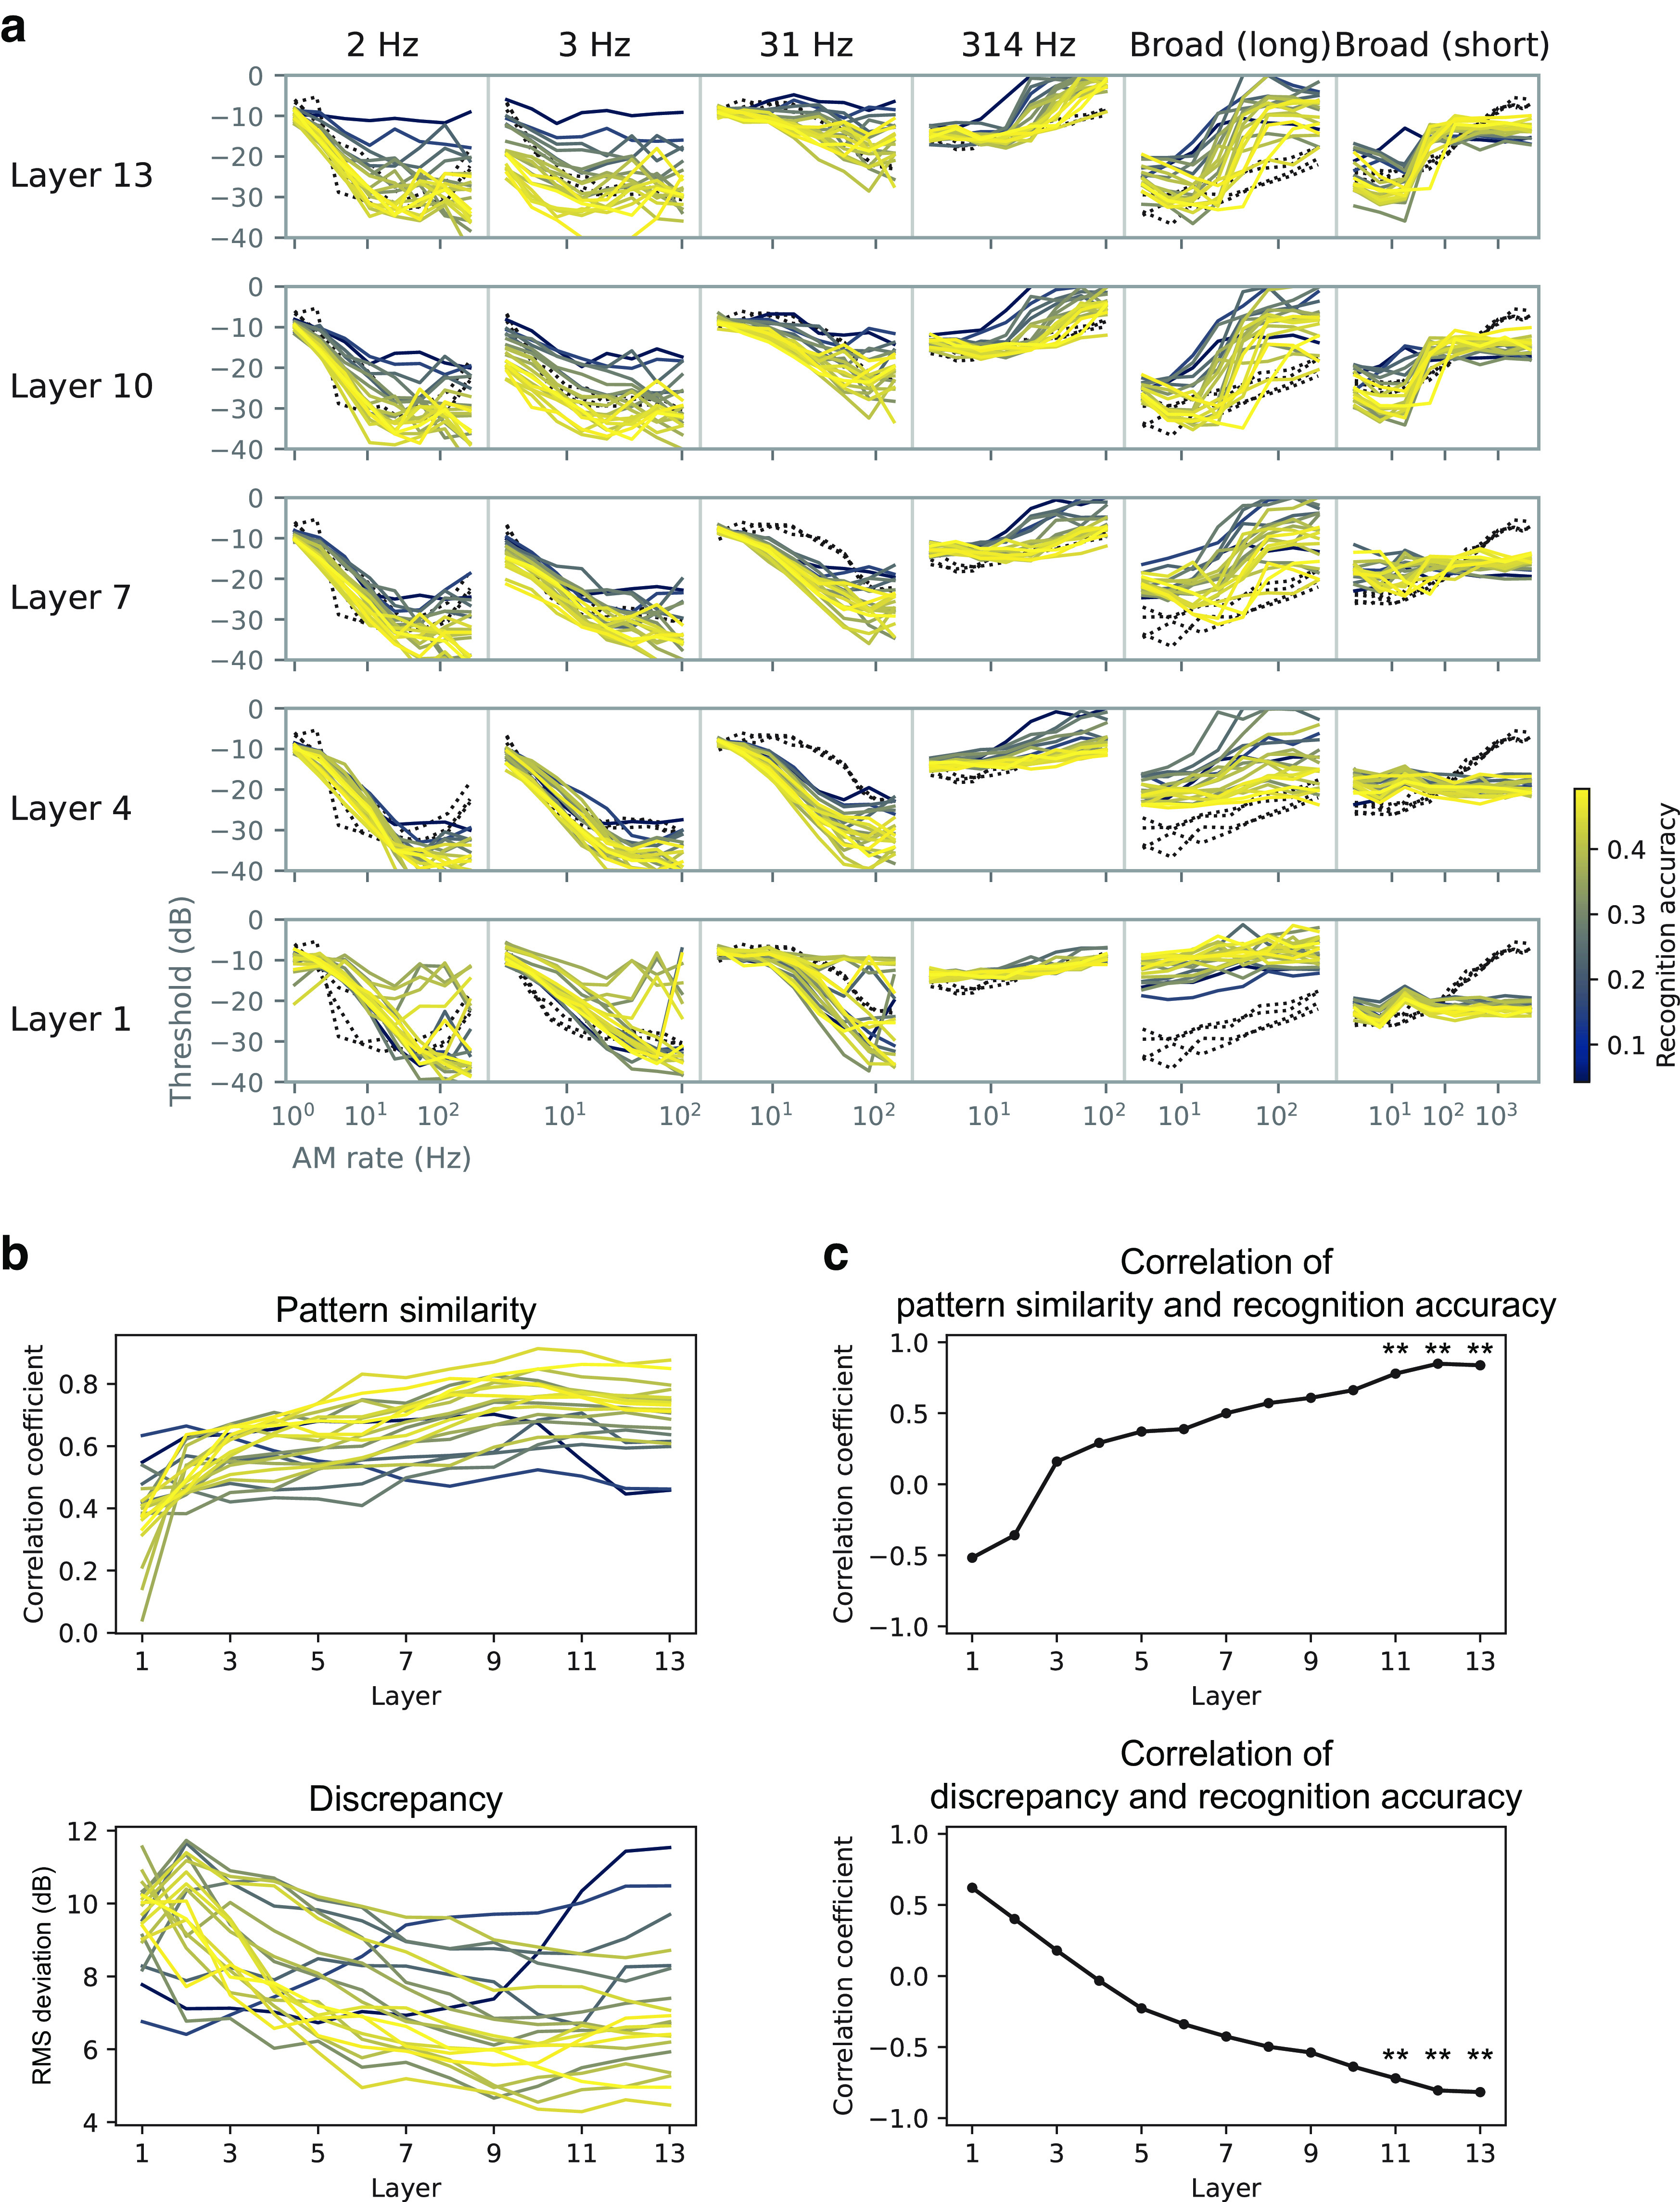
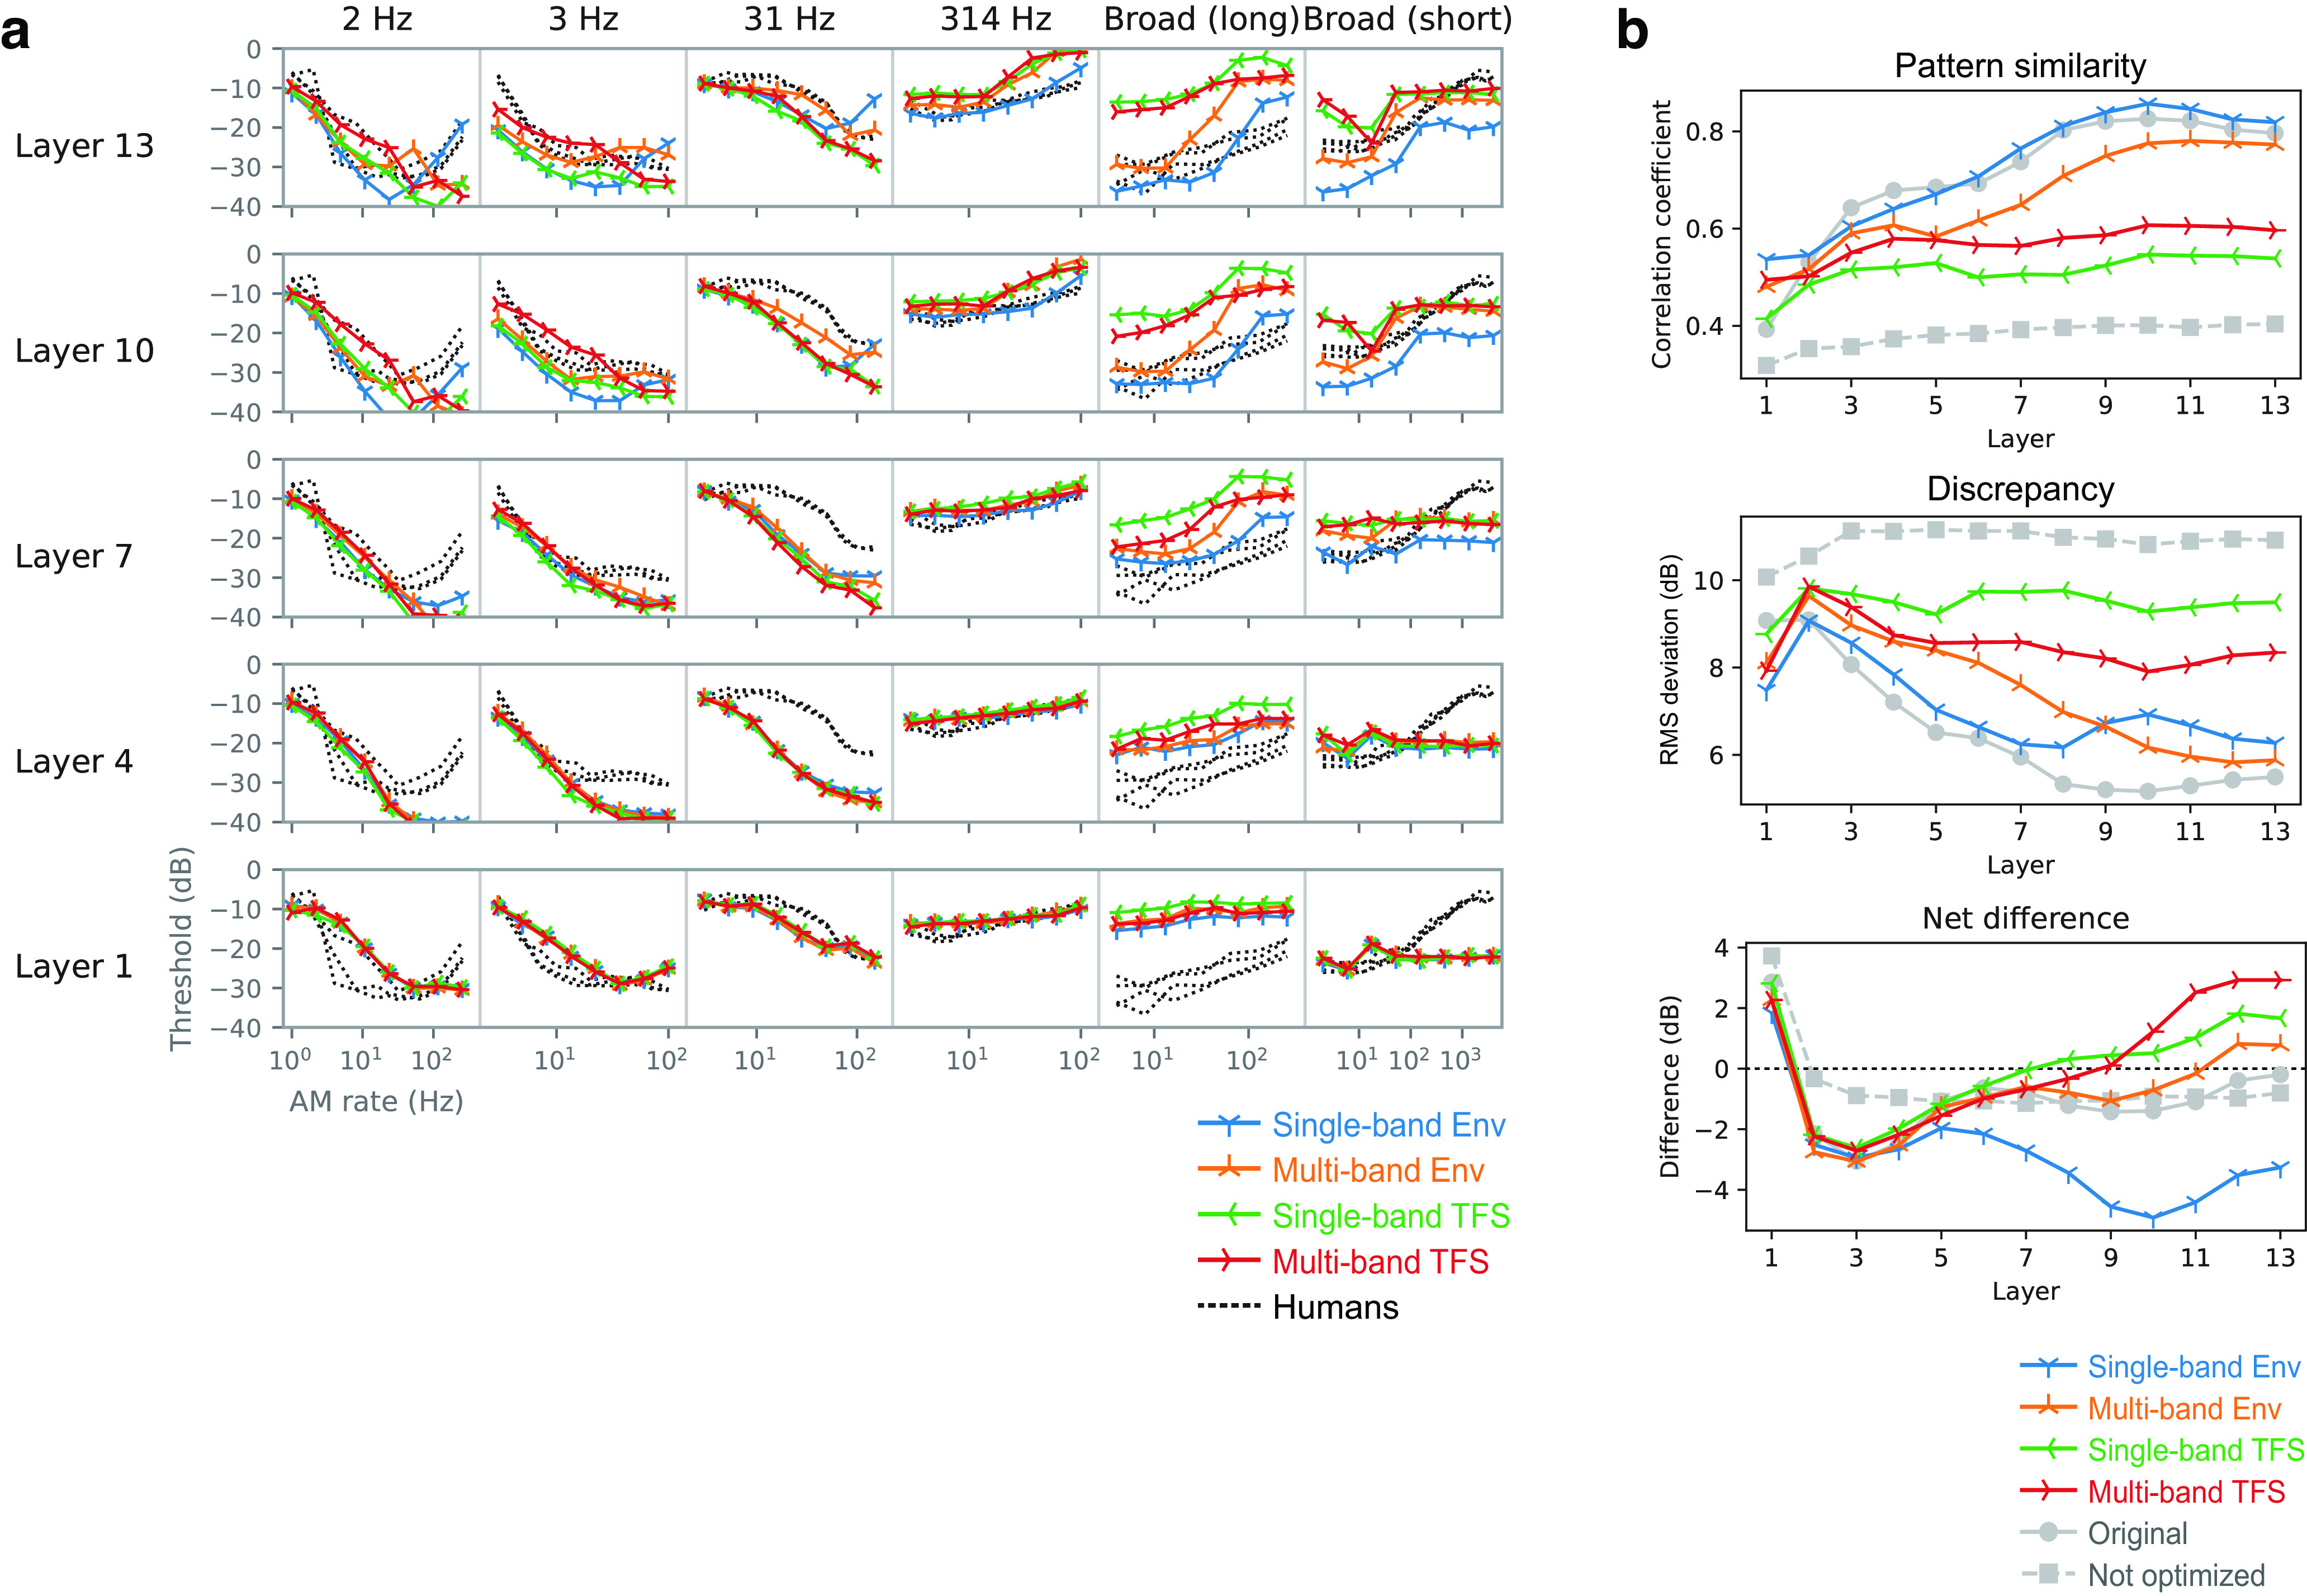
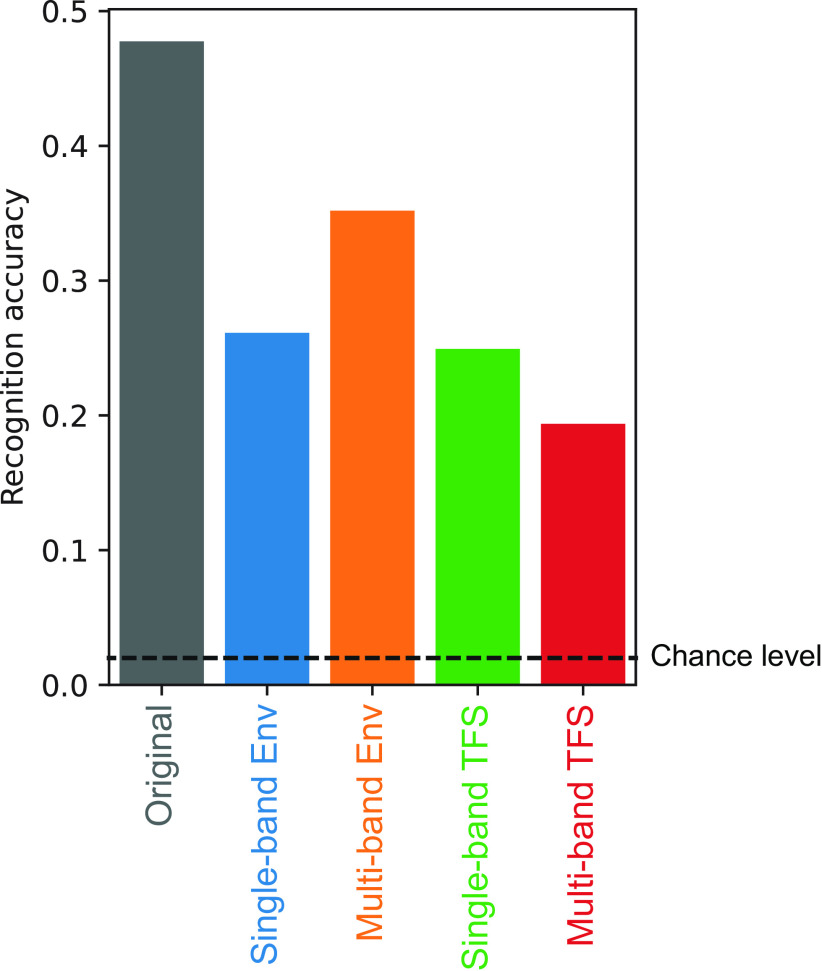
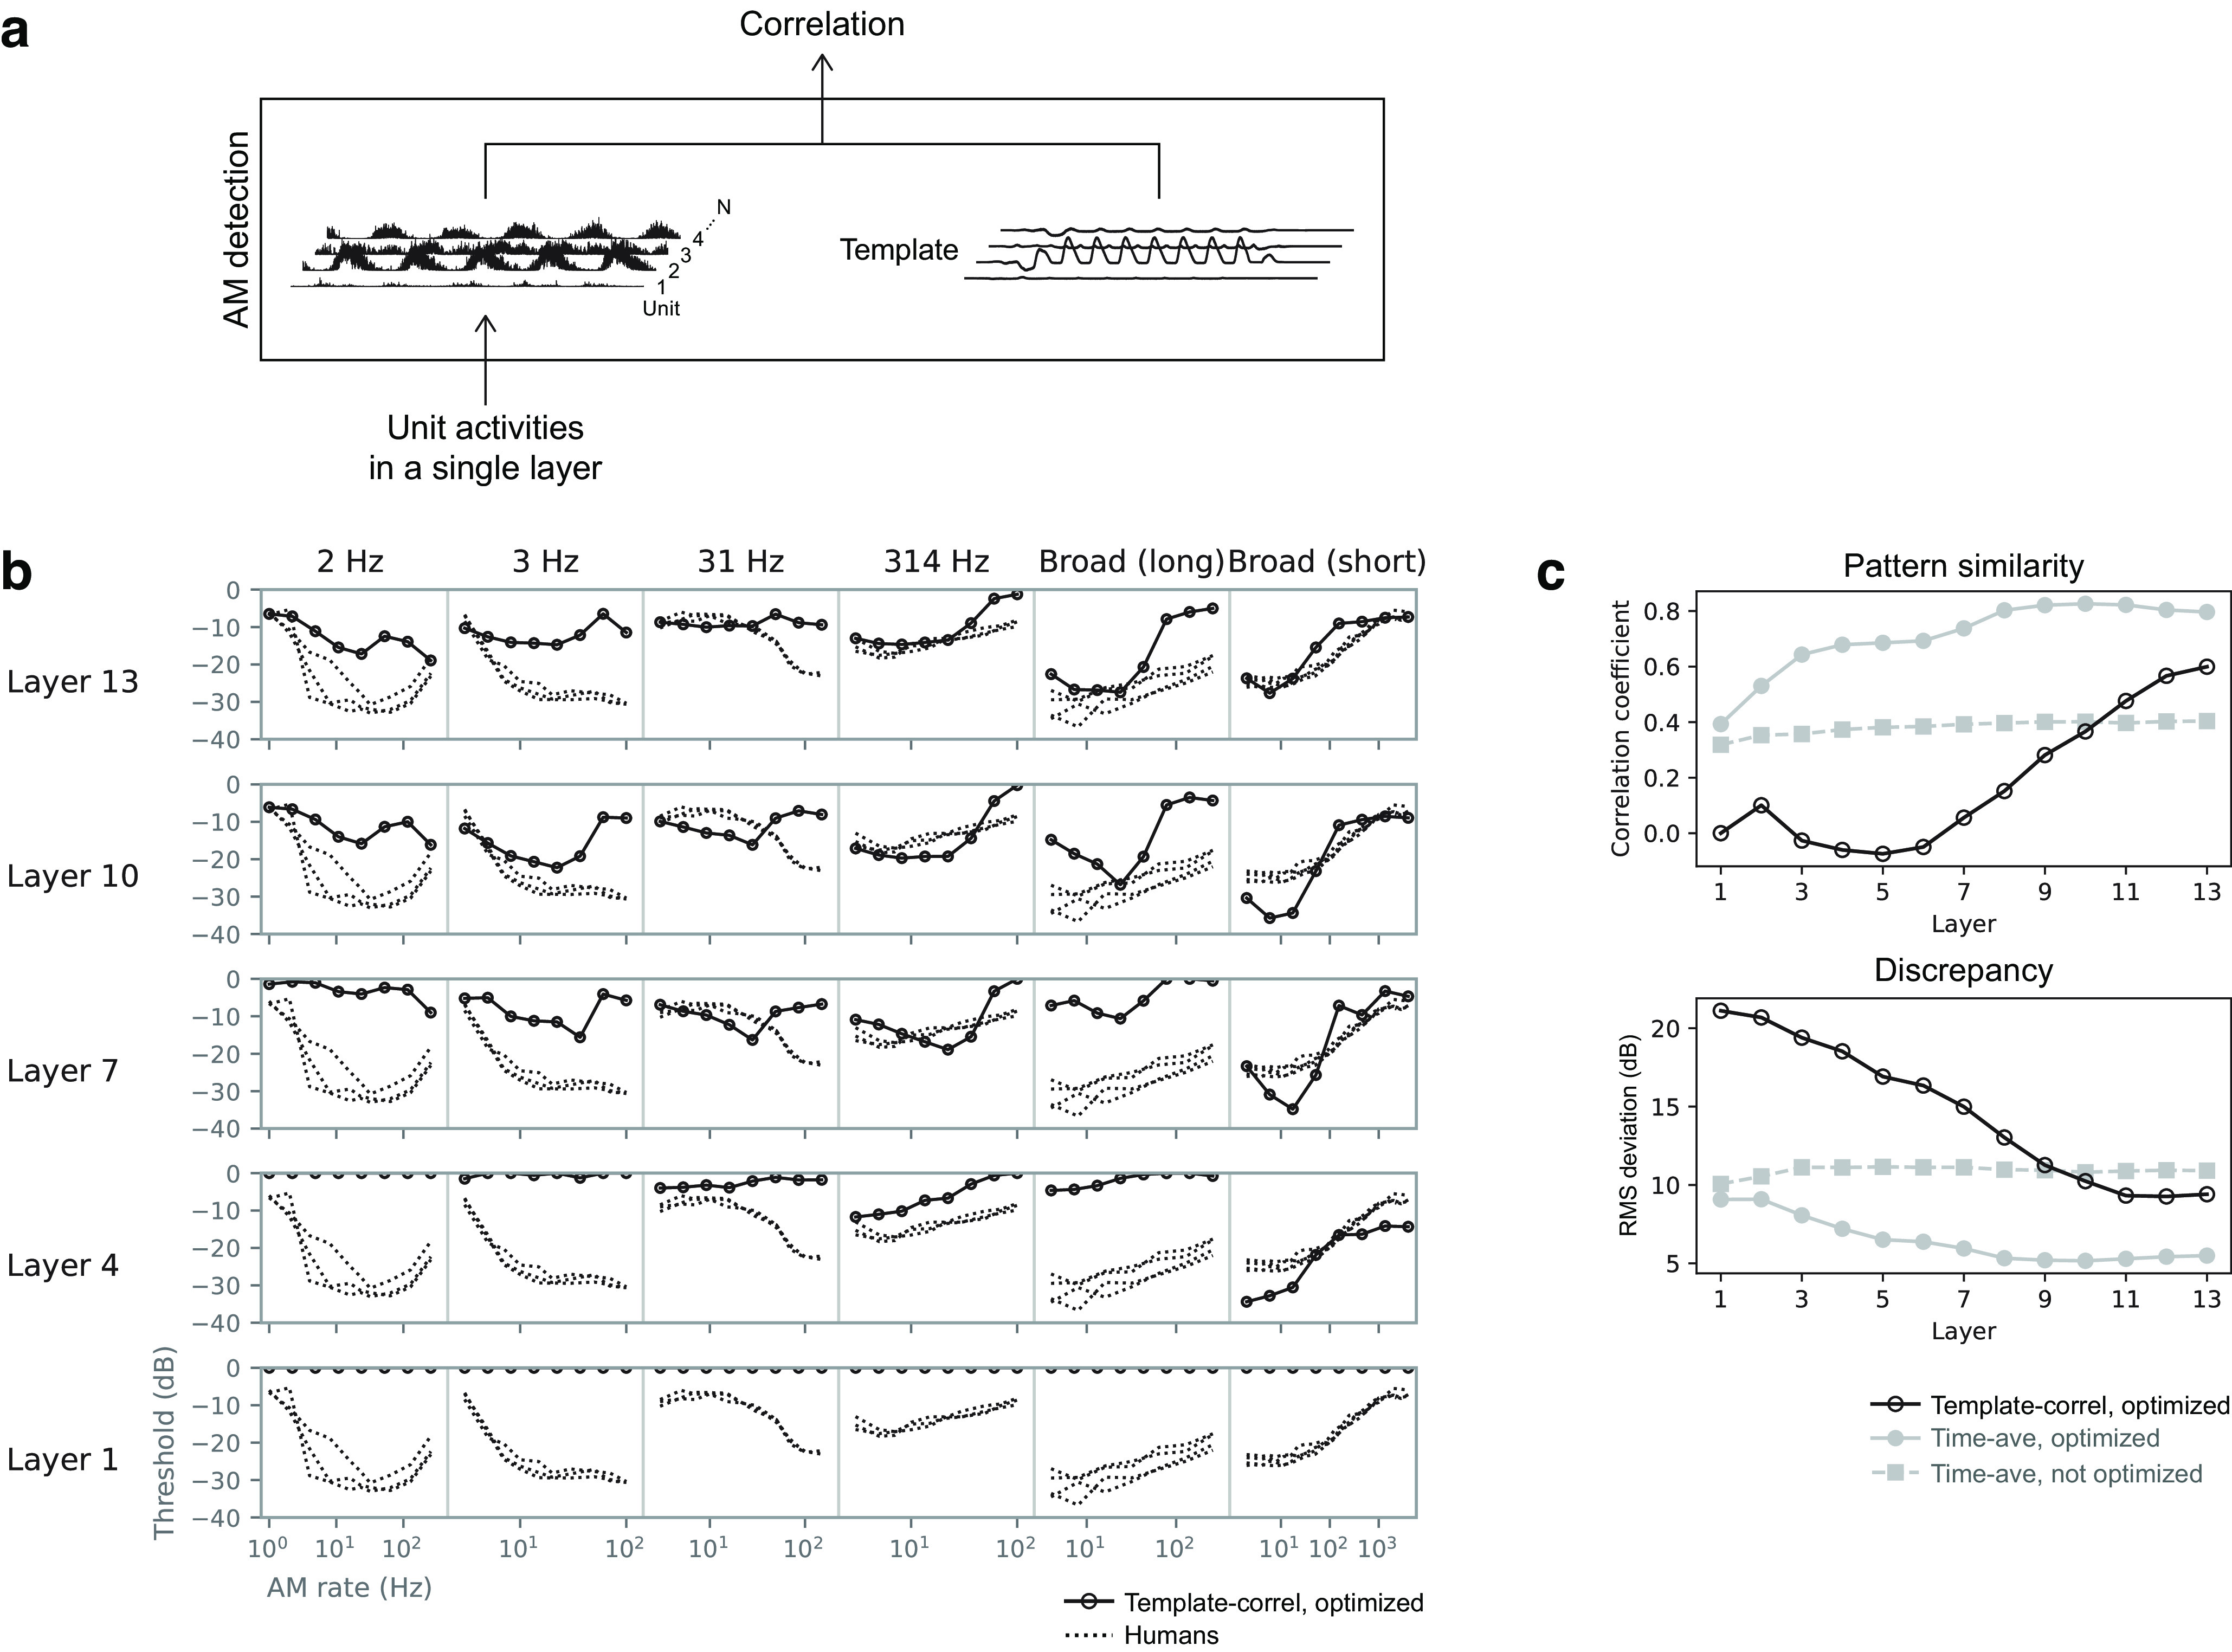
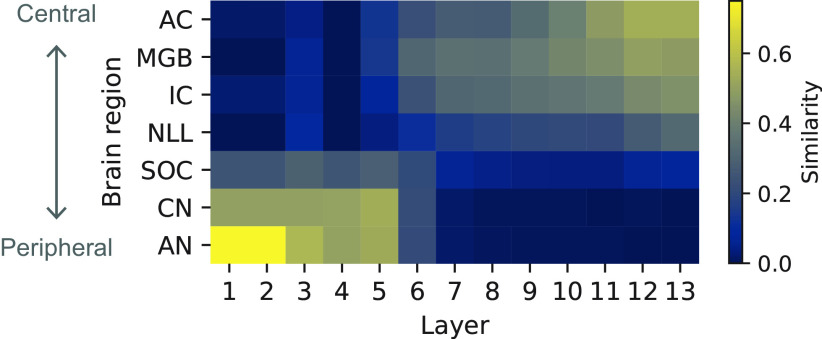
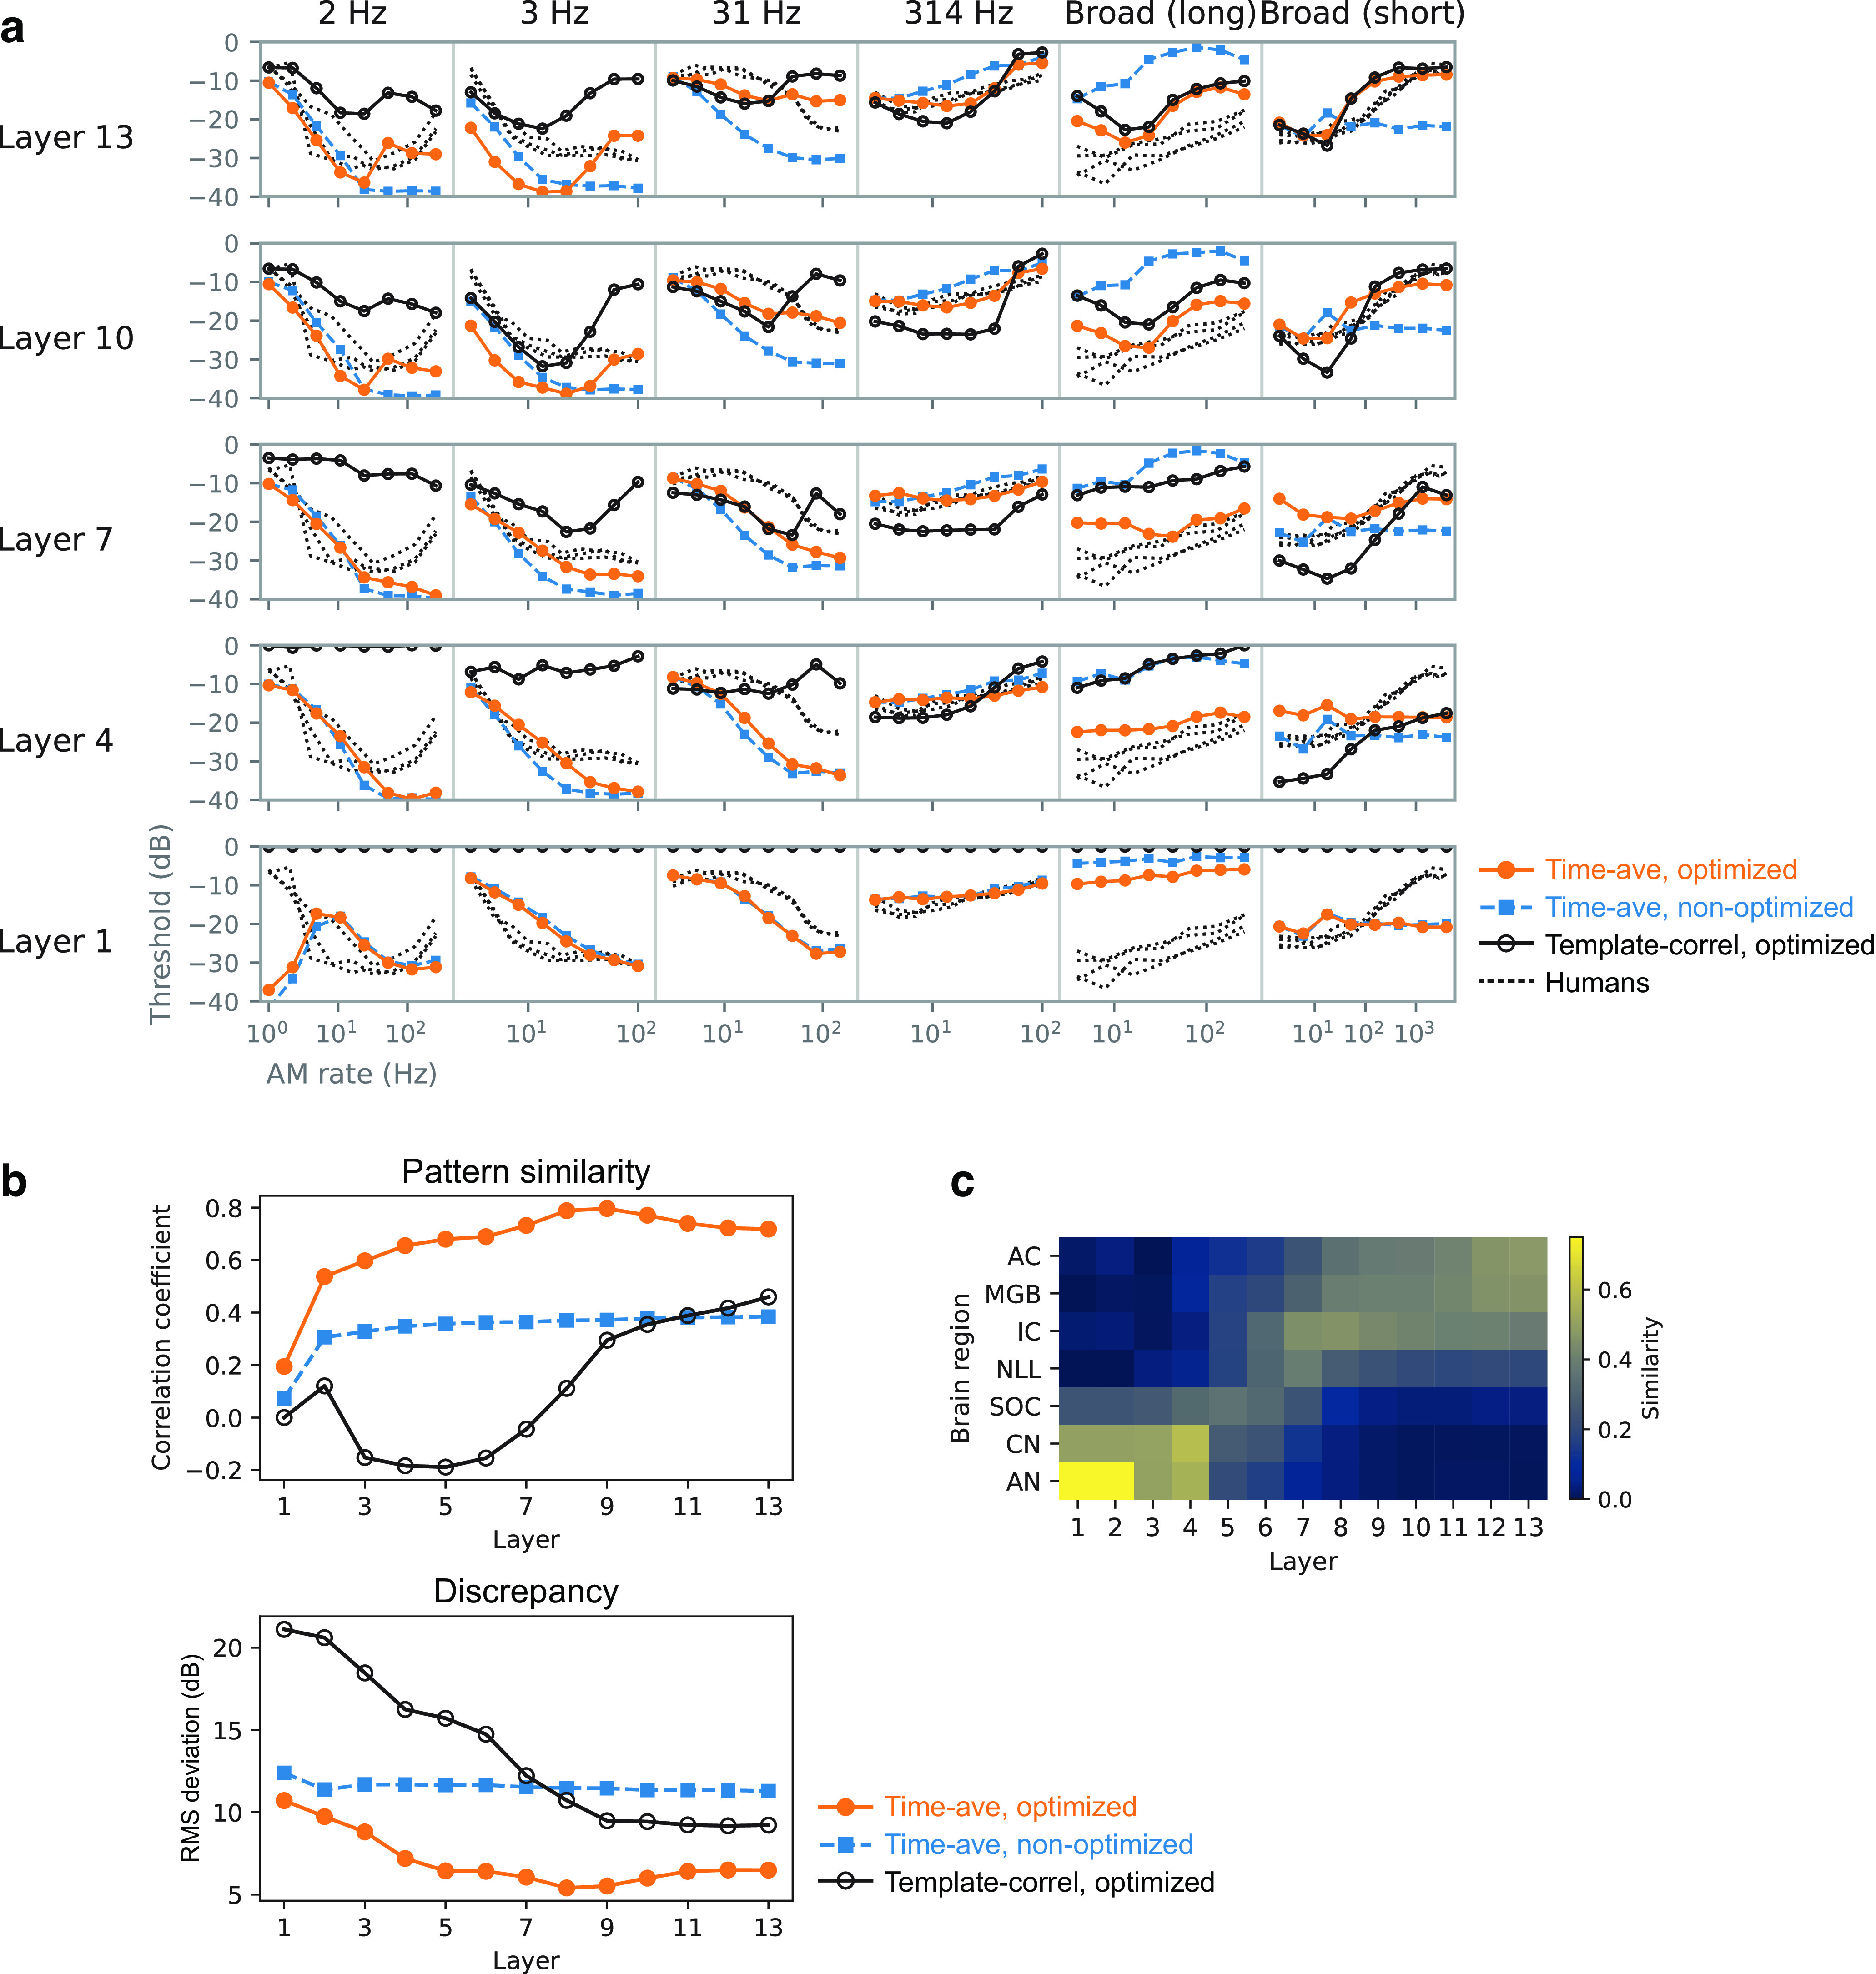
Natural sounds contain rich patterns of amplitude modulation (AM), which is one of the essential sound dimensions for auditory perception. The sensitivity of human hearing to AM measured by psychophysics takes diverse forms depending on the experimental conditions. Here, we address with a single framework the questions of why such patterns of AM sensitivity have emerged in the human auditory system and how they are realized by our neural mechanisms. Assuming that optimization for natural sound recognition has taken place during human evolution and development, we examined its effect on the formation of AM sensitivity by optimizing a computational model, specifically, a multilayer neural network, for natural sound (namely, everyday sounds and speech sounds) recognition and simulating psychophysical experiments in which the AM sensitivity of the model was assessed. Relatively higher layers in the model optimized to sounds with natural AM statistics exhibited AM sensitivity similar to that of humans, although the model was not designed to reproduce human-like AM sensitivity. Moreover, simulated neurophysiological experiments on the model revealed a correspondence between the model layers and the auditory brain regions. The layers in which human-like psychophysical AM sensitivity emerged exhibited substantial neurophysiological similarity with the auditory midbrain and higher regions. These results suggest that human behavioral AM sensitivity has emerged as a result of optimization for natural sound recognition in the course of our evolution and/or development and that it is based on a stimulus representation encoded in the neural firing rates in the auditory midbrain and higher regions.SIGNIFICANCE STATEMENT This study provides a computational paradigm to bridge the gap between the behavioral properties of human sensory systems as measured in psychophysics and neural representations as measured in nonhuman neurophysiology. This was accomplished by combining the knowledge and techniques in psychophysics, neurophysiology, and machine learning. As a specific target modality, we focused on the auditory sensitivity to sound AM. We built an artificial neural network model that performs natural sound recognition and simulated psychophysical and neurophysiological experiments in the model. Quantitative comparison of a machine learning model with human and nonhuman data made it possible to integrate the knowledge of behavioral AM sensitivity and neural AM tunings from the perspective of optimization to natural sound recognition.

Keywords: auditory; modulation; neural network; neurophysiology; psychophysics; sound recognition.


Figures

Figure 1.
Figure 1.
a, Examples of AM in natural sounds. Excerpts of a dog barking (top) and speech (bottom) are shown. Sound waveforms and their amplitude envelopes are shown by gray and black lines, respectively. b, Modulation spectra of the sounds in a. Each sound has a distinct modulation pattern. c, Illustration of the AM depth and rate (actually, the inverse of the rate) of sinusoidally amplitude-modulated white noise. Generally, the shallower the AM depth is the more difficult AM becomes to detect.
Figure 2.
Figure 2.
TMTFs of humans, sorted by the carrier bandwidth of the stimulus. The TMTF is defined as the AM detection threshold as a function of the AM rate. Amplitude modulation of broadband carriers yields low-pass-shaped TMTFs with lower thresholds at low AM rates and higher thresholds at high AM rates, whereas it yields high-pass-shaped TMTFs for narrowband carriers. Other stimulus parameters also appear to affect TMTFs. The depicted TMTFs were taken from psychophysics papers (Viemeister, 1979; Dau et al., 1997a; Lorenzi et al.,2001a,b). Each line shows a TMTF in a single person.
Figure 3.
Figure 3.
a–c, Schematic illustration of the framework of the present study, consisting of three stages. Humans have evolved and developed the ability to precisely recognize natural sounds (a). We realized a computational simulation of this process by optimizing a model for natural sound recognition. Specifically, we used a deep NN that takes a sound waveform as input and estimates its category. We froze the learned parameters and measured the AM sensitivity in the NN by using the same procedure as in human psychophysical experiments (b). A TMTF was computed for each layer. It was compared with previously reported human AM-sensitivity data in an attempt to answer why AM sensitivity has emerged in humans in its current form. We measured neurophysiological AM tuning in the units in the NN by using the same procedure as in animal neurophysiological experiments (c). On the basis of the similarity of the AM tuning with the auditory brain regions and the results of the psychophysical experiments, we could infer possible neural mechanisms underlying behavioral AM sensitivity.
Figure 4.
Figure 4.
Sound recognition accuracy of the models with different architectures. Left, In the first step of the search process, four models with 13 layers had the highest average accuracy (area with the white background). Right, In the second step, the accuracy of the models with 13 layers improved after further optimization (area with the blue background).
Figure 5.
Figure 5.
Schematic illustration of the NN architecture. Units in the first layer took a waveform as input and applied a nonlinear temporal convolution to it. Subsequent layers took the activations in the layer below as input. Above the topmost convolution layer (13th layer in the figure) was a classification layer. The number of units in the classification layer equals the number of sound categories. During training, softmax cross entropy was calculated for a single time frame at a time (corresponding to the input sampling rate). During the evaluation, values in the classification layer were averaged over time, and the category with the maximum average value was chosen as the estimated output category. The classification layer was not included in the psychophysical or neurophysiological analysis. This figure is a simplified illustration. The length of the convolutional filters and the number of units are not the same as those in the actual architectures used in this study.
Figure 6.
Figure 6.
a, Schematic illustration of the AM detection method in a 3IFC trial. Three stimuli were presented to the model, and the probabilities of the stimuli being modulated were estimated for each layer from its unit activities. The probability was estimated independently for each stimulus. The interval with the maximum probability was taken to be the response of the model to the task. It was calculated for each layer. In this example, it is the third interval, which is correct because the third stimulus was modulated. b, The boxes labeled AM detection in a are expanded for a detailed illustration of the probability estimation method. Logistic regression was applied to the time-averaged unit activities in a single layer. N denotes the number of units in the layer. c, An example of a psychometric curve obtained from a single layer. The proportion of correct trials (filled circles) was fitted with an asymmetric sigmoid curve (solid line). The detection threshold (vertical dotted line) was defined as the AM depth at a 0.707 correct proportion (horizontal dotted line).
Figure 7.
Figure 7.
TMTFs in the model optimized to everyday sounds (orange circles), those in the nonoptimized model (blue squares), and those in humans (black dotted lines). The columns correspond to different experimental conditions, and the rows correspond to the different layers. The TMTFs in the higher layers of the optimized model appear to be more similar to those of humans than those of the lower layers or the nonoptimized model.
Figure 8.
Figure 8.
Quantitative comparison of the TMTFs in the model and humans. Pattern similarity index (top) and discrepancy index (bottom) in the models optimized to everyday sounds (orange circles) and the nonoptimized models (blue squares) are shown. The relatively higher layers of the optimized models show large pattern similarity and small discrepancy. The lower layers and the nonoptimized models show low similarity.
Figure 9.
Figure 9.
AM sensitivity in different architectures and its relationship to recognition performance. a, TMTFs in the models with different architectures. Each colored line shows results for a single model with a specific choice of NN architecture. The color indicates the recognition accuracy (legend at right) of the corresponding architecture. Black dotted lines show human TMTFs. b, Pattern similarity and discrepancy indices. c, Correlation coefficients between the (dis)similarity indices and the recognition accuracy. Statistically significant positive and negative correlations were found in the highest layers; **p < 0.01 with a Bonferroni correction for the number of layers.
Figure 10.
Figure 10.
a, TMTFs of the models optimized to degraded sounds. b, Their pattern similarity index (top), discrepancy (middle), and net difference from humans (bottom) are shown. The indices of the original optimized and nonoptimized models are shown as gray lines. Overall, in the higher layers, the TMTFs of the Env models were more similar to those of humans than were the TMTFs of the TFS models. Single-band Env models exhibited high pattern similarity but also showed a high discrepancy, indicating that the patterns of the TMTFs, but not their absolute values, were similar to those of humans. Their thresholds appeared to be lower than those of humans, as shown by the negative net difference.
Figure 11.
Figure 11.
Recognition accuracy of models optimized to degraded sounds. The result of a model optimized to the original sounds is also shown on the left. Generally, the recognition accuracy of the model dropped when it was optimized to degraded sounds, but the drop was not catastrophic.
Figure 12.
Figure 12.
a, Schematic illustration of the AM detection process based on correlation with a template. For the purpose of explanation, this illustration replaces Figure 6b, where the correlation in this figure corresponds to the output probability in Figure 6b. b, TMTFs obtained from AM detection based on template correlation (open circles). TMTFs of humans are shown as dotted lines. c, Pattern similarity index and discrepancy index from the template-based detector (black open circles). The similarity indices for the time-average-based detector (Fig. 8) are shown as filled symbols. AM detection based on template correlation did not result in human-like TMTFs.
Figure 13.
Figure 13.
Similarity of the neurophysiological tuning between brain regions and NN layers. Layers that showed TMTFs similar to those of humans roughly correspond to higher regions like the IC, MGB, and AC.
Figure 14.
Figure 14.
Results of the model optimized to speech sounds. a, TMTFs of the optimized model with the AM detection process based on time-averaged unit activities (orange circles), those of the nonoptimized model (blue squares), those from AM detection based on temporal correlation with templates (black open circles), and those of humans (black dotted lines). b, Pattern similarity index and discrepancy index between the model TMTFs and human TMTFs. c, Similarity of neurophysiological tuning between NN layers and auditory brain regions.
Figure 15.
Figure 15.
a, Pattern similarity and discrepancy indexes of the TMTFs in the models with different architectures optimized to speech sounds. The pattern of the similarity indexes appeared similar across different NN architectures. b, Correlation between similarity indexes and recognition accuracy. Significant correlation was not observed. These results are probably because of the small dynamic range of recognition accuracy.
Figure 16.
Figure 16.
a, Recognition accuracy of the models optimized to degraded speech sounds. Left, The result for the model optimized to original speech sounds is also shown. Recognition accuracy dropped when the models were optimized to degraded sounds, but the drop was not catastrophic except in the multiband TFS model. b, Pattern similarity indices (top), discrepancy indices (middle), and net difference (bottom) between model TMTFs and human TMTFs. The results are consistent with those of the models optimized to everyday sounds.

References

    1. Ashihara T, Moriya T, Kashino M (2021) Investigating the impact of spectral and temporal degradation on end-to-end automatic speech recognition performance. Proc Interspeech 2021:1757–1761.
    1. Barrett DG, Morcos AS, Macke JH (2019) Analyzing biological and artificial neural networks: challenges with opportunities for synergy? Curr Opin Neurobiol 55:55–64. 10.1016/j.conb.2019.01.007 - DOI - PubMed
    1. Bartlett EL, Wang X (2007) Neural representations of temporally modulated signals in the auditory thalamus of awake primates. J Neurophysiol 97:1005–1017. 10.1152/jn.00593.2006 - DOI - PubMed
    1. Bashivan P, Kar K, DiCarlo JJ (2019) Neural population control via deep image synthesis. Science 64:eaav9436. 10.1126/science.aav9436 - DOI - PubMed
    1. Batra R (2006) Responses of neurons in the ventral nucleus of the lateral lemniscus to sinusoidally amplitude modulated tones. J Neurophysiol 96:2388–2398. 10.1152/jn.00442.2006 - DOI - PubMed

Publication types