

Review
doi: 10.1097/RLI.0000000000000980.
Epub 2023 Apr 26.
Technical Basics and Clinical Benefits of Photon-Counting CT
Affiliations
- PMID: 37185302
- PMCID: PMC10259209
- DOI: 10.1097/RLI.0000000000000980
Item in Clipboard
Review
Technical Basics and Clinical Benefits of Photon-Counting CT
Invest Radiol.
.
Abstract
Novel photon-counting detector CT (PCD-CT) has the potential to address the limitations of previous CT systems, such as insufficient spatial resolution, limited accuracy in detecting small low-contrast structures, or missing routine availability of spectral information. In this review article, we explain the basic principles and potential clinical benefits of PCD-CT, with a focus on recent literature that has grown rapidly since the commercial introduction of a clinically approved PCD-CT.
Copyright © 2023 The Author(s). Published by Wolters Kluwer Health, Inc.
Conflict of interest statement
Conflicts of interest and sources of funding: Thomas Flohr and Bernhard Schmidt are employees of Siemens Healthcare GmbH.
Figures
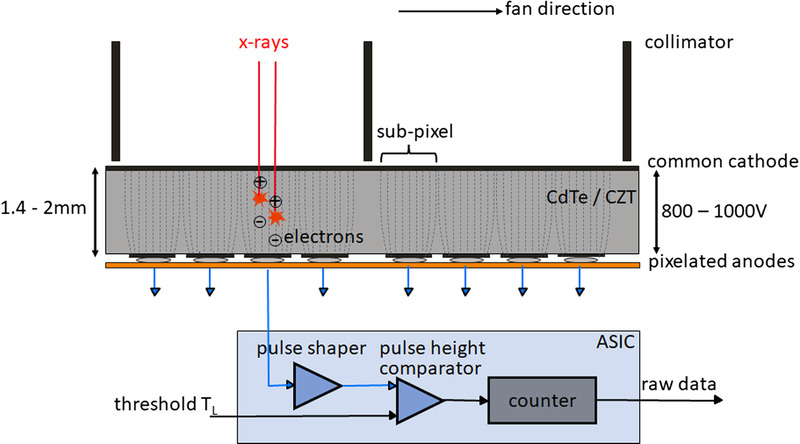
Schematic illustration of a CdTe/CZT PCD (top) and the corresponding read-out ASIC (bottom). View from the front of the CT system, the fan direction is the direction in the scan plane along the detector fan. The individual detector pixels are formed by the strong electric field between the common cathode and the pixelated anodes (indicated here by dashed lines); no further separation of the pixels, for example, by interlayers, is necessary. In the detector structure shown here, 4 subpixels each are located between 2 collimator blades to suppress scattered radiation, see also Figure 4. In the ASIC, the voltage pulses generated by the absorbed x-ray quanta are compared in a pulse height comparator with a threshold voltage corresponding to the desired threshold energy (20–25 keV). Only x-ray quanta exceeding this threshold energy are counted.
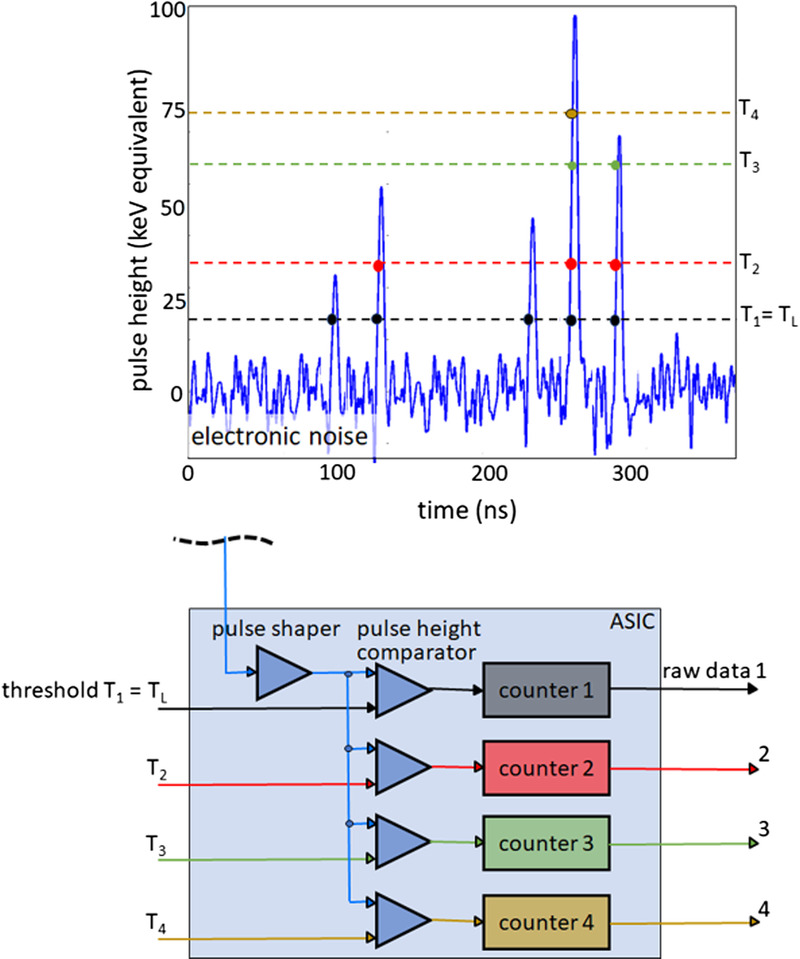
Schematic illustration of spectral data acquisition with a PCD. Shown above is a time sequence of voltage pulses generated by absorbed x-ray quanta of various energies. Below, the technical realization of a 4-threshold counter is schematically indicated. In this example, 4 counters operating at 20, 35, 60, and 75 keV threshold energy are read out simultaneously. The detector provides 4 raw data streams containing only counted x-ray quanta with absorbed energy greater than the respective threshold energy.
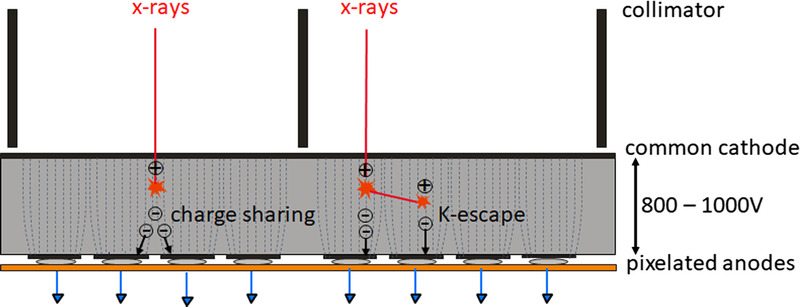
Schematic illustration of charge sharing and K-escape that reduce the energy separation of a realistic PCD. X-rays absorbed close to pixel borders produce electrons that generate signals in neighboring pixels (charge sharing). Thus, an x-ray photon is erroneously counted several times with too low energy. Incident x-rays can also initially knock out inner shell electrons from the detector material (K-electrons). This produces fluorescence radiation, which is reabsorbed and counted in the detector cell itself or in neighboring detector cells (K-escape). The incident x-rays at the primary interaction site are counted with too low energy.
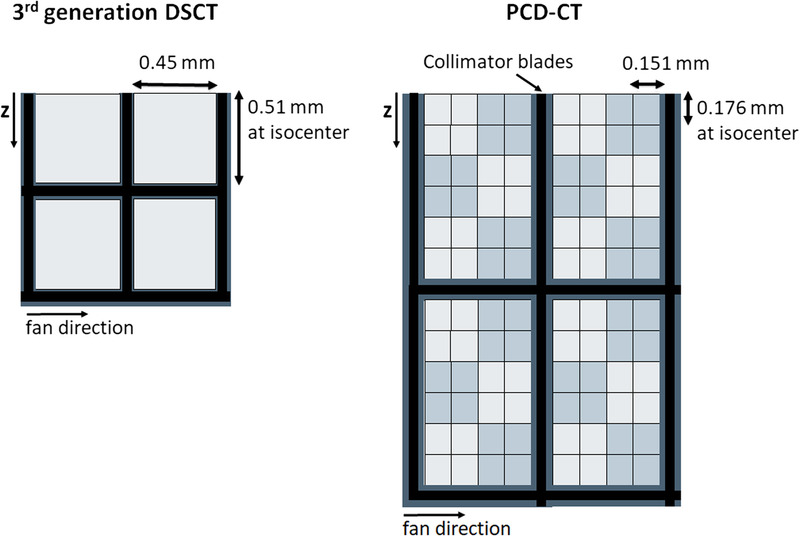
Schematic detector structure of a third generation DSCT with a scintillator detector (left) and a commercial PCD-DSCT (right). View from the top, the z-direction is the patient’s longitudinal direction. The thick black lines schematically represent the collimator grid to suppress scattered radiation. The detector pixels of the PCD are read out separately in the ultra-high-resolution mode. For standard scanning, 2×2 pixels are combined into 1 macro pixel – this is indicated by light and dark gray squares.

Demonstration of 40 lp/cm spatial resolution achieved on a PCD-CT with a detector as schematically shown in Figure 4. For reconstruction, the sharpest kernel Br98 was used. Image courtesy of Matthias Baer-Beck, Siemens Healthineers, Forchheim, Germany.
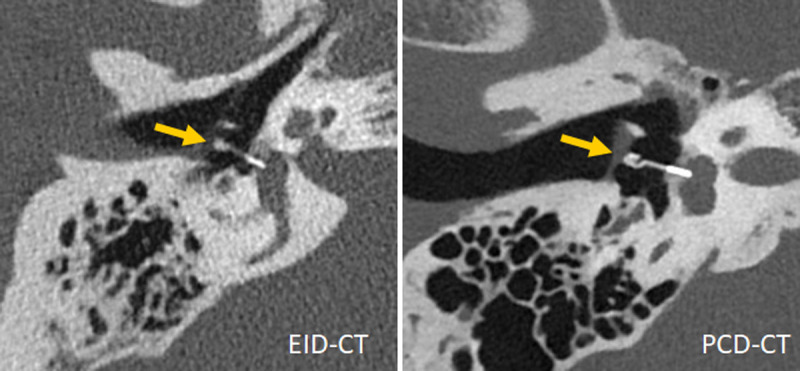
Inner ear scans acquired with a third-generation DSCT (left) and a first-generation PCD-DSCT, (right), demonstrating superior visualization of a Titanium K-piston stapes prosthesis (arrow, distal end diameter 0.4 mm) with PCD-CT. Courtesy of Dr A. van der Lugt, Erasmus Medical Center, Rotterdam, the Netherlands.
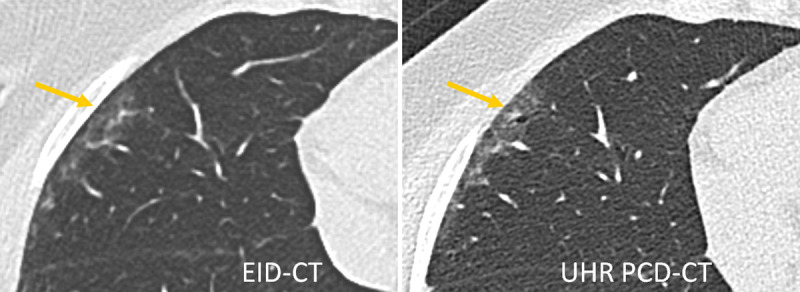
Lung scan of a patient with interstitial lung disease acquired with a third-generation DSCT (left) and a first-generation PCD-DSCT, (right). The UHR PCD-CT scan confirms the presence of traction bronchiolectasis in the periphery of the right middle lobe (arrow), superimposed on mild ground-glass attenuation. This finding was missed on the EID-CT scan. Courtesy of Dr Martine Remy-Jardin, Hôpital Calmette, Lille, France.
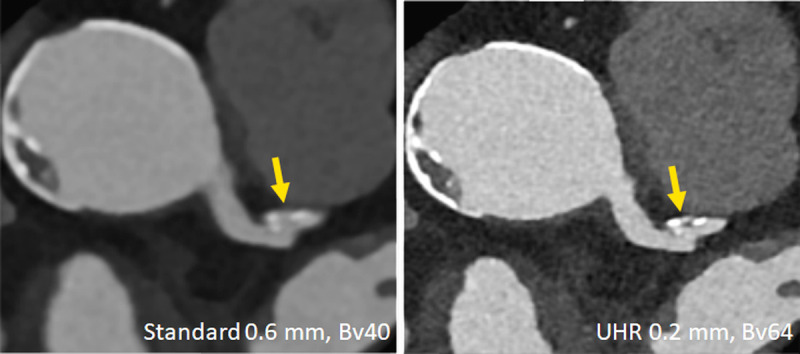
Clinical example demonstrating improved characterization of coronary plaques with UHR PCD-CT. A plaque that appears essentially calcified in a standard reconstruction (left) turns out to be mixed and smaller in volume in the UHR image (right). Image courtesy of Drs V. Mergen and H. Alkadhi, University Hospital Zurich, Switzerland.
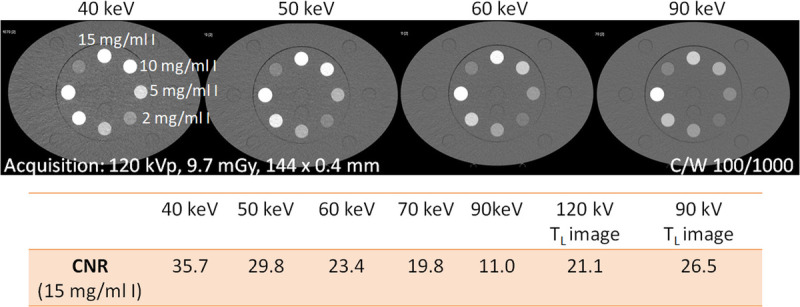
CNR of a tube filled with a 15 mg I/mL solution inserted into the large (40 × 30 cm) Gammex multienergy CT phantom (Sun Nuclear Corporation, Melbourne, FL), scanned with a PCD-DSCT. With decreasing keV level of the VMIs, the iodine CNR increases. The iodine CNR in 55 keV VMIs from a 120 kV scan (interpolated) is equivalent to 90 kV scanning (TL image at 90 kV), and that in 55 keV VMIs is equivalent to 120 kV scanning.
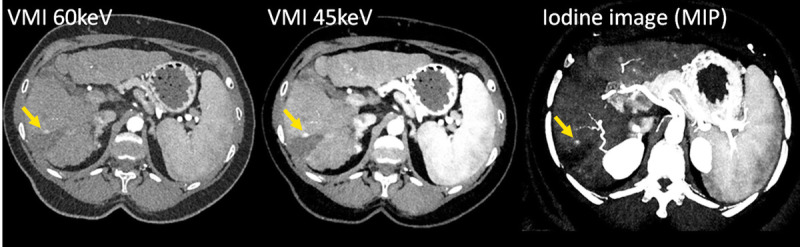
CT images of a patient with liver cirrhosis and tumor recurrence after ablation, scanned with a PCD-DSCT (120 kV, 144 × 0.4 mm, CTDIvol = 4.8 mGy). With decreasing keV level of the VMIs (left and center), the iodine CNR increases, and the tumor recurrence (arrow) becomes more evident. The iodine image (right) enables quantification of the iodine uptake. Courtesy of Dr A. van der Lugt, Erasmus Medical Center, Rotterdam, the Netherlands.
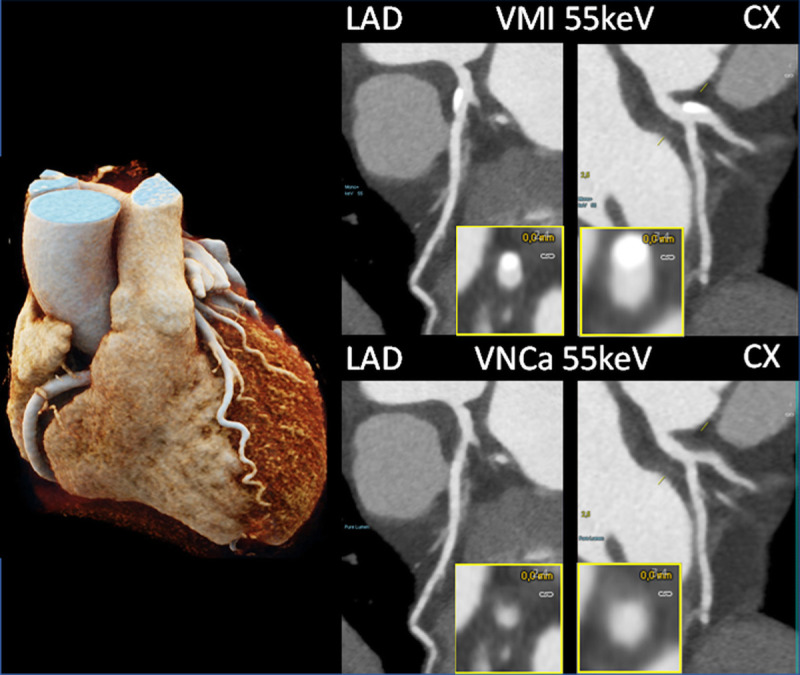
Coronary CTA images of a patient with calcifications in the LAD and CX, scanned with a PCD-DSCT (120 kV, 144 × 0.4 mm, 0.25 seconds rotation time, 66 milliseconds temporal resolution). The calcifications shown in the 55 keV VMIs (top) are removed in the 55 keV virtual noncalcium images (bottom). Courtesy of Dr H. Alkadhi, University Hospital Zurich, Switzerland.
References
-
- Andreini D Mushtaq S Pontone G, et al. . CT perfusion versus coronary CT angiography in patients with suspected in-stent restenosis or CAD progression. JACC Cardiovasc Imaging. 2020;13:732–742. - PubMed
-
- Taguchi K. Energy-sensitive photon counting detector-based x-ray, computed tomography. Radiol Phys Technol. 2017;10:8–22. - PubMed
-
- Willemink MJ Persson M Pourmorteza A, et al. . Photon-counting CT: technical principles and clinical prospects. Radiology. 2018;289:293–312. - PubMed
