. 2023 Apr 25;14(1):2375.
doi: 10.1038/s41467-023-38110-7.

Teasing out missing reactions in genome-scale metabolic networks through hypergraph learning

Affiliations

Teasing out missing reactions in genome-scale metabolic networks through hypergraph learning

Can Chen et al. Nat Commun. .

Abstract

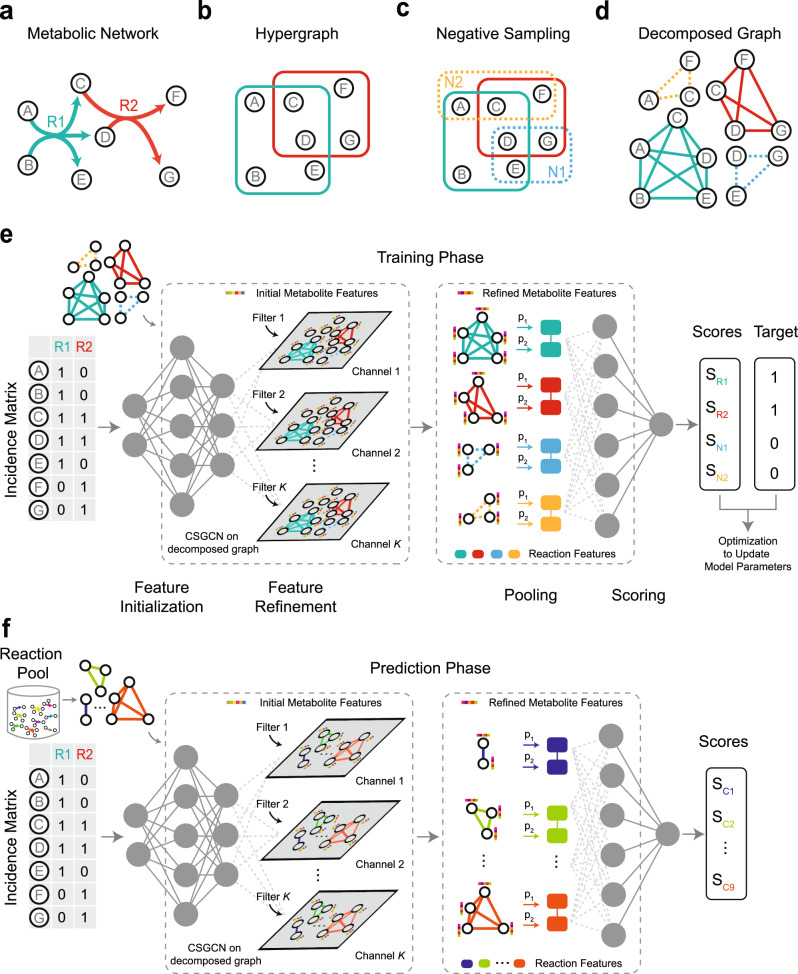
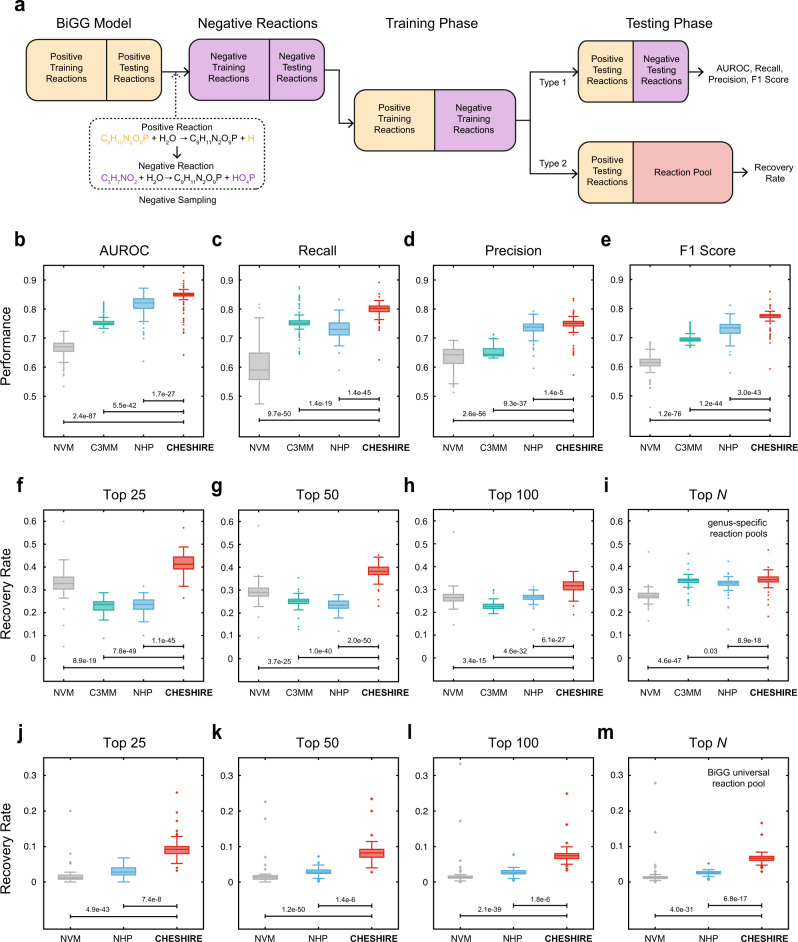
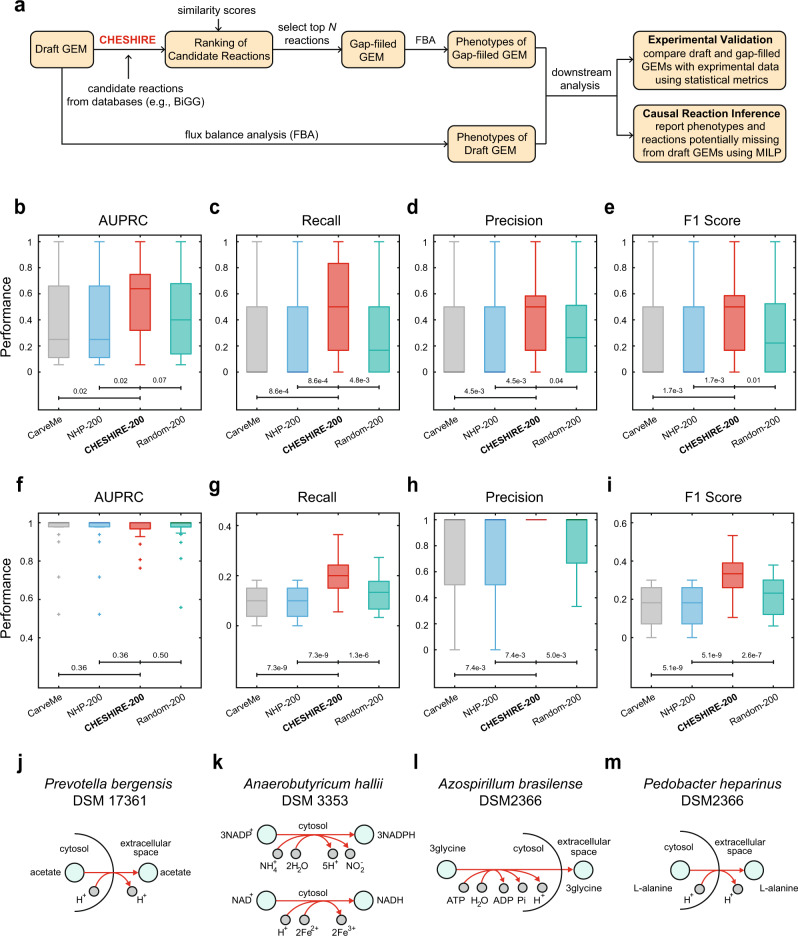
GEnome-scale Metabolic models (GEMs) are powerful tools to predict cellular metabolism and physiological states in living organisms. However, due to our imperfect knowledge of metabolic processes, even highly curated GEMs have knowledge gaps (e.g., missing reactions). Existing gap-filling methods typically require phenotypic data as input to tease out missing reactions. We still lack a computational method for rapid and accurate gap-filling of metabolic networks before experimental data is available. Here we present a deep learning-based method - CHEbyshev Spectral HyperlInk pREdictor (CHESHIRE) - to predict missing reactions in GEMs purely from metabolic network topology. We demonstrate that CHESHIRE outperforms other topology-based methods in predicting artificially removed reactions over 926 high- and intermediate-quality GEMs. Furthermore, CHESHIRE is able to improve the phenotypic predictions of 49 draft GEMs for fermentation products and amino acids secretions. Both types of validation suggest that CHESHIRE is a powerful tool for GEM curation to reveal unknown links between reactions and observed metabolic phenotypes.


Conflict of interest statement

The authors declare no competing interests.

Figures

Fig. 1
Fig. 1. CHESHIRE workflow.
a Schematic representation of a metabolic network. b Hypergraph representation of the metabolic network. The hypergraph is undirected where each hyperlink connects metabolites that participate the same reaction. c Negative sampling of the metabolic network. Solid and dashed boxes represent positive and negative reactions (e.g., N1, N2), respectively. d Decomposed graph of the metabolic network, where each reaction (either positive or negative) is treated as a fully connected subgraph (solid and dashed lines represent positive and negative reactions, respectively). e The architecture of CHESHIRE during training. The deep neural network takes the incidence matrix and the decomposed graph (d) as input, and consists of an encoder layer, a Chebyshev spectral graph convolutional layer with K filters (resulting in K channels), a pooling layer with two pooling functions, and a final scoring layer. The output confidence scores are compared to the target scores for updating model parameters. The gray dots represent the hidden neurons. f The architecture of CHESHIRE during prediction. The neural network takes the incidence matrix and a decomposed graph built from candidate reactions as input and outputs confidence scores for candidate reactions based on the trained model parameters.
Fig. 2
Fig. 2. Internal validation using artificially introduced gaps.
a Flowchart of internal validation. Two types of internal validation were performed. The former mixes artificially removed positive reactions and their derived negative reactions as candidate reactions, while the latter uses artificially removed positive reactions and real reactions from a universal reaction database as candidate reactions. be Boxplots of the performance metrics (AUROC, Recall, Precision, and F1 score) calculated on 108 BiGG GEMs (each dot represents a GEM) for CHESHIRE vs. NHP, C3MM, and NVM. fi Reaction recovery rate of CHESHIRE vs. NHP, C3MM, and NVM for gap-filling the BiGG GEMs using genus-specific reaction pools. The comparison was performed on 73 BiGG models which have over 1000 reactions and whose genera are present in the genus-specific reaction pools, by adding the top 25, 50, 100, and N reactions with the highest confidence scores (N is the number of artificially removed reactions). jm The same as (fi) but using the entire BiGG universal reaction pool. 83 BiGG models with over 1000 reactions were tested, and C3MM was excluded due to the issue of scalability. Each data point represents the mean statistic over 10 Monte Carlo runs. Boxplot: central line represents the median, box limits represent the first and third quartiles, and whiskers extend to the smallest and largest values or at most to 1.5× the interquartile range, whichever is smaller. Two-sided paired-sample t-test: exact p-values are provided. Source data are provided as a Source Data file.
Fig. 3
Fig. 3. External validation by predicting metabolic phenotypes.
a Flowchart of external validation. The predicted phenotypes from CHESHIRE-gapfilled GEMs are validated by comparison to experimental observation. For phenotypes correctly predicted by gap-filled GEMs but missed by draft GEMs, we also identify the causal reactions from CHESHIRE-predicted set that improve the phenotypic prediction using Mixed Integer Linear Programming (MILP). bi Performance (AUPRC, Recall, Precision, and F1 score) of CHESHIRE and NHP in filling gaps in (be) 24 bacterial GEMs for fermentation metabolite production and (fi) 25 bacterial GEMs for amino acid secretions. NVM was not included here due to its poor performance in internal validation. C3MM was not considered either because of the issue of scalability. “CarveMe” represents the draft models reconstructed from CarveMe. “NHP-200” and “CHESHIRE-200” represent draft models plus 200 reactions predicted by NHP and CHESHIRE, respectively (reaction confidence scores averaged over 5 Monte Carlo runs). For “Random-200'', 200 randomly selected reactions from the universal BiGG database were added to the draft models (performance averaged over 3 Monte Carlo runs). Boxplot: central line represents the median, box limits represent the first and third quartiles, and whiskers extend to the smallest and largest values or at most to 1.5× the interquartile range, whichever is smaller. Two-sided paired-sample t-test: exact p-values are provided. jm Examples of CHESHIRE-predicted reactions (red arrows) that causally gap-fill the observed phenotypes of acetate production (j), lactate production (k), and amino acid secretions (l, m). Abbreviations of cofactors: adenosine triphosphate (ATP); adenosine diphosphate (ADP); adenosine phosphate (AMP); phosphate (Pi); inorganic pyrophosphate (PPi); Coenzyme A (CoA); oxidized/reduced nicotinamide adenine dinucleotide (NAD+/NADH); oxidized/reduced nicotinamide adenine dinucleotide phosphate (NADP+/NADPH). Source data are provided as a Source Data file.

References

    1. Wang H, et al. Genome-scale metabolic network reconstruction of model animals as a platform for translational research. Proc. Natl Acad. Sci. USA. 2021;118:e2102344118. doi: 10.1073/pnas.2102344118. - DOI - PMC - PubMed
    1. Fang X, Lloyd CJ, Palsson BO. Reconstructing organisms in silico: genome-scale models and their emerging applications. Nat. Rev. Microbiol. 2020;18:731–743. doi: 10.1038/s41579-020-00440-4. - DOI - PMC - PubMed
    1. Orth JD, Thiele I, Palsson BØ. What is flux balance analysis? Nat. Biotechnol. 2010;28:245–248. doi: 10.1038/nbt.1614. - DOI - PMC - PubMed
    1. Gu C, Kim GB, Kim WJ, Kim HU, Lee SY. Current status and applications of genome-scale metabolic models. Genome Biol. 2019;20:1–18. doi: 10.1186/s13059-019-1730-3. - DOI - PMC - PubMed
    1. Heinken A, Basile A, Hertel J, Thinnes C, Thiele I. Genome-scale metabolic modeling of the human microbiome in the era of personalized medicine. Annu. Rev. Microbiol. 2021;75:199–222. doi: 10.1146/annurev-micro-060221-012134. - DOI - PubMed

Publication types