. 2023 Apr 25;14(1):2383.
doi: 10.1038/s41467-023-38034-2.

Bone marrow endosteal stem cells dictate active osteogenesis and aggressive tumorigenesis

Affiliations

Bone marrow endosteal stem cells dictate active osteogenesis and aggressive tumorigenesis

Yuki Matsushita et al. Nat Commun. .

Abstract

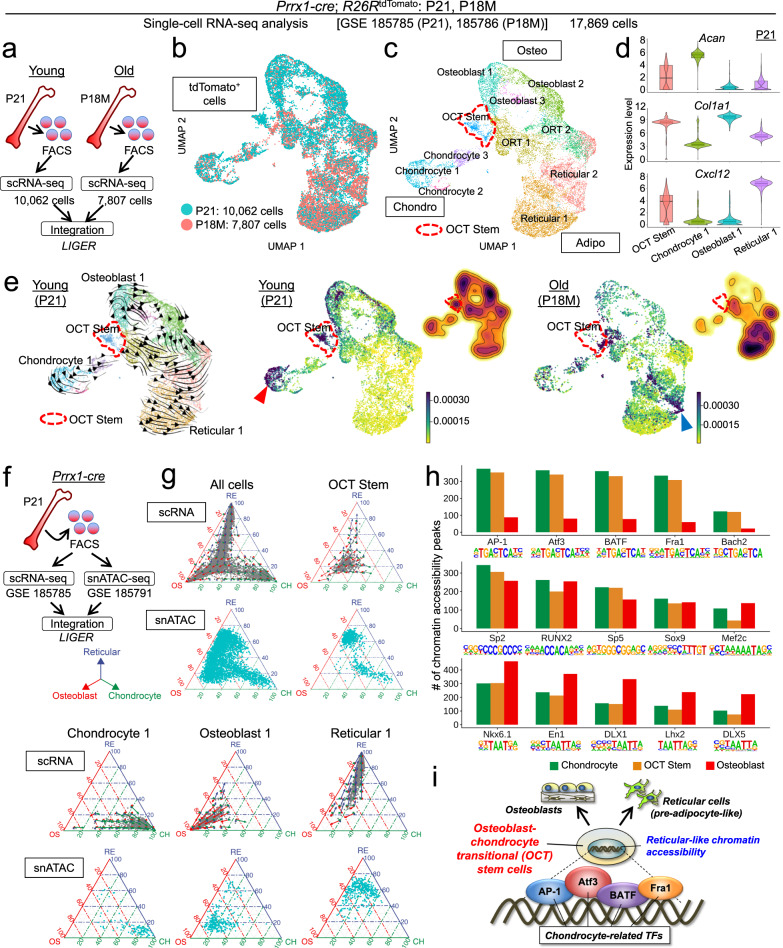
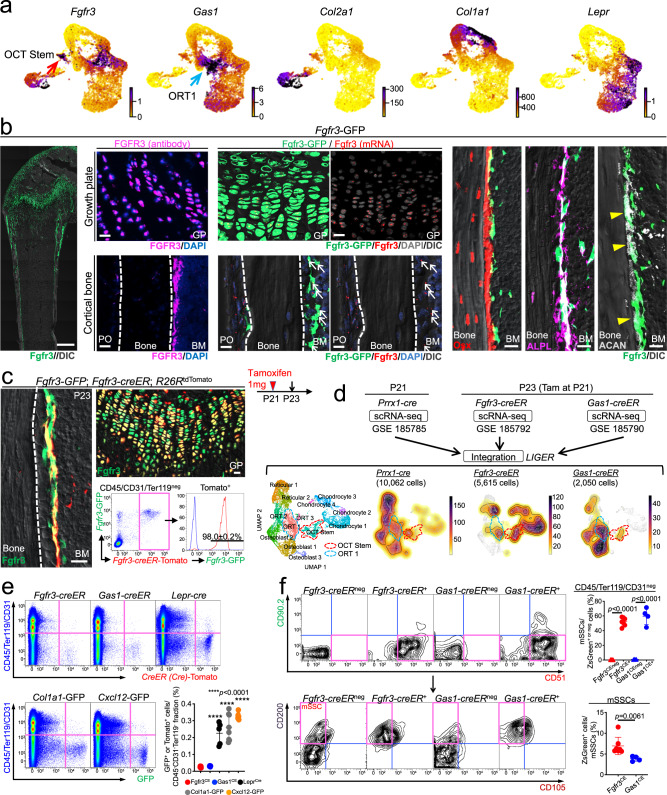
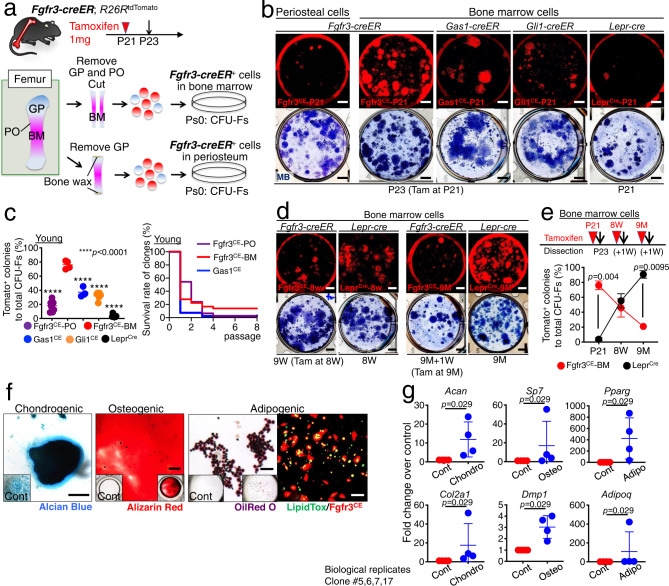
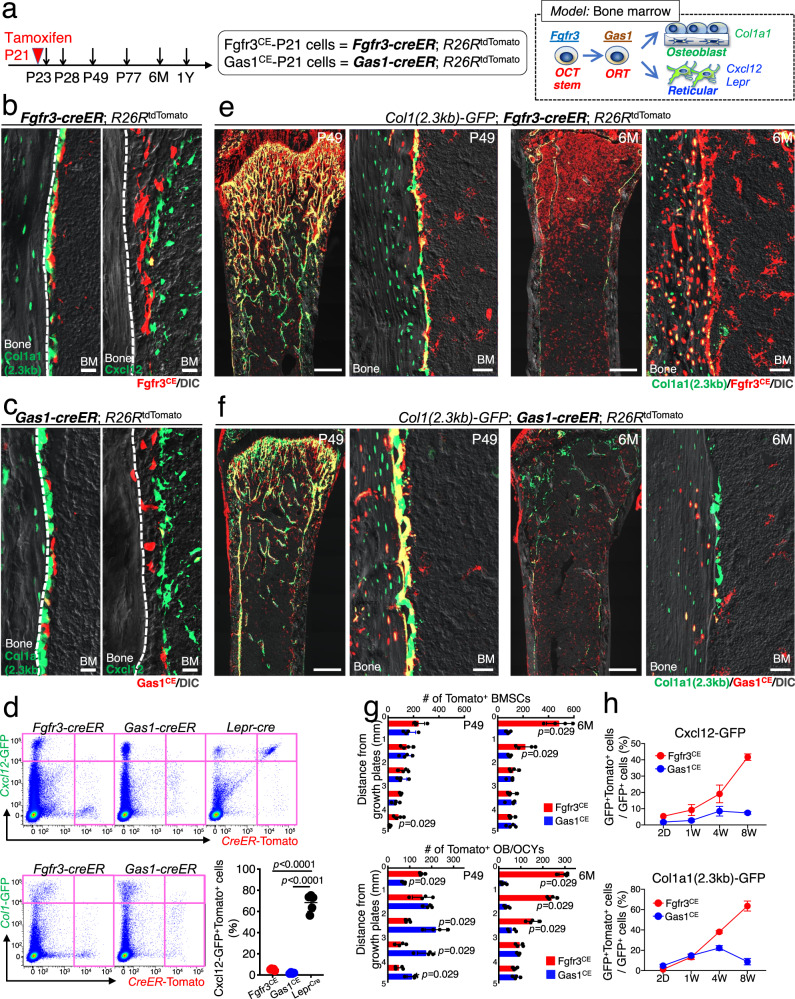
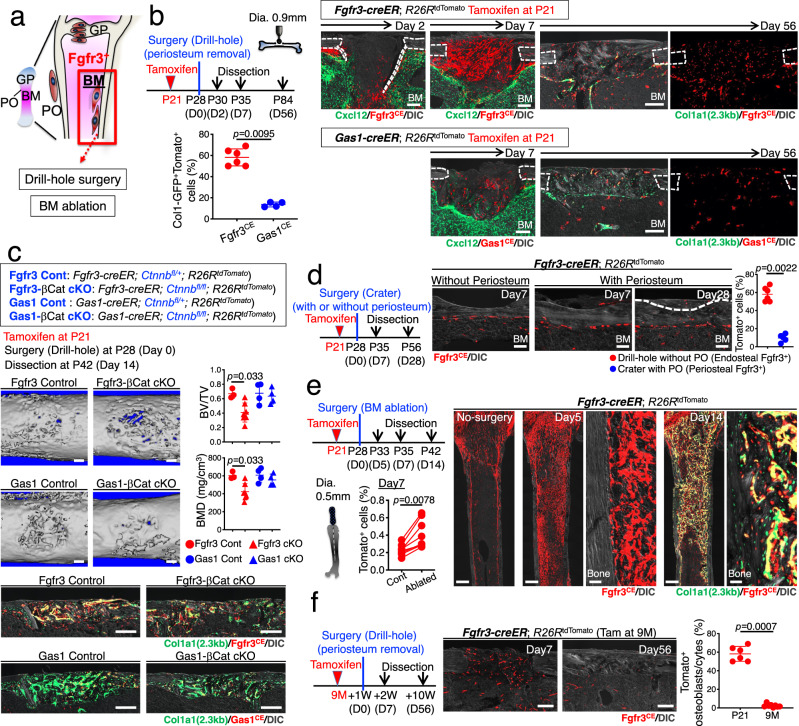
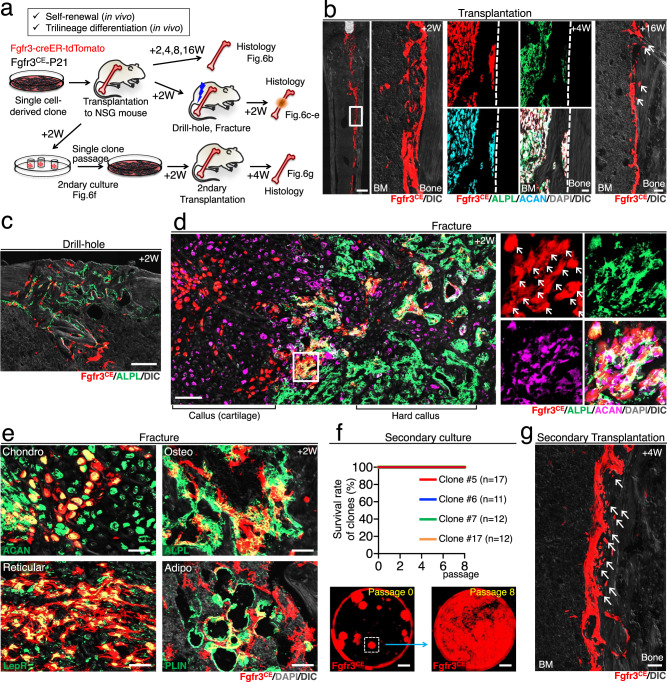
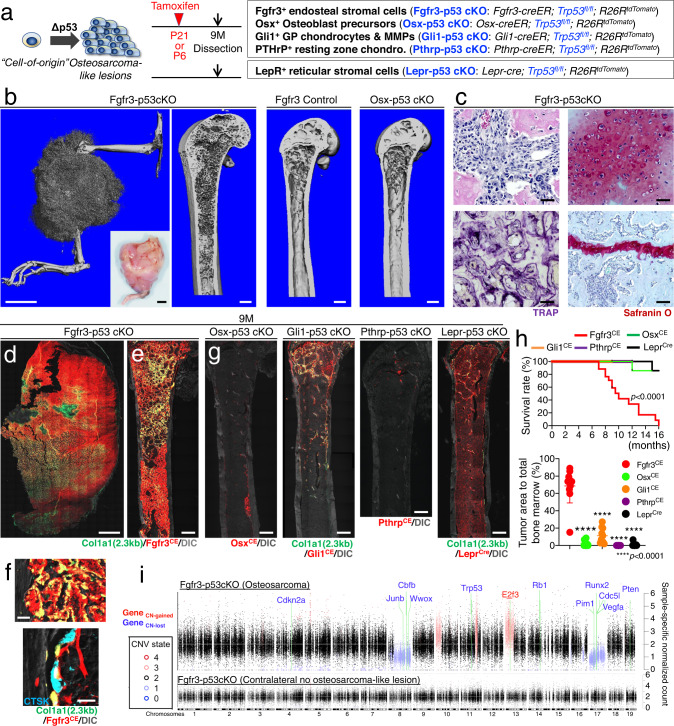
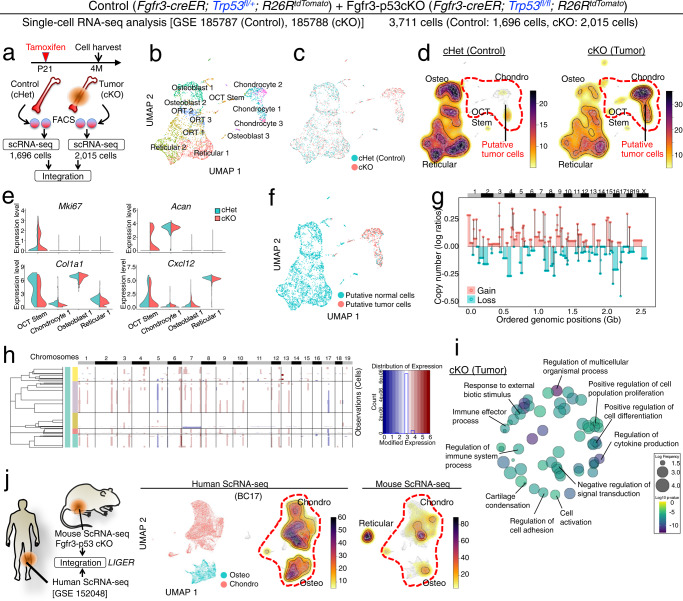
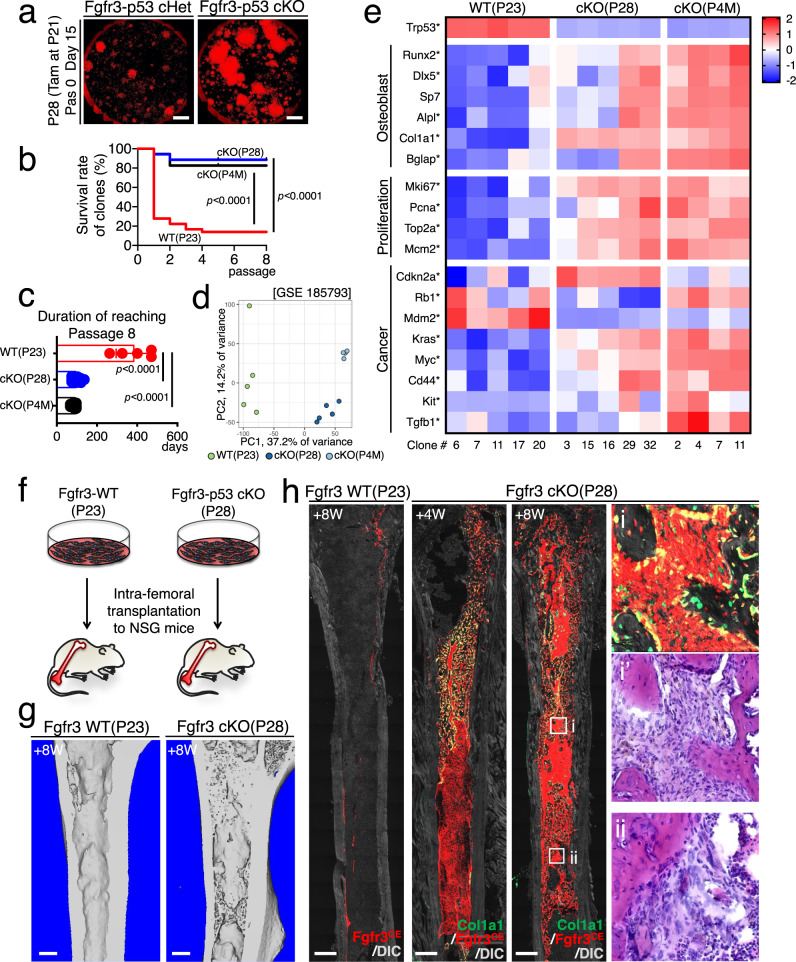
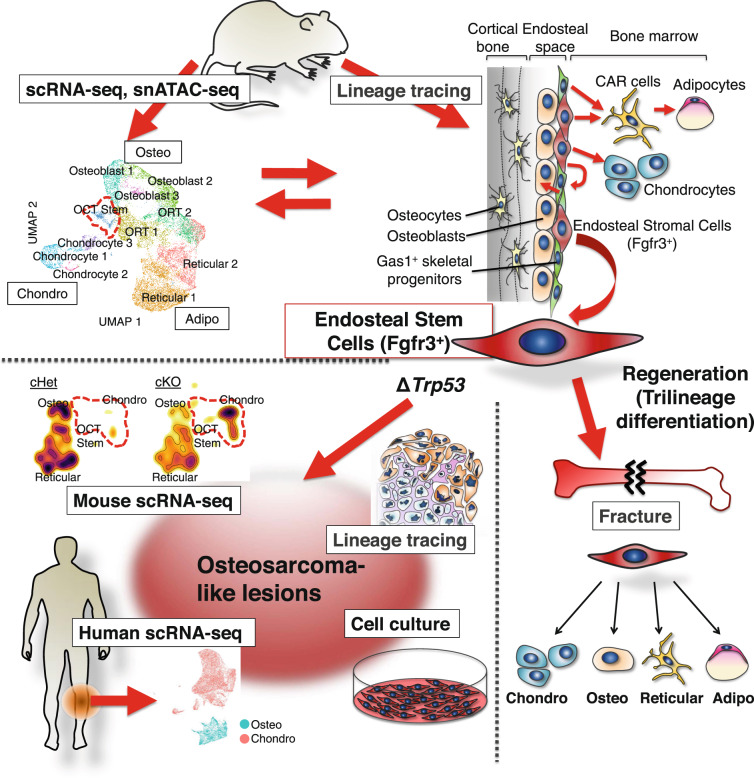
The bone marrow contains various populations of skeletal stem cells (SSCs) in the stromal compartment, which are important regulators of bone formation. It is well-described that leptin receptor (LepR)+ perivascular stromal cells provide a major source of bone-forming osteoblasts in adult and aged bone marrow. However, the identity of SSCs in young bone marrow and how they coordinate active bone formation remains unclear. Here we show that bone marrow endosteal SSCs are defined by fibroblast growth factor receptor 3 (Fgfr3) and osteoblast-chondrocyte transitional (OCT) identities with some characteristics of bone osteoblasts and chondrocytes. These Fgfr3-creER-marked endosteal stromal cells contribute to a stem cell fraction in young stages, which is later replaced by Lepr-cre-marked stromal cells in adult stages. Further, Fgfr3+ endosteal stromal cells give rise to aggressive osteosarcoma-like lesions upon loss of p53 tumor suppressor through unregulated self-renewal and aberrant osteogenic fates. Therefore, Fgfr3+ endosteal SSCs are abundant in young bone marrow and provide a robust source of osteoblasts, contributing to both normal and aberrant osteogenesis.


Conflict of interest statement

The authors declare no competing interests.

Figures

Fig. 1
Fig. 1. Osteoblast-chondrocyte transitional identities of putative skeletal stem cells in young marrow.
a Diagram for LIGER data integration. Single-cell RNA-seq datasets of sorted tdTomato+ single cells harvested from Prrx1-cre; R26RtdTomato femur bone marrow at P21 (Young, 10,062 cells) and P18M (Old, 7807 cells) were merged by LIGER. b UMAP visualization of two datasets (P21 and P18M) merged by LIGER. Cells were pooled from n = 3 (P21), n = 2 (P18M) mice. Blue: P21 (Young), red: P18M (Old). c UMAP visualization of major sub-clusters of Prrx1cre-tdTomato+ cells, Chondro [Chondrocyte (1–3)], Osteo [Osteoblast (1–3)], Adipo [Reticular (1–2)], osteoblast-reticular transitional (ORT) cells (1–2), and osteoblast-chondrocyte transitional (OCT) stem cells. Red dotted contour: OCT stem cluster. d Violin plots of representative chondrocyte (Acan), osteoblast (Col1a1), and reticular cell (Cxcl12) markers in representative clusters (OCT Stem, Chondrocyte 1, Osteoblast 1, and Reticular 1) at P21. n = 570 (OCT Stem), n = 764 (Chondrocyte 1), n = 1181 (Osteoblast 1), and n = 1797 (Reticular 1) cells. Data were presented as median (mid-line in the plot) [25 percentile (lower bound in the plot), 75 percentile (upper bound in the plot)] of the log2-transformed normalized gene expression. e RNA velocity at P21 (left), CellRank and density plot at P21 (center), and at P18M (right). Black arrows: dynamic velocity vectors inferring future states. Red dotted contour: OCT Stem cluster. The color scale for CellRank: initial cell state probability. The color scale for density plots: violet: high expression, yellow: low expression. f Single-cell RNA-seq and snATAC-seq datasets of fluorescently sorted tdTomato+ single cells harvested from the same biological sample (Prrx1-cre; R26RtdTomato femur bone marrow at P21) were integrated by LIGER. g Simplex and velocity analyses of representative cell types. Cells colored in gray show their transcriptomic affinities towards three vertices, whereas the arrows show the future differentiation potential of the cells. Cells colored in aqua show their epigenomic affinities towards three vertices. Blue arrow and axis: Reticular cluster. Red: Osteoblast cluster. Green: Chondrocyte cluster. h Barplots of transcription factor (TF) binding sites analysis. Y-axis: number of chromatin accessibility peaks. i Proposed model of OCT stem cell. “OCT stem” cells with osteoblast-chondrocyte transitional identities have reticular-like chromatin accessibility, future differentiation potential toward pre-adipocyte-like cells and osteoblasts, and enrichment of TFs that regulate chondrocyte differentiation.
Fig. 2
Fig. 2. Fgfr3+ stromal cells are localized to the bone marrow endosteum.
a UMAP plots colored by expression of representative OCT Stem (Fgfr3), ORT 1 (Gas1), chondrocyte (Col2a1), osteoblast (Col1a1), and reticular cell (Lepr) markers. Violet: high expression, yellow: low expression. b Fgfr3-GFP femur at P21. Left panel: Scale bar: 500 µm. n = 4 mice. Center panels: Growth plate (upper) and cortical bone (lower) in high magnification. Immunohistostaining for FGFR3 (left) and RNAscope analyses of Fgfr3 (right). Scale bar: 20 µm. n = 4 mice. Right panels: Magnified images of endosteal space with Osx-mCherry (left), ALPL staining (center), and ACAN staining (right). GP: growth plate, PO: periosteum, BM: bone marrow. Scale bar: 20 µm. n = 4 mice. c Fgfr3-GFP; Fgfr3-creER; R26RtdTomato femur at P23 (pulsed at P21). Histology and flow cytometry analysis of CD45/Ter119/CD31neg bone marrow cells isolated from distal femurs. Fgfr3-GFP expression in Fgfr3CE-tdTomato+ cells. Blue lines: GFPneg control cells. GP: growth plate, BM: bone marrow. Scale bar: 20 µm. n = 3 mice. d UMAP visualization of three datasets (Prrx1cre-tdTomato+ cells at P21, Fgfr3CE-tdTomato+ cells at P23, and Gas1CE-tdTomato+ cells at P23) merged by LIGER. Prrx1cre-tdTomato+: 10,062 cells, pooled from n = 3 mice, Fgfr3CE-tdTomato+: 5615 cells, pooled from n = 8 mice (pulsed at P21), Gas1CE-tdTomato+: 2050 cells, pooled from n = 7 mice (pulsed at P21). Leftmost: UMAP visualization of major sub-clusters. Center to the right: Density plots of Prrx1-cre (left center), Fgfr3-creER (right center), and Gas1-creER (rightmost). Red dotted contour: OCT Stem cluster (enriched in Fgfr3-creER dataset). Blue dotted contour: ORT 1 cluster (enriched in Gas1-creER dataset). Colored scale, violet: high expression, yellow: low expression. e Flow cytometry analyses of CD45/Ter119/CD31neg bone marrow cells isolated from Fgfr3-creER; R26RtdTomato and Gas1-creER; R26RtdTomato femurs at P23 (pulsed at P21), or Lepr-cre; R26RtdTomato, Col1a1-GFP, and Cxcl12-GFP femurs at P21. Lower right: Percentage of tdTomato+ cells within CD45/Ter119/CD31neg fraction. n = 7 (Fgfr3CE), n = 6 (Gas1CE), n = 5 (Leprcre), n = 8 (Col1a1-GFP), and n = 6 (Cxcl12-GFP) mice. Two-tailed, one-way ANOVA followed by Dunnett’s multiple comparison test. f Percentage of mSSCs among Fgfr3CE+/neg or Gas1CE+/neg cells (upper). Percentage of Fgfr3CE+ and Gas1CE+ cells among mSSCs (lower). n = 7 (Fgfr3CE), n = 4 (Gas1CE) mice. Data were presented as mean ± s.d. Exact P value is indicated in the figures. Source data are provided as a Source Data file.
Fig. 3
Fig. 3. Fgfr3+ endosteal stromal cells are enriched for skeletal stem cell activity.
a Diagram of protocols to isolate Fgfr3-creER+ cells from bone marrow (top) or periosteum (bottom). b CFU-F assay. Fgfr3CE-tdTomato+ periosteal cells (leftmost), Fgfr3CE-tdTomato+ (left center), Gas1CE-tdTomato+ (center), and Gli1CE-tdTomato+ (right center) bone marrow cells at P23 (pulsed at P21), and Leprcre-tdTomato+ (rightmost) bone marrow cells at P21. Upper: tdTomato+ colonies, Lower: total colonies stained by methylene blue. Scale bar: 5 mm. c Percentage of tdTomato+ colonies among total CFU-Fs in young bone (left). Fgfr3CE-periosteum, Fgfr3CE-bone marrow, Gas1CE, Gli1CE and Leprcre. n = 8 (Fgfr3CE-periosteum), n = 4 (Fgfr3CE-bone marrow), n = 3 (Gas1CE), n = 7 (Gli1CE), n = 8 (Leprcre) mice. Two-tailed, one-way ANOVA followed by Dunnett’s multiple comparison test. Survival curve of individual tdTomato+ clones over serial passages (right). n = 46 (Fgfr3CE-periosteum), n = 25 (Fgfr3CE-bone marrow), n = 41 (Gas1CE) clones. Log-rank (Mantel–Cox) test. d CFU-F assay of Fgfr3CE-tdTomato+ bone marrow cells at 1 week after the pulse at 8W or 9M, and Leprcre-tdTomato+ bone marrow cells at 8W and 9M. Scale bar: 5 mm. e Percentage of tdTomato+ colonies among total CFU-Fs across young and adult stages. Fgfr3CE (pulsed at P21, 8W, or 9M) or Leprcre bone marrow cells. Fgfr3CE: n = 4 (P21), n = 4 (8W), n = 6 (9M). Leprcre: n = 8 (P21), n = 5 (8W), n = 4 (9M). Two-tailed, Mann–Whitney’s U-test. f In vitro trilineage differentiation assay of Fgfr3CE-tdTomato+ clones (Passage 2–7). Left: Chondrogenic condition, Alcian Blue staining. Center: Osteogenic conditions, Alizarin Red staining. Right two panels: Adipogenic conditions, Oil red O (right center) and LipidTOX staining (rightmost), Green: LipidTOX-Alexa488, red: tdTomato. Scale bar: 200 µm. n = 17 clones. g qPCR analyses of Fgfr3CE-tdTomato+ clones, expression of chondrocyte markers (Acan, Col2a1), osteoblast markers (Sp7, Dmp1), adipocyte markers (Pparg, Adipoq) under chondrogenic, osteogenic and adipogenic conditions, respectively. n = 4 clones (#5, 6, 7, 17). Two-tailed, Mann–Whitney’s U-test. Data were presented as mean ± s.d. Exact P value is indicated in the figures. Source data are provided as a Source Data file.
Fig. 4
Fig. 4. Robust osteogenic capabilities of Fgfr3+ endosteal stromal cells in homeostasis.
a Diagram of lineage-tracing analyses of Fgfr3-creER+ and Gas1-creER+ cells. Right: a proposed model of bone marrow stromal cell differentiation. b, c Fgfr3-creER; R26RtdTomato (b) and Gas1-creER; R26RtdTomato (c) femur endosteal space at P23 (pulsed at P21) with Col1a1-GFP (left) and Cxcl12-GFP (right). Scale bar: 20 µm. n = 4 mice per each group. BM: bone marrow. d Flow cytometry analysis of CD45/Ter119/CD31neg bone marrow cells isolated from Fgfr3-creER; R26RtdTomato (left) and Gas1-creER; R26RtdTomato femurs (center) with Cxcl12-GFP (upper) or Col1a1-GFP (lower) at P23 (pulsed at P21). Cxcl12GFP/+; Lepr-cre; R26RtdTomato femurs at P21 (upper right) Lower right panel: Percentage of tdTomato+ cells among Cxcl12-GFP+ cells (tdTomato expression induced by Fgfr3-creER, Gas1-creER, or Lepr-cre). Two-tailed, one-way ANOVA followed by Tukey’s multiple comparison test. n = 5 (Fgfr3CE), n = 4 (Gas1CE), n = 5 (Leprcre) mice. e, f Col1a1-GFP; Fgfr3-creER; R26RtdTomato (e) and Col1a1-GFP; Gas1-creER; R26RtdTomato (f) distal femurs at P49 and 6M (pulsed at P21). Scale bar: 500 µm (left and center right), 20 µm (center left and right). n = 4 mice per each time point. BM: bone marrow. g Quantification of tdTomato+ bone marrow stromal cells (upper) and osteoblasts and osteocytes (lower) in marrow space at P49 and 6M, aligned based on distance from the growth plate. Fgfr3CE-tdTomato+ cells (red), Gas1CE-tdTomato+ cells (blue). n = 4 mice per each group. Two-tailed, Mann–Whitney’s U-test. h Flow cytometry analysis of CD45/Ter119/CD31neg bone marrow cells after 2 days, 1 week, 4 weeks, and 8 weeks of chase (pulsed at P21), isolated from Fgfr3-creER; R26RtdTomato (red line) or Gas1-creER; R26RtdTomato femurs (blue line). Percentage of lineage-marked tdTomato+ cells among Cxcl12-GFP+ cells (upper) and Col1a1-GFP+ cells (lower). n = 3 mice for Col1a1-GFP/Fgfr3-creER at P49 and P77, Col1a1-GFP/Gas1-creER at P23, Cxcl12-GFP/Fgfr3-creER at P77, Cxcl12-GFP/Gas1-creER at P49), n = 4 mice for Col1a1-GFP/Fgfr3-creER at P23 and P28, Col1a1-GFP/Gas1-creER at P28 and P49, Cxcl12-GFP/Fgfr3-creER at P28, Cxcl12-GFP/Gas1-creER at P23, P28, and P77, n = 5 mice for Col1a1-GFP/Gas1-creER at P77, Cxcl12-GFP/Fgfr3-creER at P23 and P49). Data were presented as mean ± s.d. Exact P value is indicated in the figures. Source data are provided as a Source Data file.
Fig. 5
Fig. 5. Fgfr3+ endosteal stem cells dictate active osteogenesis in injury.
a Diagram of experimental approaches to interrogate Fgfr3+ endosteal stromal cells in injury. b Drill-hole injury experiments. Timeline and histological analyses. Fgfr3-creER; R26RtdTomato (upper) or Gas1-creER; R26RtdTomato (lower) cortical bone at 2, 7, and 56 days after surgery with Cxcl12-GFP (Day 2 and 7) or Col1a1-GFP (Day 56). BM: bone marrow. Scale bar: 200 µm. n = 6 (Fgfr3CE at day 56), n = 4 (others). Lower left: percentage of Col1a1-GFP+tdTomato+ cells among total Col1a1-GFP+ cells at 56 days after surgery. Two-tailed, Mann–Whitney’s U-test. c Conditional inactivation of Wnt/β-catenin signaling in drill-hole injury. 3D-μCT images (upper) and histological images (lower) of Fgfr3 Control, Fgfr3-βCat cKO, Gas1 Control, and Gas1-βCat cKO injured femur diaphyseal cortical bones at 14 days after surgery. Bone volume/tissue volume (BV/TV) and bone mineral density (BMD) of the injured area (right). Scale bar: 200 µm. n = 3 (Fgfr3 Control), n = 5 (Fgfr3-βcat cKO), n = 4 (Gas1 Control, Gas1-βcat cKO) mice. Two-tailed, Mann–Whitney’s U-test. d Cortical surface crater injury experiments. Injured Fgfr3-creER; R26RtdTomato cortical bone at 7 days (with or without periosteum) and 28 days (with periosteum) after surgery. BM: bone marrow. Scale bar: 200 µm. n = 7 (day 7 without periosteum), n = 4 (day 7 with periosteum), n = 5 (day 28 with periosteum). Right: Percentage of tdTomato+ osteocytes within regenerated bones at day 56 (red: drill-hole from Fig.4b) and 28 (blue: crater with periosteum). Two-tailed, Mann–Whitney’s U-test. e Bone marrow ablation experiments for Fgfr3-creER; R26RtdTomato femurs. Timeline and histological analyses. Histology: Contralateral no-surgery control bone at day 0 (left). Ablated bone at 5 days after surgery (center 2 panels). Ablated bone with Col1a1-GFP at 14 days after surgery (right 2 panels). Scale bar: 500 µm (left, left center, right center), 20 µm (center, right). n = 4 mice per each group. Percentage of tdTomato+ cells in ablated or control femurs at 7 days after surgery (lower left). n = 8 mice. Two-tailed, Wilcoxon matched-pairs signed-rank test. f Drill-hole injury experiments for 9-month-old Fgfr3-creER; R26RtdTomato bone at 7 and 56 days after surgery. Scale bar: 200 µm. n = 4 (day 7), n = 8 (day 56). Right: Percentage of tdTomato+ osteocytes within regenerated cortical bones at day 56 (young mice from Fig.4b and 9-month-old mice). Two-tailed, Mann–Whitney’s U-test. Data were presented as mean ± s.d. Exact P value is indicated in the figures. Source data are provided as a Source Data file.
Fig. 6
Fig. 6. Self-renewal and trilineage potential of Fgfr3+ endosteal stem cells in transplantation.
a Diagram of transplantation experiments of ex vivo expanded single cell-derived Fgfr3+ endosteal stem cells, involving NSG recipient mice, subsequent surgeries, secondary CFU-F, and transplantation assays. b NSG recipient femur transplanted with Fgfr3-creER+ endosteal stem cells after 2 weeks (left), 4 weeks with ALPL and ACAN staining (center), and 16 weeks (right). Scale bar: 500 µm (left), 20 µm (center), 40 µm (right). n = 4 clones. c Drill-hole injury of NSG recipient mice transplanted with Fgfr3-creER+ stem cells, at 2 weeks after surgery with ALPL staining. Scale bar: 200 µm. n = 4 clones. d, e Complete fracture of NSG recipient mice transplanted with Fgfr3-creER+ stem cells, at 2 weeks after fracture with ALPL and ACAN staining (d, e), with LepR and PLIN staining (e). Arrows: tdTomato, ALPL, and ACAN triple-positive cells. Scale bar: 100 µm (d), 20 µm (e). n = 4 clones. f Secondary CFU-F assays. The survival rate of individual tdTomato+ clones harvested from NSG recipient mice with Fgfr3-creER+ stem cell transplantation (top). Representative images of passages 0 and 8 (bottom). Scale bar: 5 mm. n = 4 clones (#5: n = 17, #6: n = 11, #7: n = 7, #17: n = 12,). g Secondary transplantation of Fgfr3-creER+ stem cells to NGS recipient femur, at 4 weeks after transplantation. Arrows: osteocytes derived from transplanted tdTomato+ stem cells. Scale bar: 20 µm. n = 4 clones.
Fig. 7
Fig. 7. Fgfr3+ endosteal stromal cells develop aggressive osteosarcoma-like lesions upon p53 loss.
a Identification of potential cell-of-origin of osteosarcoma-forming cells by comparative p53-deficiency-induced bone tumorigenesis assays. bh Formation of osteosarcoma-like lesions by inducible p53 loss in Fgfr3-creER+ cells. b Representative 3D-μCT images of Fgfr3-p53 cKO hind limb (left) and femur (center left), Fgfr3-creER; Trp53fl/+; R26RtdTomato (Fgfr3 Control) femur (center right), and Osx-p53 cKO femur (right) at 9M (pulsed at P21). Inset: Gross appearance of the osteosarcoma-like lesion in Fgfr3-p53 cKO hind limb. Scale bar: 5 mm (left, inset), 500 μm (others). n = 5 (Fgfr3-p53 cKO, Fgfr3 Control), n = 4 (Osx-p53 cKO) mice. c Representative H&E (upper left), TRAP (lower left), and Safranin O staining (right) showing tumor cells with large and atypical nuclei and intact growth plates. Scale bar: 50 µm. n = 4 mice. d, e Representative fluorescent images of Fgfr3-p53 cKO hind limb (d) and femur (e) with Col1a1-GFP. Scale bar: 2 mm (d), 500 µm (e). n = 11 mice. f Fgfr3-p53 cKO bone marrow with endocortical scalloping (upper) and Cathepsin K immunostaining (lower). Scale bar: 20 µm. n = 4 mice. g Lineage-tracing analyses of p53-deficient osteosarcoma-forming cells. Osx-p53 cKO, Gli1-p53 cKO (pulsed at P21), Pthrp-p53 cKO (pulsed at P6), and Lepr-p53 cKO femur at 9M. Scale bar: 500 µm. n = 13 (Osx-p53 cKO), n = 10 (Gli1-p53 cKO), n = 8 (Pthrp-p53 cKO), n = 12 (Lepr-p53 cKO) femurs. h Survival rate of various p53 cKO mice (upper). n = 17 (Fgfr3-p53 cKO), n = 14 (Osx-p53 cKO), n = 5 (Gli1-p53 cKO), n = 7 (Pthrp-p53 cKO), n = 13 mice (Lepr-p53 cKO). Log-rank (Mantel–Cox) test. Quantification of tumor area relative to total marrow space in distinct cKO at 9M (lower). n = 11 (Fgfr3-p53 cKO), n = 13 (Osx-p53 cKO), n = 10 (Gli1-p53 cKO), n = 8 (Pthrp-p53 cKO), n = 12 (Lepr-p53 cKO) femurs. Two-tailed, one-way ANOVA followed by Tukey’s multiple comparison test. i Pairwise mWES CNV analyses. Fgfr3-p53 cKO osteosarcoma-like lesions (upper). Fgfr3-p53 cKO contralateral bone without osteosarcoma-like lesion (lower). Background control: Trp53fl/fl bone. X-axis: Autosomal chromosome position. Y-axis: Normalized count. Black dots: regions with a normal copy-number state. Blue dots: copy-number lost regions. Red dots: copy-number gained regions. Positions of known oncogenes and tumor suppressor genes with copy number changes are indicated with green lines. Gene symbols are colored by copy number status. Data were presented as mean ± s.d. Exact P value is indicated in the figures. Source data are provided as a Source Data file.
Fig. 8
Fig. 8. Single-cell characterization of Fgfr3+ cell-derived mouse osteosarcoma-like lesions.
ae Single-cell RNA-seq analyses of osteosarcoma-like lesions. a Diagram for LIGER data integration of single-cell RNA-seq datasets of lineage-traced tdTomato+ cells isolated from Fgfr3-creER; Trp53fl/+; R26RtdTomato (Fgfr3-p53 cHet) and Fgfr3-creER; Trp53fl/fl; R26RtdTomato (Fgfr3-p53 cKO) femurs at 4M (pulsed at P21). Fgfr3-p53 cHet: 1696 cells, Fgfr3-p53 cKO: 2015 cells, Total: 3711 cells. b UMAP visualization of major sub-clusters of the LIGER-integrated dataset. c UMAP visualization of two datasets integrated by LIGER. Blue: cHet, red: cKO. d Density plots of Fgfr3-p53 cHet (left) and Fgfr3-p53 cKO (right) in the integrated space. Red dotted contour: OCT Stem and Chondrocyte-like clusters predominantly contributed by Fgfr3-p53 cKO cells. e Split violin plots for Mki67 (proliferation), Acan (Chondro), Col1a1 (Osteo), and Cxcl12 (Reticular) in representative clusters (OCT Stem, Chondrocyte 1, Osteoblast 1, and Reticular 1) between cHet (blue) and cKO (red). n = 148 (OCT Stem), n = 26 (Chondro 1), n = 290 (Osteo 1), n = 469 (Reticular 1) cells in cHet. n = 426 (OCT Stem), n = 125 (Chondro 1), n = 177 (Osteo 1), n = 434 (Reticular 1) cells in cKO. f UMAP-based visualization of putative aneuploid cells inferred by CopyKAT. Blue: putative normal cells. Red: putative tumor cells. g Genome-wide visualization of copy number variations in putative tumor cells inferred by CopyKAT. h Hierarchical clustering of putative tumor cells with different patterns of copy number variation inferred by inferCNV. i REVIGO plot of gene ontology terms enriched among genes upregulated in putative tumor cells. The p values were calculated using GOrilla’s one-sided test based on the hypergeometric distribution, with a flexible p value cutoff applied for multiple testing correction. The results were subsequently transferred to REVIGO for visualization. j Mouse-human tumor data integration. Left: Diagram for LIGER data integration of single-cell RNA-seq datasets from mouse and human osteosarcoma cells. Center to the right: Fgfr3-p53 cKO scRNA-seq dataset was integrated with the human chondroblastic osteosarcoma scRNA-seq dataset (BC17). UMAP visualization of human chondroblastic and osteoblastic osteosarcoma cells in the integrated space (center left). Density plots of human (BC17) (center right) and mouse (right) tumor cells in the integrated UMAP space.
Fig. 9
Fig. 9. Unregulated self-renewal and aberrant osteogenic fates of tumorigenic Fgfr3+ endosteal stem cells.
a CFU-F assay of Fgfr3-p53 cHet and Fgfr3-p53 cKO bone marrow cells at P28 (pulsed at P21). Scale bar: 5 mm. n = 4 mice per each group. b Survival curve of individual tdTomato+ clones over serial passages among Fgfr3-WT (P23, red), Fgfr3-p53 cKO (P28, blue), and Fgfr3-p53 cKO (P4M, black). n = 36 (Fgfr3-WT P23), n = 35 (Fgfr3-p53 cKO P28), n = 18 (Fgfr3-p53 cKO P4M) clones. Log-rank (Mantel–Cox) test. c Duration to reach Passage 8. n = 5 (Fgfr3-WT P23), n = 29 (Fgfr3-p53 cKO P28), n = 12 (Fgfr3-p53 cKO P4M) clones. Two-tailed, one-way ANOVA followed by Tukey’s multiple comparison test. d, e Comparative bulk RNA-seq analysis of individual tdTomato+ clones, Fgfr3-WT (P23, n = 5 clones), Fgfr3-p53 cKO (P28, n = 5 clones) and Fgfr3-p53 cKO (P4M, n = 4 clones) clones. d Principal component analysis (PCA) plot of Fgfr3-WT (P23, light green), Fgfr3-p53 cKO (P28, blue) and Fgfr3-p53 cKO (P4M, light blue) clones. x-axis: PC1, 37.2% variance, y-axis: PC2, 14.2% variance. e Heatmap of representative differentially expressed genes (DEGs) associated with osteoblast differentiation, cell proliferation, and osteosarcomagenesis. Star: statistically significant difference among the three groups. n = 4 (Fgfr3-p53 cKO P4M), n = 5 (Fgfr3-WT P23, Fgfr3-p53 cKO P28) mice. A two-sided t-test, based on a beta-negative binomial distribution, was used to calculate the p values (corrected for multiple testing) with an FDR cutoff of 0.05 to identify DE for the bulk RNA-seq data. f Diagram of intrafemoral transplantation of individual Fgfr3-WT (P23) and Fgfr3-p53 cKO (P28) tdTomato+ clones to NSG recipient mice. g 3D-μCT of Fgfr3-WT (P23) and Fgfr3-p53 cKO (P28) transplanted femurs after 8 weeks of transplantation. Scale bar: 500 µm. n = 4 per each group. h Histology of recipient femurs. (Left): Transplantation of Fgfr3-WT (P23) clones after 8 weeks of transplantation. (Left center): Transplantation of Fgfr3-p53 cKO (P28) clones after 4 weeks (left center) and 8 weeks (right center) of transplantation. (Right): Magnified views of highly-trabecularized areas in recipient bone marrow, fluorescent, and H&E staining (right). Scale bar: 500 µm. n = 4 per each group. Data were presented as mean ± s.d. Exact P value is indicated in the figures. Source data are provided as a Source Data file.
Fig. 10
Fig. 10. Location and function of Fgfr3-expressing endosteal stem/stromal cells.
Fgfr3-expressing endosteal stem cells with osteoblast-chondrocyte transitional (OCT) identities in young bone marrow dictate active osteogenesis and aggressive tumorigenesis. The ambiguous state with epigenomic priming to differentiated cell types may be one of the unique features of skeletal stem cells that are responsible for producing a wide variety of cells of the skeletal cell lineage in physiological and pathological conditions.

References

    1. Salhotra A, Shah HN, Levi B, Longaker MT. Mechanisms of bone development and repair. Nat. Rev. Mol. Cell Biol. 2020;21:696–711. doi: 10.1038/s41580-020-00279-w. - DOI - PMC - PubMed
    1. Matsushita Y, Ono W, Ono N. Skeletal stem cells for bone development and repair: diversity matters. Curr. Osteoporos. Rep. 2020;18:189–198. doi: 10.1007/s11914-020-00572-9. - DOI - PMC - PubMed
    1. Sacchetti B, et al. Self-renewing osteoprogenitors in bone marrow sinusoids can organize a hematopoietic microenvironment. Cell. 2007;131:324–336. doi: 10.1016/j.cell.2007.08.025. - DOI - PubMed
    1. Morikawa S, et al. Prospective identification, isolation, and systemic transplantation of multipotent mesenchymal stem cells in murine bone marrow. J. Exp. Med. 2009;206:2483–2496. doi: 10.1084/jem.20091046. - DOI - PMC - PubMed
    1. Chan CK, et al. Identification and specification of the mouse skeletal stem cell. Cell. 2015;160:285–298. doi: 10.1016/j.cell.2014.12.002. - DOI - PMC - PubMed

Publication types