. 2023 Apr 25;13(1):6757.
doi: 10.1038/s41598-023-30466-6.

Natural aging and Alzheimer's disease pathology increase susceptibility to focused ultrasound-induced blood-brain barrier opening

Affiliations

Natural aging and Alzheimer's disease pathology increase susceptibility to focused ultrasound-induced blood-brain barrier opening

R L Noel et al. Sci Rep. .

Abstract

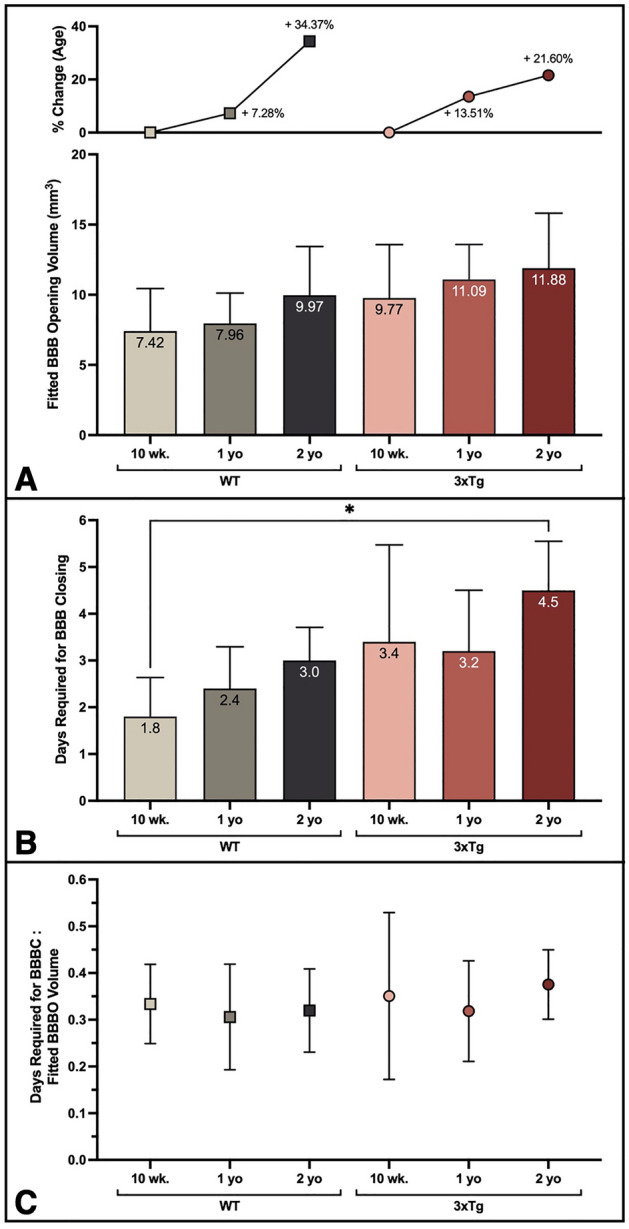
Focused Ultrasound (FUS) paired with systemically-injected microbubbles (μB) is capable of transiently opening the blood-brain barrier (BBBO) for noninvasive and targeted drug delivery to the brain. FUS-BBBO is also capable of modulating the neuroimmune system, further qualifying its therapeutic potential for neurodegenerative diseases like Alzheimer's disease (AD). Natural aging and AD impose significant strain on the brain and particularly the BBB, modifying its structure and subsequently, its functionality. The emerging focus on treating neurodegenerative diseases with FUS-BBBO necessitates an investigation into the extent that age and AD affect the BBB's response to FUS. FUS-BBBO was performed with a 1.5-MHz, geometrically focused transducer operated at 450 kPa and paired with a bolus microbubble injection of 8 × 10⁸ μB/mL. Here we quantify the BBBO, BBB closing (BBBC) timeline, and BBB permeability (BBBP) following FUS-BBBO in male mice with and without AD pathology, aged 10 weeks, one year, or two years. The data presented herein indicates that natural aging and AD pathology may increase initial BBBO volume by up to 34.4% and 40.7% respectively, extend BBBC timeline by up to 1.3 and 1.5 days respectively, and increase BBBP as measured by average Ktrans values up to 80% and 86.1% respectively in male mice. This characterization of the BBB response to FUS-BBBO with age and AD further clarifies the nature and extent of the functional impact of these factors and may offer new considerations for planning FUS-BBBO interventions in aged and AD populations.


Conflict of interest statement

Some of the work presented herein is supported by patents licensed to Delsona Therapeutics, Inc where E.E.K. serves as co-founder and scientific adviser. R.L.N, A.J.B., R.J., A.N.P., S.B. and A.R.K. declare no conflict of interest.

Figures

Figure 1
Figure 1
Experimental design. (A) Overview of experimental timeline and workflow. (Elements created with BioRender.com) (B) Experimental cohorts used throughout the study. WT and 3xTg mice aged 10 weeks, one year or two years were used for the present study, with 5–9 animals per group. (Created with BioRender.com) (C) Schematic of Focused Ultrasound setup. (Created with BioRender.com).
Figure 2
Figure 2
Age and AD produce trending increase in BBBO volume with consistent stable harmonic cavitation dose. (A) The mean stable harmonic cavitation dose (CDH) delivered to each group is shown. No significant differences were detected between groups (P > 0.05, one-way ANOVA with multiple comparisons). (B) The average initial BBBO volume for each cohort is shown. Differences between groups are not significant (P > 0.05, one-way ANOVA with multiple comparisons).
Figure 3
Figure 3
Linear regression of blood–brain barrier opening volume over time reveals increased fitted initial opening volume with age and AD. (A) BBBO targeting and representative MR axial and coronal images acquired at 24-h intervals after FUS-BBBO show the daily BBBO volume and progressive closing. (Elements created with BioRender.com) (B) Average BBBO volume and standard deviation is plotted as a function of time for WT and 3xTg cohorts (B) as well as for 10-week-old, one-year-old, and two-year-old cohorts (C). Linear regression analysis and statistical testing by ANCOVA was used to detect significant differences between fitted y-intercepts.
Figure 4
Figure 4
Age and AD elicit trending increase in fitted BBBO and prolonged BBBC timeline. (A) The average fitted y-intercept from individual linear regression plots of subjects from each cohort is plotted. The percent change for one- and two-year old cohorts of each genotype compared to the respective 10-week-old cohort is shown in the top plot. (B) The average time required for BBB closing following FUS-BBBO is shown for each cohort. (C) The ratio of the time required for BBBC to the fitted initial BBBO volume is shown for each cohort. Statistically significant differences are determined by one-way ANOVA with multiple comparisons.
Figure 5
Figure 5
Age and AD increase the measured mean and maximum Ktrans permeability coefficients in BBBO region. (A) The mean Ktrans value normalized by mean background value for each cohort is shown. (B) The normalized maximum Ktrans values are shown for each age and genotype group. (C) The average fraction of the ROI volume within the specified bin range is shown for each group. Significant differences from the two-year-old 3xTg cohort are indicated by asterisks. All statistically significant differences were determined by one-way ANOVA with multiple comparisons for (AC). (D) The average 2D Ktrans map from the middle slice of an ROI volume encompassing the BBBO focal volume is shown for each cohort. Ktrans maps have been normalized by baseline Ktrans values.

References

    1. Daneman R, Prat A. The blood-brain barrier. Cold Spring Harb. Perspect Biol. 2015;7:a020412. doi: 10.1101/cshperspect.a020412. - DOI - PMC - PubMed
    1. Costea L, Mészáros Á, Bauer H, et al. The blood-brain barrier and its intercellular junctions in age-related brain disorders. Int. J. Mol. Sci. 2019;20:5472. doi: 10.3390/ijms20215472. - DOI - PMC - PubMed
    1. Erdő F, Denes L, de Lange E. Age-associated physiological and pathological changes at the blood–brain barrier: A review. J. Cereb. Blood Flow Metab. 2017;37:4–24. doi: 10.1177/0271678X16679420. - DOI - PMC - PubMed
    1. Pardridge WM. The blood-brain barrier: Bottleneck in brain drug development. NeuroRx. 2005;2:3–14. doi: 10.1602/neurorx.2.1.3. - DOI - PMC - PubMed
    1. Pardridge WM. Drug transport across the blood–brain barrier. J. Cereb. Blood Flow Metab. 2012;32:1959–1972. doi: 10.1038/jcbfm.2012.126. - DOI - PMC - PubMed

Publication types