. 2023 Apr 25;13(1):6709.
doi: 10.1038/s41598-023-33777-w.

A hybrid multi-particle approach to range assessment-based treatment verification in particle therapy

Affiliations

A hybrid multi-particle approach to range assessment-based treatment verification in particle therapy

Ilker Meric et al. Sci Rep. .

Abstract

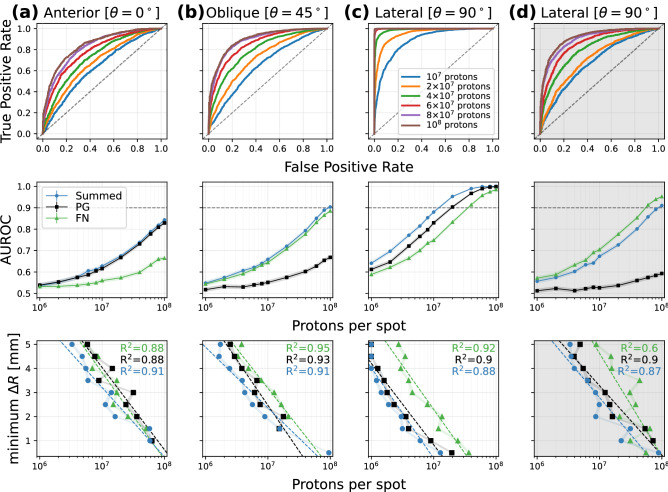
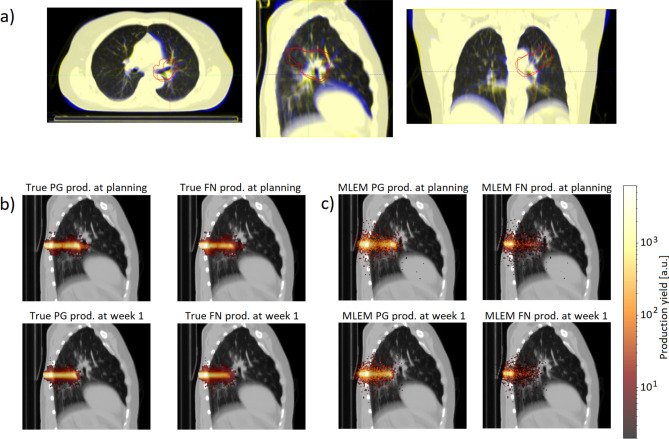
Particle therapy (PT) used for cancer treatment can spare healthy tissue and reduce treatment toxicity. However, full exploitation of the dosimetric advantages of PT is not yet possible due to range uncertainties, warranting development of range-monitoring techniques. This study proposes a novel range-monitoring technique introducing the yet unexplored concept of simultaneous detection and imaging of fast neutrons and prompt-gamma rays produced in beam-tissue interactions. A quasi-monolithic organic detector array is proposed, and its feasibility for detecting range shifts in the context of proton therapy is explored through Monte Carlo simulations of realistic patient models and detector resolution effects. The results indicate that range shifts of [Formula: see text] can be detected at relatively low proton intensities ([Formula: see text] protons/spot) when spatial information obtained through imaging of both particle species are used simultaneously. This study lays the foundation for multi-particle detection and imaging systems in the context of range verification in PT.


Conflict of interest statement

The authors declare no competing interests.

Figures

Figure 1
Figure 1
An illustration of the conceptual NOVCoDA design and the analysis workflow. (A) A virtual 3D patient model (a patient with non-small cell lung cancer) is imported into the MC simulation environment. (B) A mono-energetic proton pencil beam is then directed at the target volume. (C) Secondary FNs and PGs are tracked from their points of origin, through the patient geometry and the sensitive volume of the NOVCoDA. Also shown is the conceptual design of the NOVCoDA. (D) To enable kinematic reconstruction of event cones, triple and double coincidences are required for PGs and FNs, respectively. Event cones are back projected onto a plane coinciding with the proton beam axis. The back projection is followed by image reconstruction resulting in 2D FN and PG production distributions. (E) The 2D production distributions are projected onto a single dimension resulting in 1D histograms of FN and PG distributions as a function of depth in the patient geometry, i.e. along the primary proton beam direction. (F) The 1D distributions are then used to calculate a range landmark (RL) parameter that can be related to the primary proton beam range and thereby potential range shifts. (G) A bootstrapping procedure combined with a Gaussian Naive Bayes classifier is implemented to estimate the distributions of the calculated RLs and quantify range-shift-resolving capabilities of the NOVCoDA.
Figure 2
Figure 2
2D and 1D ground truth distributions of detected FNs and PGs. (a, b) 2D ground truth distributions of successfully detected FNs and PGs obtained for the laterally positioned NOVCoDA (θ=90). Also shown are the combined distributions (c), the difference between FN and PG distributions (e), the difference between PG and FN distributions (f) as well as a 1D projection of the production distributions of detected FNs and PGs along the incident proton beam axis (d). Clearly, both the 1D and 2D the distributions indicate that FNs predominate the overall response at shallower depths whereas PGs predominate near the end of range of the incident proton beam.
Figure 3
Figure 3
Generation of RL distributions from FN and PG production data. The figure illustrates the procedures utilized to obtain RL distributions. First, the true FN points of origin in the patient, (a), are mapped onto a 1D histogram along the incident proton beam direction. Examples of such histograms are shown in (b) for true proton beam range shifts of 0mm and 1mm at proton intensities of 108 and 107. From these distributions, individual RLs are calculated. Then, sub-sampling bootstrapping is used to obtain a distribution of RLs at varying proton intensities. Example RL distributions are shown in (c) for proton intensities of 108 and 107. The distributions get wider at lower proton intensities with a resulting increase in overlapping portions. Although the example illustrates the use of FN data, the procedure is the same for PG data. Note also that the procedure is similar for reconstructed FN and PG distributions with the difference being the mapping of reconstructed FN and PG production distributions in 2D onto a 1D histogram.
Figure 4
Figure 4
The correlation between the true range shifts and ΔRL¯. (a) Shows the true range shifts against the mean of the calculated range shifts, ΔRL¯, from the true distributions of detected FNs. (b) Shows the true range shifts against ΔRL¯ from the reconstructed distributions of detected FNs along with the residuals. For both (a) and (b), ΔRL¯ are calculated for a proton intensity of 108 protons/spot. Use of the true distributions predicts a nearly perfect linear relationship between the true range shifts and ΔRL¯. The same can be said to be true for the relation between the true range shifts and ΔRL¯ values estimated from the reconstructed distributions in spite of increased fluctuations reflected in the lower panel showing the residuals.
Figure 5
Figure 5
Receiver Operating Characteristic (ROC) curves, and average Area Under ROC (AUROC¯) curves for a range shift of 0.5mm and minimum detectable range shifts. The upper panel shows the ROC curves evaluated at a range shift magnitude of 0.5mm for the reconstructed FN and PG combined data-set. The middle panel shows the calculated AUROC¯ for the same data-set at the same range shift magnitude. The lower panel shows the minimum detectable range shifts as a function of the number of protons per spot. Note that ROCs are only plotted for proton intensities ranging from 107 protons/spot to 108 protons/spot whereas AUROC¯ and minimum ΔR are plotted for proton intensities ranging from 106 protons/spot to 108 protons/spot. Each of these are shown for a NOVCoDA orientation of θ=0 (a), θ=45 (b) and θ=90 (c), as well as the θ=90 case with the estimated effects of time, energy, and position resolutions (and segmentation of a realistic detector) included in (d). The uncertainties in terms of one standard deviation are shown as bands around the AUROC¯ values.
Figure 6
Figure 6
Example of treatment deviation caused by anatomical changes. (a) The axial, sagittal and coronal plane of the example patient with the average intensity projection of the 4D planning CT (yellow) overlaid on the repeat CT (blue). The target volume contoured by the treating oncologist on both CTs are visible as red contours. Both a shift and deformation of the target volume with corresponding change in tissue densities can be observed. The lungs are larger on the planning compared to the repeat CT indicating a shallower breathing pattern during acquisition of the latter. (b) PG and FN production, both from MC truth and reconstructed with MLEM, from the planning CT (top) and when produced in the week 1 CT, overlaid on the planning CT (bottom).
Figure 7
Figure 7
AUROC¯ curves for the clinical case at three different orientations of the NOVCoDA with respect to direction of the incident proton beam. The figure summarizes the calculated AUROC¯ values using only FN and only PG distributions reconstructed using the LM-MLEM algorithm as well as for the combination of FN and PG distributions for an orientation of θ=0 (a), θ=45 (b) and θ=90 (c), as well as the θ=90 case with the estimated effects of time, energy, and position resolutions (and segmentation of a realistic detector) included in (d). Statistical uncertainties in terms of one standard deviation of the AUROC¯ are also shown explicitly as a narrow band around each curve.

References

    1. Jermann, M. Particle Therapy Patient Statistics (per end of 2021) (PTCOG, 2021). https://ptcog.ch.
    1. Paganetti H. Range uncertainties in proton therapy and the role of monte carlo simulations. Phys. Med. Biol. 2012;57:R99–R117. doi: 10.1088/0031-9155/57/11/R99. - DOI - PMC - PubMed
    1. van de Water S, et al. The price of robustness; impact of worst-case optimization on organ-at-risk dose and complication probability in intensity-modulated proton therapy for oropharyngeal cancer patients. Radiother. Oncol. 2016;120:56–62. doi: 10.1016/j.radonc.2016.04.038. - DOI - PubMed
    1. Tattenberg S, Madden TM, Bortfeld T, Parodi K, Verburg J. Range uncertainty reductions in proton therapy may lead to the feasibility of novel beam arrangements which improve organ-at-risk sparing. Med. Phys. 2022;49:4693–4704. doi: 10.1002/mp.15644. - DOI - PubMed
    1. Tattenberg S, et al. Proton range uncertainty reduction benefits for skull base tumors in terms of normal tissue complication probability (NTCP) and healthy tissue doses. Med. Phys. 2021;48:5356–5366. doi: 10.1002/mp.15097. - DOI - PubMed

Publication types