. 2023 Apr 25;14(1):2378.
doi: 10.1038/s41467-023-37992-x.

Isthmin-1 (Ism1) modulates renal branching morphogenesis and mesenchyme condensation during early kidney development

Affiliations

Isthmin-1 (Ism1) modulates renal branching morphogenesis and mesenchyme condensation during early kidney development

Ge Gao et al. Nat Commun. .

Abstract

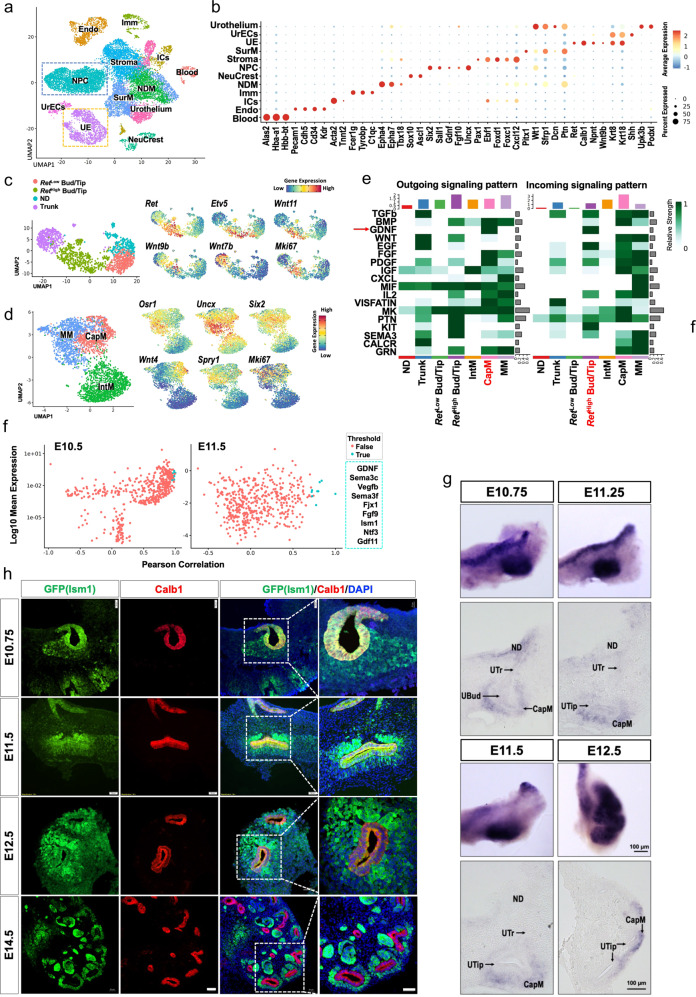
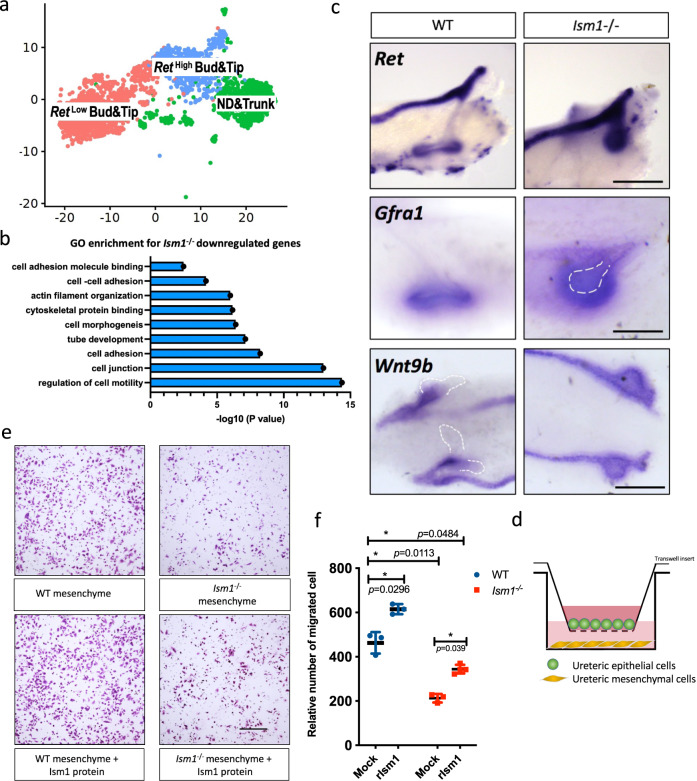
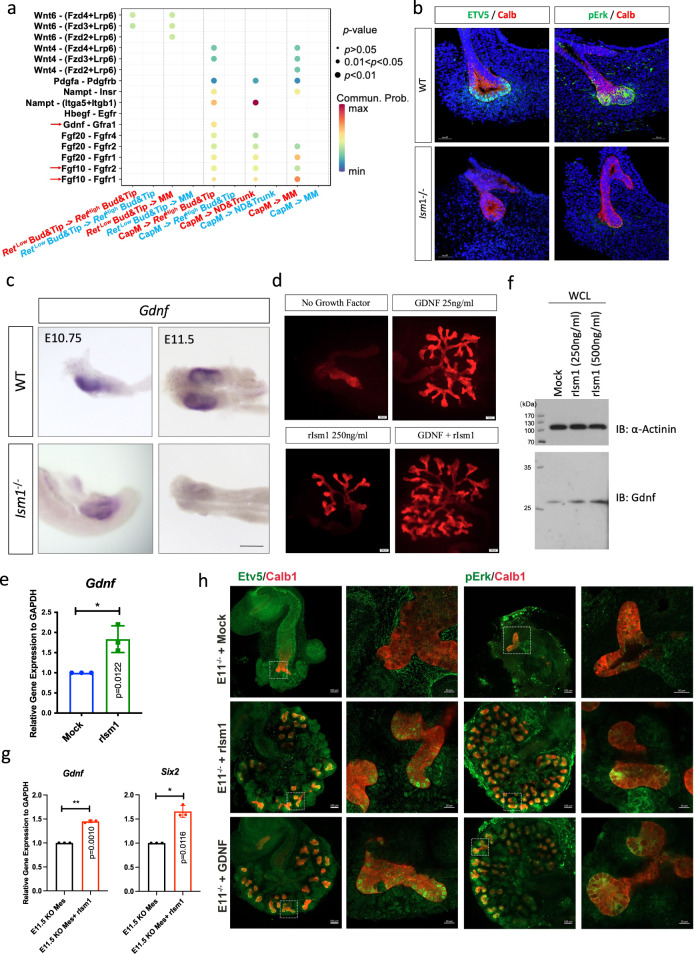
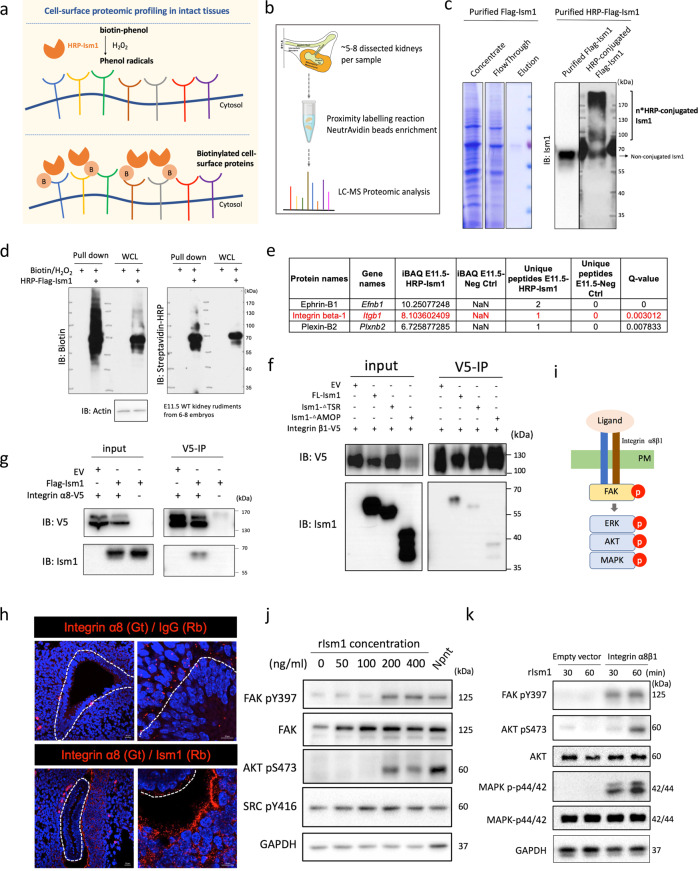
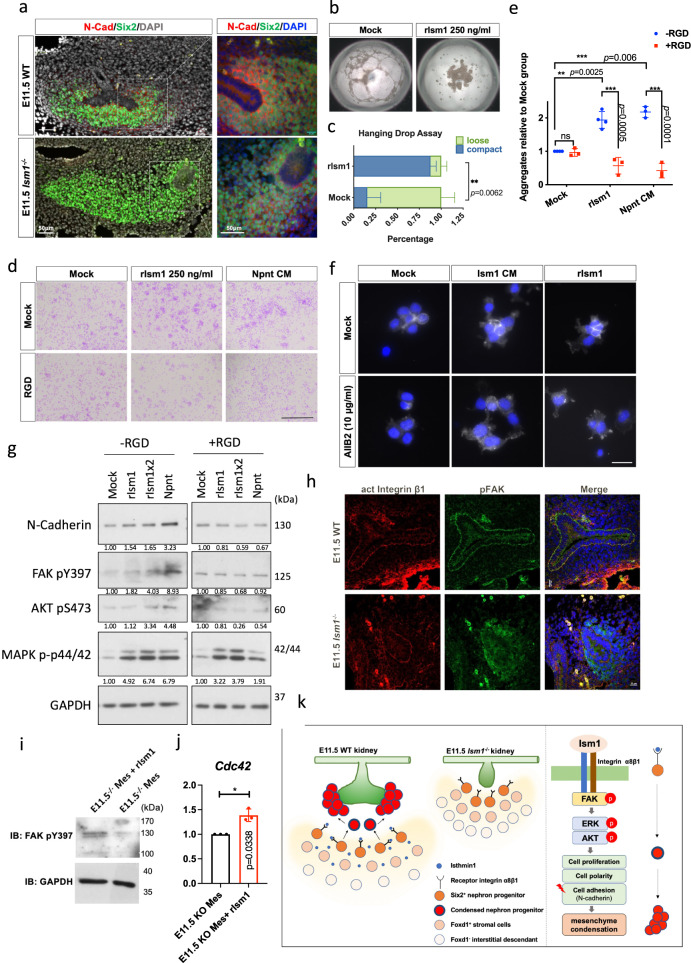
The outgrowth of epithelial bud followed by reiterated bifurcations during renal development is driven by the ligand-receptor interactions between the epithelium and the surrounding mesenchyme. Here, by exploring ligand-receptor interactions in E10.5 and E11.5 kidneys by single cell RNA-seq, we find that Isthmin1 (Ism1), a secreted protein, resembles Gdnf expression and modulates kidney branching morphogenesis. Mice deficient for Ism1 exhibit defective ureteric bud bifurcation and impaired metanephric mesenchyme condensation in E11.5 embryos, attributable to the compromised Gdnf/Ret signaling, ultimately leading to renal agenesis and hypoplasia/dysplasia. By HRP-induced proximity labelling, we further identify integrin α8β1 as a receptor of Ism1 in E11.5 kidney and demonstrate that Ism1 promoted cell-cell adhesion through interacting with Integrin α8β1, the receptor whose activation is responsible for Gdnf expression and mesenchyme condensation. Taken together, our work reveals Ism1 as a critical regulator of cell-cell interaction that modulates Gdnf/Ret signaling during early kidney development.


Conflict of interest statement

The authors declare no competing interests.

Figures

Fig. 1
Fig. 1. Identification of Ism1 as a candidate that co-expressed with Gdnf in the emergence of renal branching morphogenesis.
a UMAP plot showing 12 different cell types based on widely accepted markers in E10.5 and E11.5 kidneys. Cell type acronyms are shown in different colors. Endo endothelial cells, ICs interstitial cells, Imm immune cells, NDM nephric duct surrounding mesenchyme, NPC nephric progenitor cells, NeuCrest neural crest cells, SurM surrounding mesenchyme, UE ureteric epithelial cells, UrECs urothelium and ureter epithelial cells. b Dot plot depicting the expression of the marker genes in different cell types identified. c UMAP plots of different cell types in UE lineage and the distribution of individual marker gene in UE. d UMAP plots of different cell types in NPC lineage and the distribution of individual marker gene in NPC. e Crosstalk analysis between UE and NPC lineage within sub-clusters. Arrows indicate GDNF ligand which was secreted from CapM (red) and received by RetHigh Bud/Tip (red). f Pearson correlation coefficient analysis of Gdnf in NPC lineage, candidates identified in both E10.5 and E11.5 samples are labelled as true (Pearson correlation >0.9 at E10.5 samples and >0.7 at E11.5 samples), listed in a green dotted box. Source data are provided as a Source Data file. g Examination of Ism1 expression pattern by in situ hybridization at E10.75, E11.25, E11.5 and E12.5. Scale bar, 100 μm. Similar results are observed from at least 3 biologically independent experiments. ND nephric duct, UTr ureteric trunk, Ubud ureteric bud, UTip ureteric tip, CapM cap mesenchyme. h Examination of Ism1 expression by immunostaining from E10.75 to E14.5 in Ism1+/− mice. GFP represents endogenous Ism1 expression. Scale bar, 50 μm. Similar results are observed from at least 3 biologically independent experiments.
Fig. 2
Fig. 2. Ism1 is required for renal branching morphogenesis.
a Renal agenesis, hypoplasia and dysplasia shown in adult Ism1−/− mice. b The percentage of abnormal kidney development in Ism1−/− mice from E14.5 to P0 (N = 171). URA unilateral renal agenesis, BRA bilateral renal agenesis. c, d Cleaved-caspase3 staining in E12.5 kidney rudiments to detect apoptosis in Ism1−/− mice (c) and quantification of Cleaved-caspase3 positive cells in mesenchyme of kidney rudiments from both WT and Ism1−/− embryos (d). Scale bar, 50 μm. Data are presented as mean ± SD from n = 9 (WT) and n = 9 (Ism1−/−). Data are from at least 3 biologically independent experiments as indicated. Statistical significance was determined using unpaired t test, two-tailed p = 0.0047. e Schematic diagram of the initiation and the first branching event during early kidney development from E10.0 to E11.5. ND nephric duct, IntM intermediate mesenchyme, UBud ureteric bud, MMes metanephric mesenchyme, UTr ureteric trunk, UTip ureteric tip. f Whole-mount immunostaining of Calbindin1 (epithelium marker) from E10.0 to E11.5 in both WT and Ism1−/− mice. g H&E staining of E11.5 kidney sections from WT and Ism1−/− embryos, white dotted area indicates condensed mesenchyme in WT embryos which was absent in Ism1−/− embryos. hk Calbindin1 staining of E10.5 and E11.5 kidney explants cultured for 72 h or 96 h in the presence or absence of rIsm1 at the concentration of 250 ng/ml. Scale bar, 100 μm. l Schematic diagram showing the skeleton of branching tree. Red point indicates the branching point. The number indicates the branching cycle. m, n Quantifications of branching tips and branching points per E11.5 kidney rudiment upon 72 h treatment of rIsm1, in both WT and Ism1−/− mice. Data are presented as mean ± SD from n = 18 (WT, 9 were cultured in the presence of rIsm1) and n = 18 (Ism1−/−, 9 were cultured in the presence of rIsm1). Data are from at least 3 biologically independent experiments as indicated. Statistical significance was determined using two-way ANOVA, and corrections for multiple comparisons were performed with Tukey (adjusted p values are indicated in the figure). Source data are provided as a Source Data file.
Fig. 3
Fig. 3. Difference in UE lineage between wild-type and Ism1−/− mice during early kidney development.
a UMAP plots of different cell types in UE lineage from both WT and Ism1−/− mice. b GO enrichment of downregulated DEGs in RetHigh Bud&Tip sub-cluster in Ism1−/− kidney rudiment, as compared with WT. See Supplementary Data 3 for the full list of downregulated DEGs. c In situ hybridization of ureteric epithelial markers in E11.5 kidney rudiments, from both WT and Ism1−/− mice. Scale bars, 200 µm. d Diagram of the ureteric epithelial cell migration assay. Ureteric epithelial cells were plated in the upper well of a trans-well device. Mesenchymal cells, Ism1-null mesenchymal cells were plated in the lower wells in the presence or absence of rIsm1. ef Crystal violet staining of ureteric epithelial cells migrated to the lower well (e) and quantification (f). Scale bar, 100 µm. Data are presented as mean ± SD from three independent experiments. Images of migrated CMUB-1 cells were obtained from five to eight random views per experiment. Statistical significance was determined using two-way ANOVA, and corrections for multiple comparisons were performed with Tukey (adjusted p values are indicated in the figure). Source data are provided as a Source Data file.
Fig. 4
Fig. 4. Difference in NPC lineage between WT and Ism1−/− mice during early kidney development.
a UMAP plots of different cell types in NPC lineage from both WT and Ism1−/− embryos. b GO enrichment of downregulated DEGs of CapM and MM sub-clusters in Ism1−/− kidney compared with the WT at E10.5. See Supplementary Data 4 and 5 for the full list of downregulated DEGs in MM and CapM, respectively. c Violin plot showing the expression of the mesenchyme marker genes in sub-cluster of NPC lineage at E10.5. d Immunostaining of Itgα8, Six2 and Calb1 in WT and Ism1-/- kidney rudiments at E11.5. Arrow indicated the boundary between epithelium and mesenchyme. Scale bar, 50 µm. The right panel showed a higher magnification of the areas indicated in the left panel. e The cell shape and orientation in UB-surrounding mesenchyme in E11.5 WT and Ism1−/− kidney were analyzed by ImageJ from Itgα8 staining. f Validation of downregulated DEGs by whole-mount in situ hybridization. Six2 and Sall1 expression in the kidney rudiments at E11 in wild-type and Ism1−/− embryos. The white dotted lines highlighted the ureteric epithelium. Scale bar, 200 µm. g BrdU staining in sections of kidney rudiments from Ism1−/− and littermate control embryos Ism1+/− at E11. Higher magnification showed the region framed in white. Scale bars, 50 µm. h, i Quantifications of BrdU-positive cells in the ureteric epithelium (left) and metanephric mesenchyme (right) from Ism1−/− (n = 4) and littermate controls (n = 6) at E11. Images were obtained from three to five random views per kidney rudiment. Statistical significance was determined using the unpaired t-test with the two-tailed p value as shown in figure, error bars are ± SD. Source data are provided as a Source Data file.
Fig. 5
Fig. 5. Attenuated Gdnf/Ret signaling in Ism1−/− mice.
a Comparison of crosstalk between UE and NPC lineage in WT and Ism1−/− kidney rudiments. Dot color represents communication probabilities and dot size represents computed p-value. Empty space indicates that the communication probability is zero. p-values are computed from one-sided permutation test. b E11.5 kidney sections from WT (top) and Ism1−/− mice (bottom) were immunostained with Calb1 (Red) and Etv5 (Green) or pErk (Green). Scale bars, 50 µm. c In situ hybridization of Gdnf in E10.75 and E11.5 kidney rudiments from Ism1−/− and WT mice. Scale bar, 200 μm. d Calbindin1 staining of Kidney rudiments explants from E11.5 Ism1−/− embryos cultured for 72 h in the presence or absence of Gdnf (25 ng/ml) and rIsm1 (250 ng/ml). Scale bars, 100 µm. e, f Gdnf expression detected by qPCR (e) and Western Blotting (f) upon Ism1 treatment (48 h) in CMMM-1 cell line. WCL, whole cell lysis. g Expression of Gdnf and Six2 detected by qPCR upon rIsm1 treatment for 48 h in primary mesenchymal cells isolated from E11.5 Ism1−/− kidney rudiments. Data (e, g) were obtained from 3 biologically independent experiments; error bars are ± SD. Statistical significance was determined using the unpaired t-test with two-tailed p value as shown in figure. Source data are provided as a Source Data file. h Immunostaining of Calb1 (Red) and Etv5 (Green) or pErk (Green) in E11 Ism1−/− kidney explants in the presence of rIsm1 or GDNF for 96 h. Scale bars, 100 µm or 20 µm as labeled.
Fig. 6
Fig. 6. Ism1 enhances Gdnf/Ret signaling through a potent “Integrin-like” pathway.
a Proximity labelling of peroxidase-based approach. Biotin-phenol was oxidized into reactive phenoxyl radicals with hydrogen peroxide existence, thus enabling the proximal labelling. b Proteomic workflow for mapping protein-protein interaction. Proximity labelling enzyme fused to Ism1 and reacts in E11.5 kidney tissues. Biotinylated proteins are enriched and analyzed by LC-MS. c Production and purification of HRP-conjugated Flag-Ism1 protein. Coomassie blue staining indicated the purified Flag-Ism1 protein from concentrated conditioned medium. Western blotting stained for Ism1 indicated the HRP-conjugated Flag-Ism1 and the efficiency of HRP conjugation is approximately 70% (the size of HPR-conjugated protein shifted from 70 kDa to 110 kDa and even over 170 kDa). d Biotinylated proteins from a proximity labeling experiment analyzed by biotin and streptavidin-HRP blot in E11.5 wild-type kidney rudiments. Clear changes in band pattern were observed for HRP-Flag-Ism1 treated samples compared with ligand-free samples. WCL, whole cell lysis. e Potential receptors identified by proximity labelling with mass spectrometry analysis. Summary of the mass spectrometry analysis was provided in Supplementary Data 7. f HEK293T cells overexpressed with Integrin β1 and Ism1 truncation. Co-IP showed that the Integrin β1 cannot pull down full-length Ism1, TSR-deleted Ism1 and AMOP-deleted Ism1. g HEK293T cells overexpressed with Integrin α8 and Ism1 truncation. Co-IP showed that the Integrin α8 can pull down full-length Ism1 and AMOP-deleted Ism1. h Interaction between Integrin α8 and Ism1 were confirmed in situ by PLA with E11.5 wild-type kidney samples. Negative control was prepared with antibodies of Integrin α8 and IgG (Rb). i Model of canonical Integrin signaling. Upon the ligand binding to the integrin heterodimer, the signaling was activated by triggering phosphorylation of FAK, followed by phosphorylation of Erk, Akt and Mapk. PM, plasma membrane. j HEK293T cells transiently transfected with Integrin α8β1 were treated with rIsm1 for the indicated concentration and Npnt protein for 15 min. Integrin signaling downstream phosphorylation was detected by Western Blotting. k HEK293T cells transiently transfected with empty vector or Integrin α8β1 were treated with rIsm1 for the indicated time points. Integrin signaling downstream phosphorylation was detected by Western Blotting.
Fig. 7
Fig. 7. Ism1 promotes mesenchyme cell aggregation through Integrin.
a Immunostaining of N-cadherin and Six2 in E11.5 kidney sections from WT or Ism1−/− mice. Left panel scale bars, 50 μm. Right panel scale bars, 20 μm. b, c Bright field of hanging drop assay of CMMM-1 cells in the presence or absence of rIsm1 for 24 h (b). Scale bars, 200 μm. Quantitative data are shown according to the bright field of hanging drop assay (c). Quantification of (b). Data from 3 independent experiments and each group contains at least 20 drops for analysis. d Crystal violet staining of aggregation assay in CMMM-1 cells. For the aggregation assay, CMMM-1 cells were pretreated with RGD peptide or saline and then subjected to rIsm1 or Npnt CM. CM conditioned medium. e Quantification of (d). Data from 3 independent experiments. Data are presented as mean ± SD from three independent experiments. Statistical significance was determined using two-way ANOVA, and corrections for multiple comparisons were performed with Sidak (adjusted p values are indicated in the figure). Source data are provided in Source Data file. f Immunostaining of N-cadherin in the aggregation assay of CMMM-1 cells. CMMM-1 cells treated with either Ism1 conditioned medium (CM) or rIsm1, in the presence or absence of AIIB2, the blocking antibody of Integrin β1. g CMMM-1 cells were serum starved with FreeStyle293 medium for 4 h followed by pretreatment with RGD peptide or saline. Cells were treated with either rIsm1 or Npnt conditioned medium for 30 min followed by Western blotting to detect N-cadherin protein and the phosphorylation of integrin downstream targets. h Immunostaining of active form of Integrin β1 and pFAK in E11.5 kidney sections from WT or Ism1−/− mice. Scale bars, 20 μm. i, j Phosphorylation of FAK at Y397 detected by Western Blotting (i) and Cdc42 expression detected by qPCR (j) in primary mesenchymal cells isolated from E11.5 Ism1−/− kidney rudiments, in the presence or absence of rIsm1 for 48 h. k Schematic model for Ism1-mediated Integrin regulation of cell-cell adhesion in renal mesenchyme.

References

    1. Vetter MR, Gibley CW., Jr Morphogenesis and histochemistry of the developing mouse kidney. J. Morphol. 1966;120:135–155. doi: 10.1002/jmor.1051200203. - DOI - PubMed
    1. McMahon, A.P. Development of the mammalian kidney. In essays on developmental biology, part B 117, 31-64 (2016). - PMC - PubMed
    1. Little, M. H. & McMahon, A. P. Mammalian kidney development: principles, progress, and projections. Cold Spring Harb Perspect Biol.4, a008300 (2012). - PMC - PubMed
    1. Dressler GR. Advances in early kidney specification, development and patterning. Development. 2009;136:3863–3874. doi: 10.1242/dev.034876. - DOI - PMC - PubMed
    1. Goodwin, K. & Nelson, C. M. Branching morphogenesis. Development147, dev184499 (2020). - PubMed

Publication types

MeSH terms

Substances