

The increase in intensity and frequency of surface air temperature extremes throughout the western South Atlantic coast
- PMID: 37185936
- PMCID: PMC10130182
- DOI: 10.1038/s41598-023-32722-1
The increase in intensity and frequency of surface air temperature extremes throughout the western South Atlantic coast
Abstract
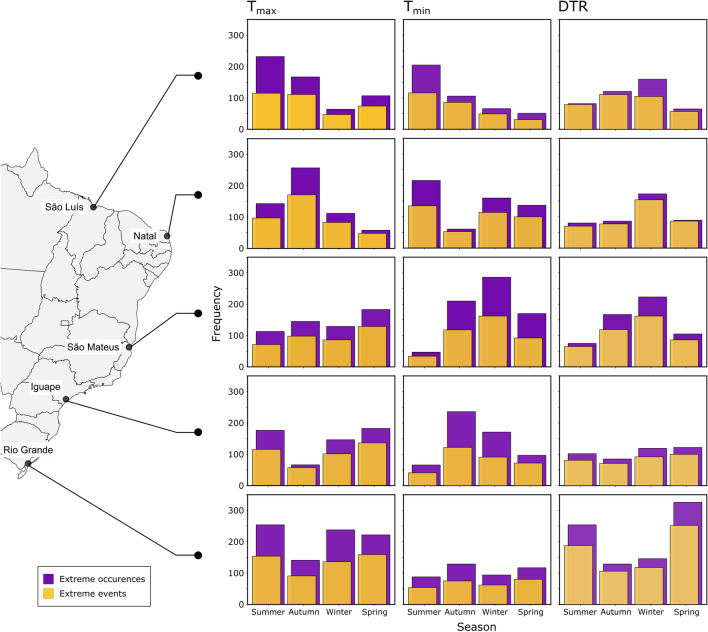
The climate is changing. At this stage, it is important to specify an 'extreme' climate and identify patterns that indicate its potential harm worldwide, including the coastal zones. Herein, we considered extremes based on the "Peaks Over Threshold" method from the "Extreme Value Theory". We looked after geographical patterns of surface air temperature (SAT) extremes (e.g., Tmax, Tmin, daily temperature range (DTR), and inter-daily temperature range) over the last 40 years throughout the Brazilian coast. Overall, we found a trend increase in intensity and frequency, but the duration was barely affected. The latitudinal pattern of extremes and the temperatures considered extremes followed the settled perception that areas in higher latitudes will be more affected by the extent of warming. Additionally, the seasonal pattern of DTR demonstrated to be a good approach to make inferences about air mass changes, but joint analyses on extremes with other atmospheric variables are desirable. Given the potential effects of extreme climates on society and natural systems over the world, our study highlights the urge for action to mitigate the effects of the increase in SAT in coastal zones.
© 2023. The Author(s).
Conflict of interest statement
The authors declare no competing interests.
Figures


References
-
- IPCC. IPCC 2021: Climate Change 2021: The Physical Science Basis. Working Group I Contribution to the IPCC Sixth Assessment Report. The Physical Science Basis. Contribution of Working Group 1 to Sixth Assessment Report of the Intergovernmental Panel on Climate Change. 10.1017/9781009157896 (2021).
-
- Swain DL, Singh D, Touma D, Diffenbaugh NS. Attributing Extreme Events To Climate Change: A new frontier in a warming world. One Earth. 2020;2:522–527. doi: 10.1016/j.oneear.2020.05.011. - DOI
-
- Marengo JA, Jones R, Alves LM, Valverde MC. Future change of temperature and precipitation extremes in South America as derived from the PRECIS regional climate modeling system. Int. J. Climatol. 2009;29:2241–2255. doi: 10.1002/joc.1863. - DOI
-
- Kharin VV, et al. Risks from climate extremes change differently from 1.5°C to 2.0°C depending on rarity. Earths Future. 2018;6:704–715. doi: 10.1002/2018EF000813. - DOI
Grants and funding
LinkOut - more resources
Full Text Sources
Research Materials
