. 2023 Nov;19(11):5048-5073.
doi: 10.1002/alz.13063. Epub 2023 Apr 26.

FDA-approved carbonic anhydrase inhibitors reduce amyloid β pathology and improve cognition, by ameliorating cerebrovascular health and glial fitness

Affiliations

FDA-approved carbonic anhydrase inhibitors reduce amyloid β pathology and improve cognition, by ameliorating cerebrovascular health and glial fitness

Elisa Canepa et al. Alzheimers Dement. 2023 Nov.

Erratum in

Abstract

Introduction: Cerebrovascular pathology is an early and causal hallmark of Alzheimer's disease (AD), in need of effective therapies.

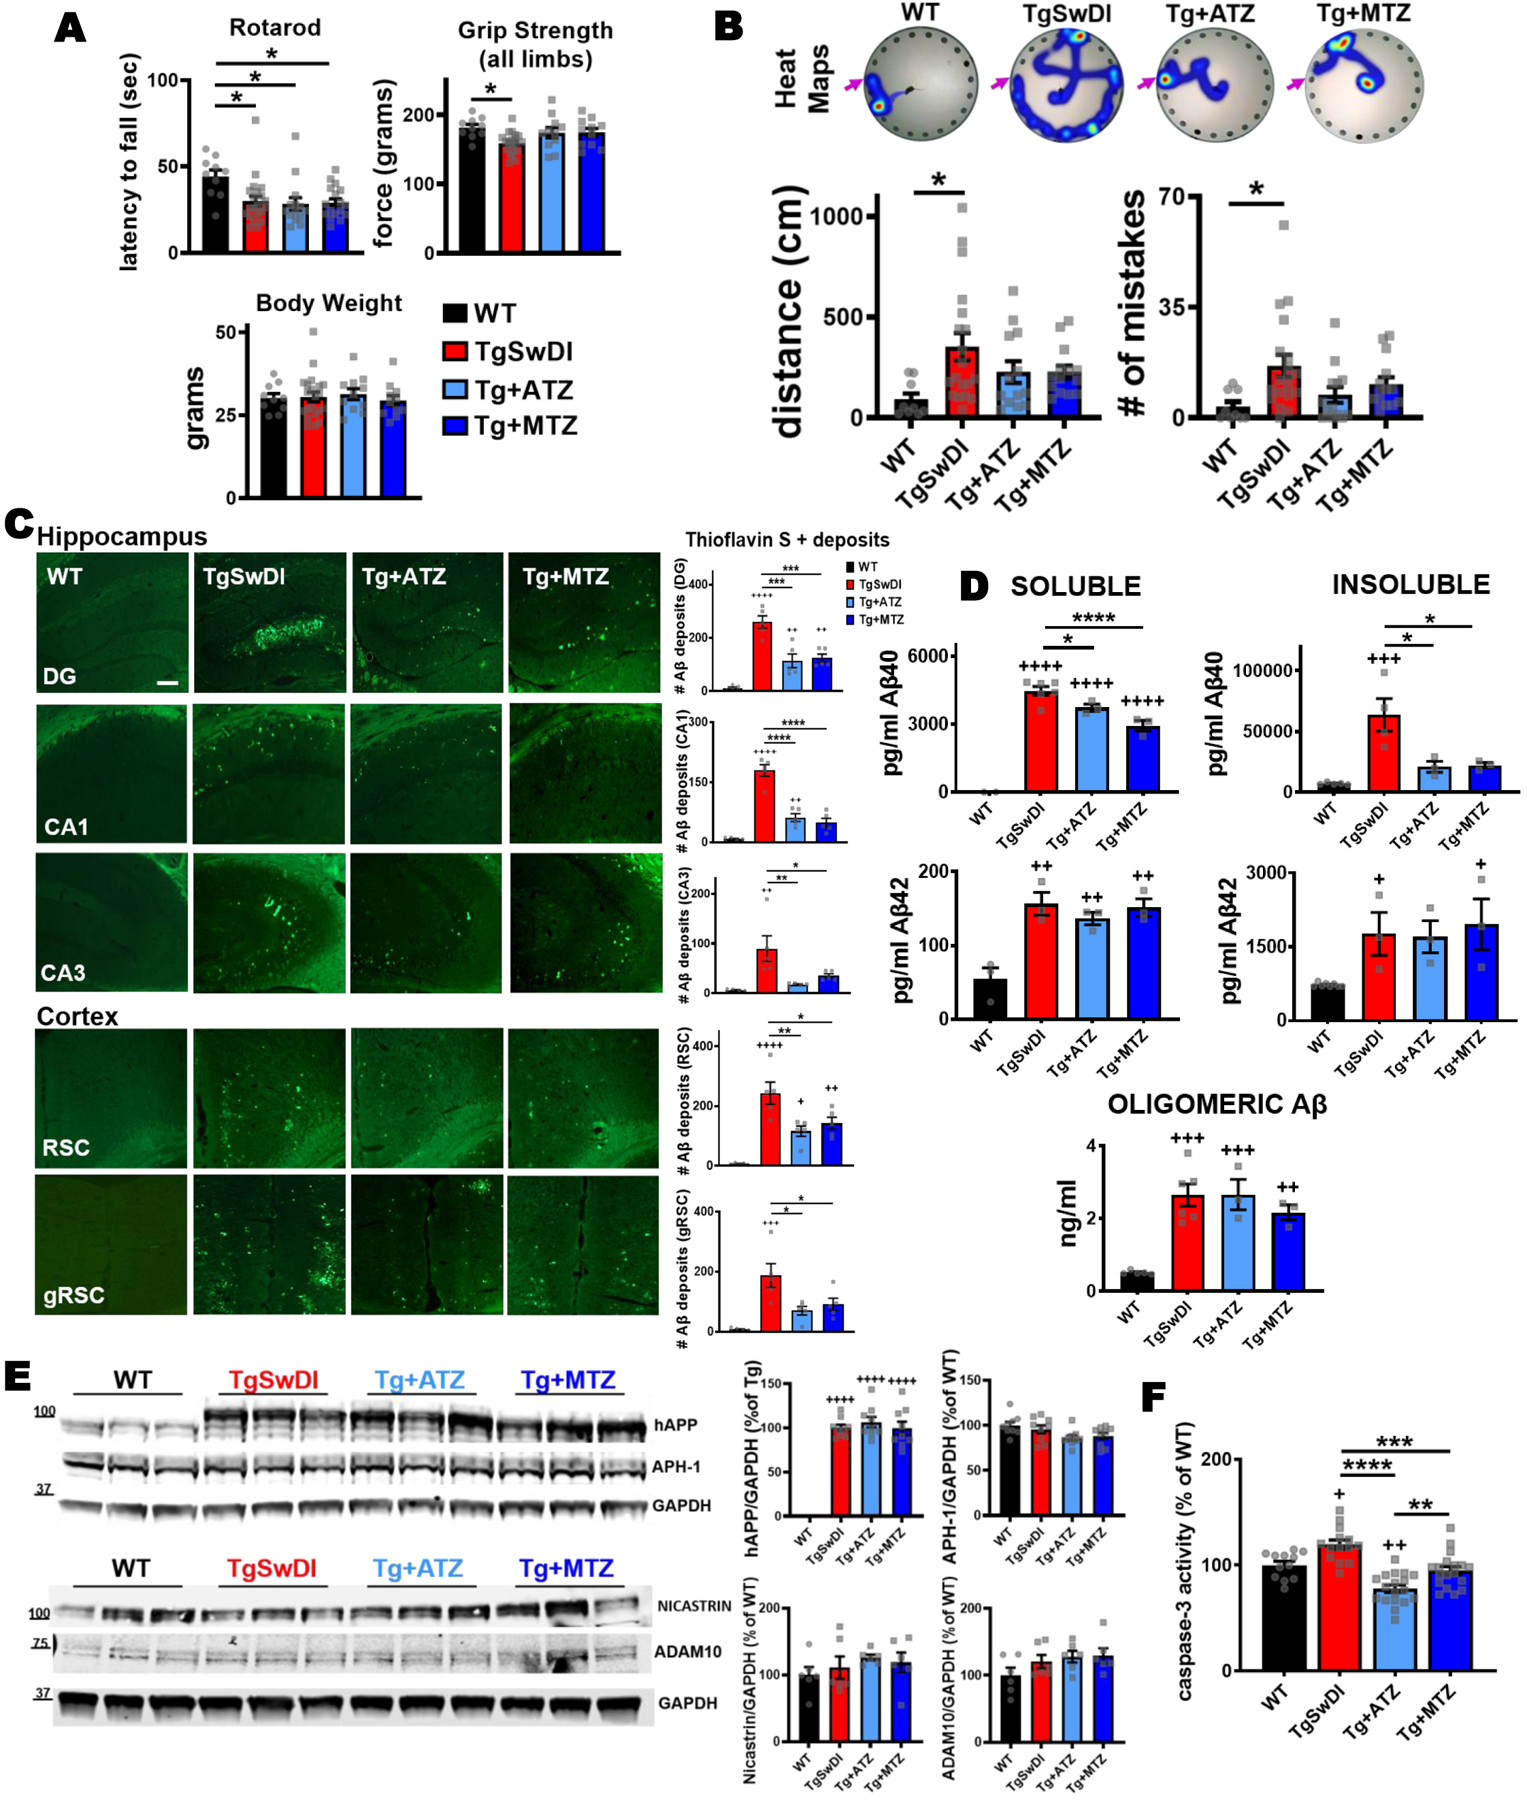
Methods: Based on the success of our previous in vitro studies, we tested for the first time in a model of AD and cerebral amyloid angiopathy (CAA), the carbonic anhydrase inhibitors (CAIs) methazolamide and acetazolamide, Food and Drug Administration-approved against glaucoma and high-altitude sickness.

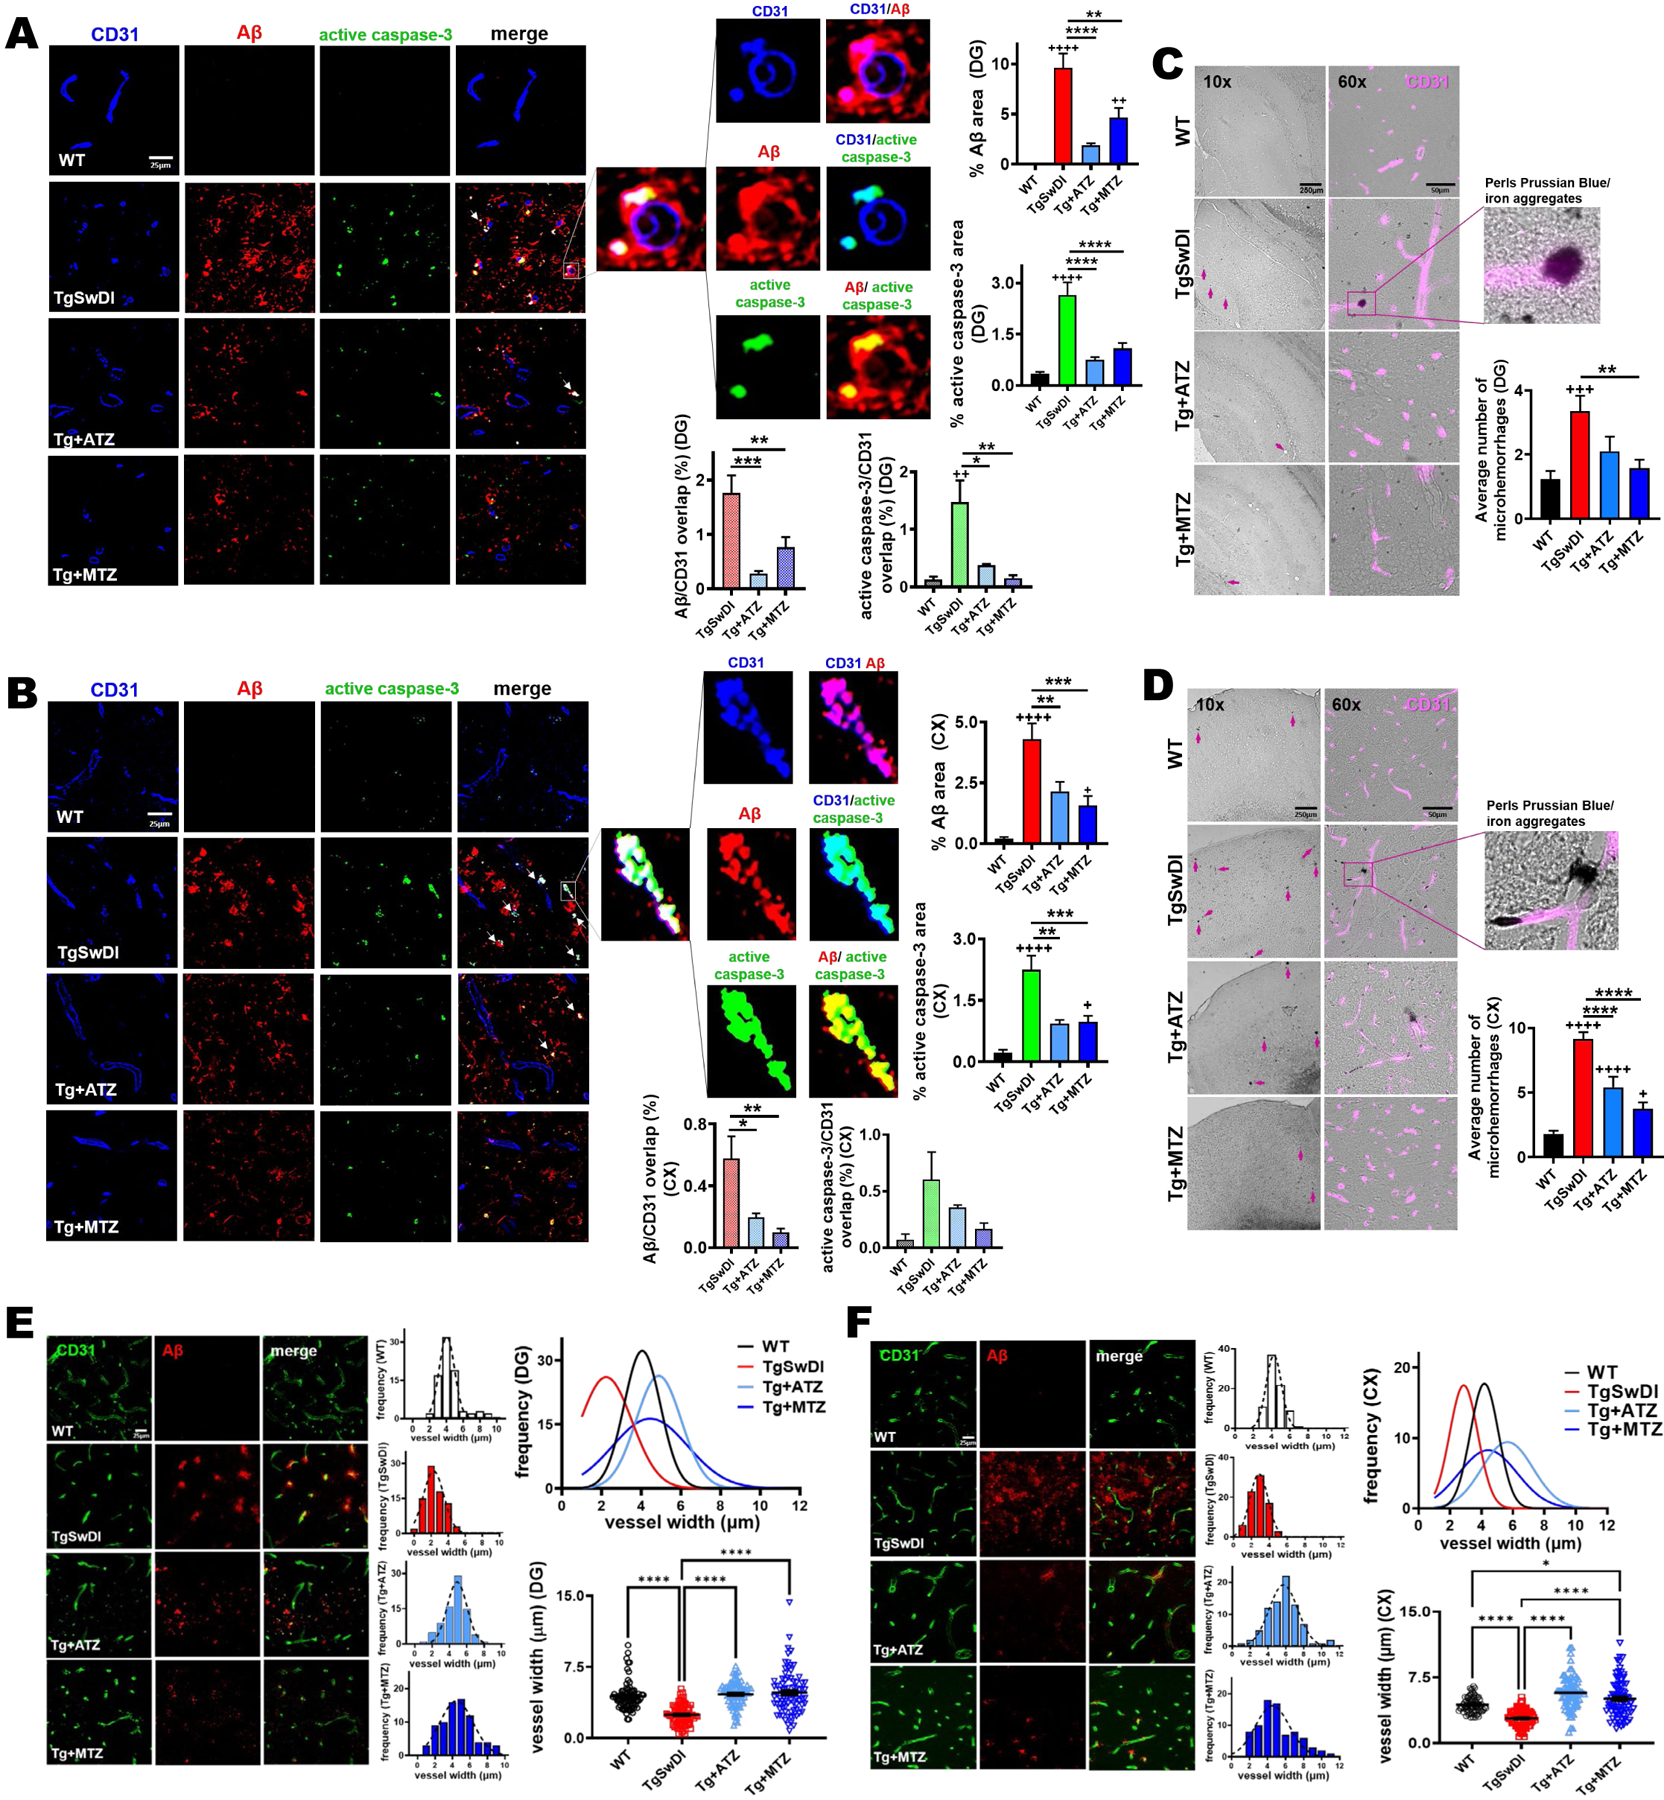
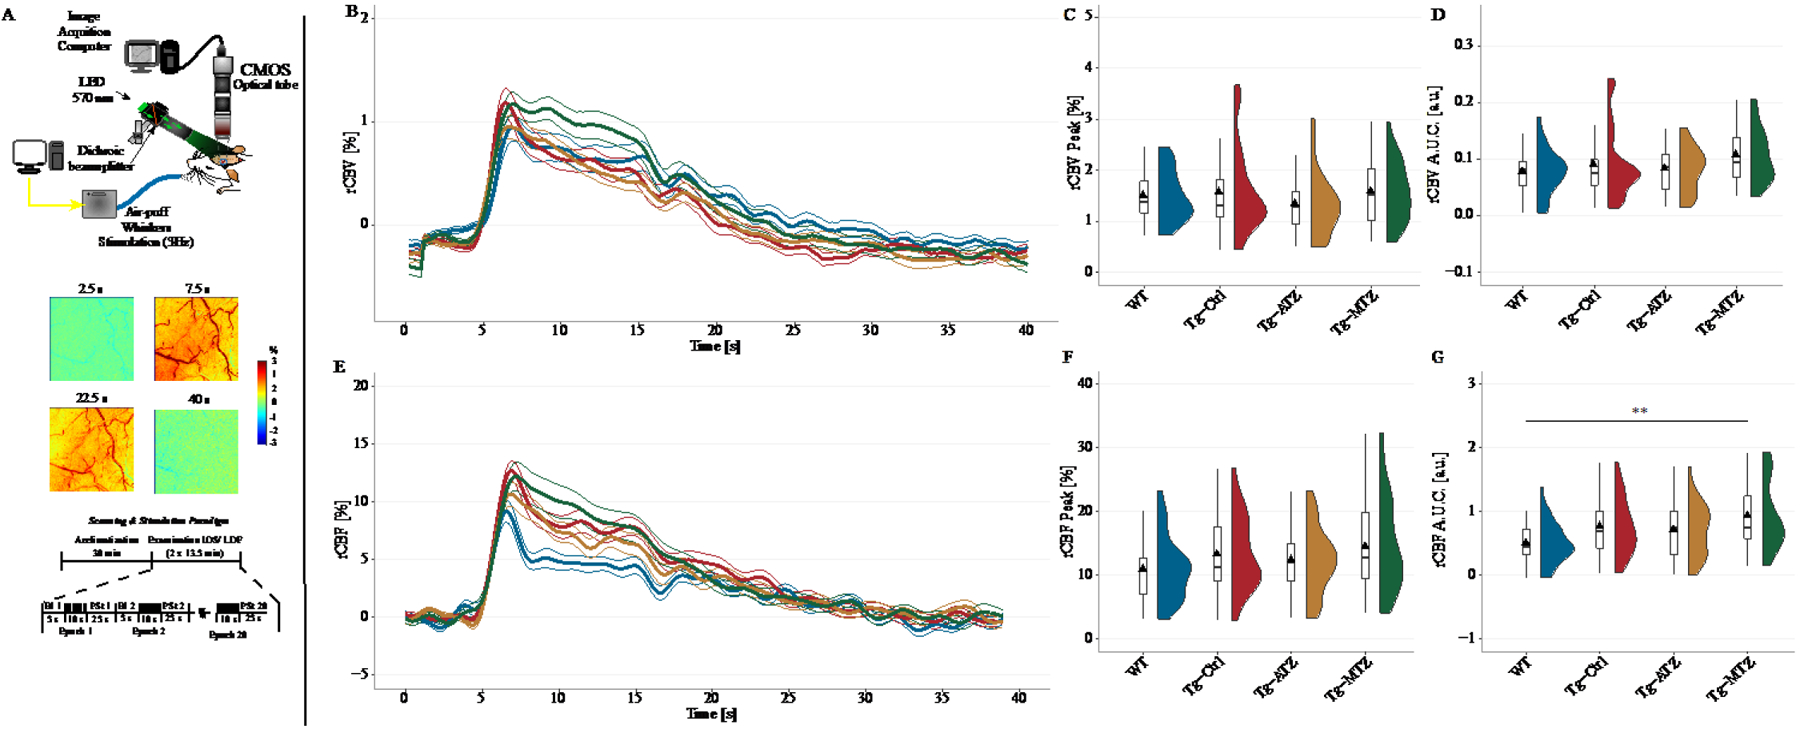
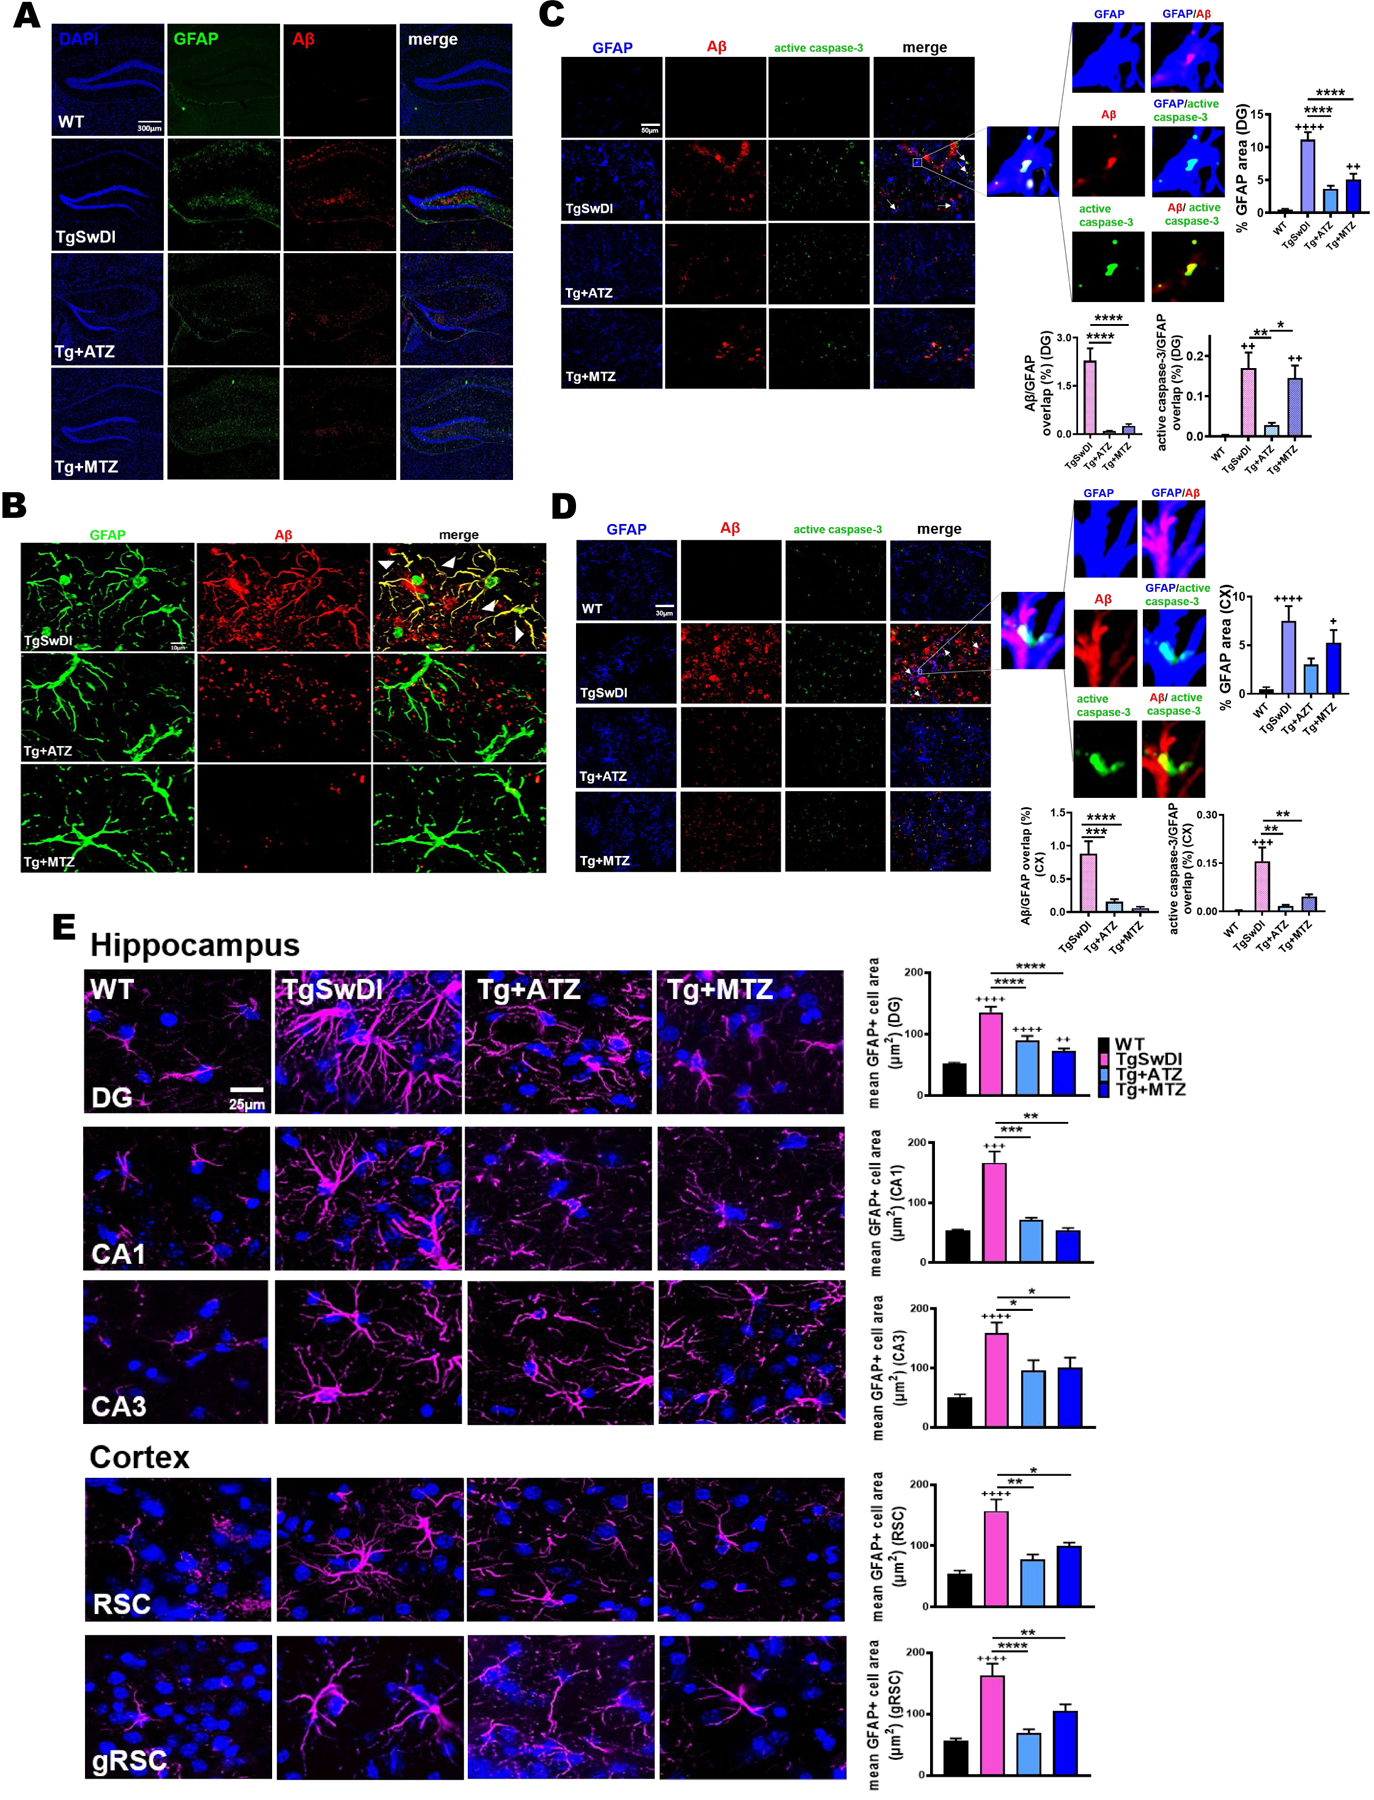
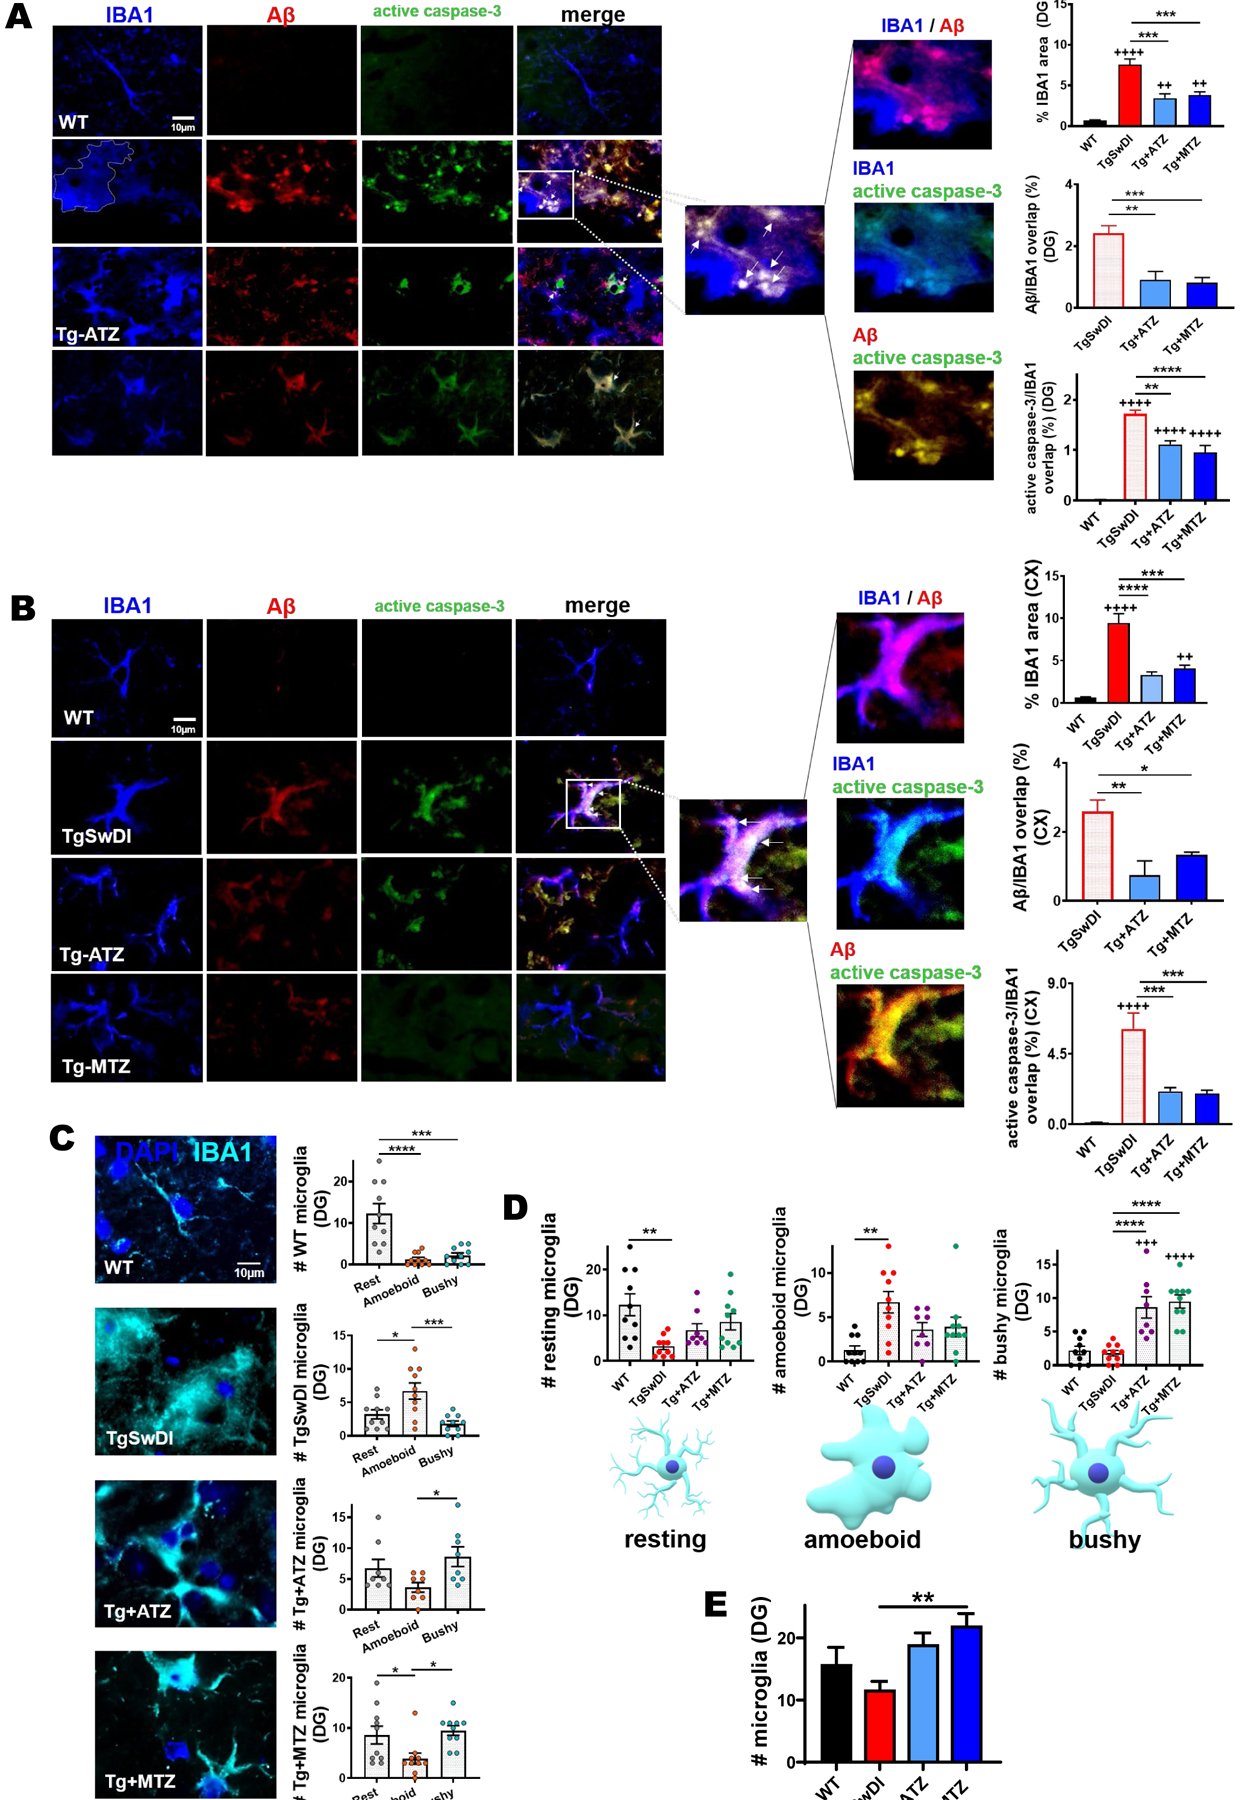
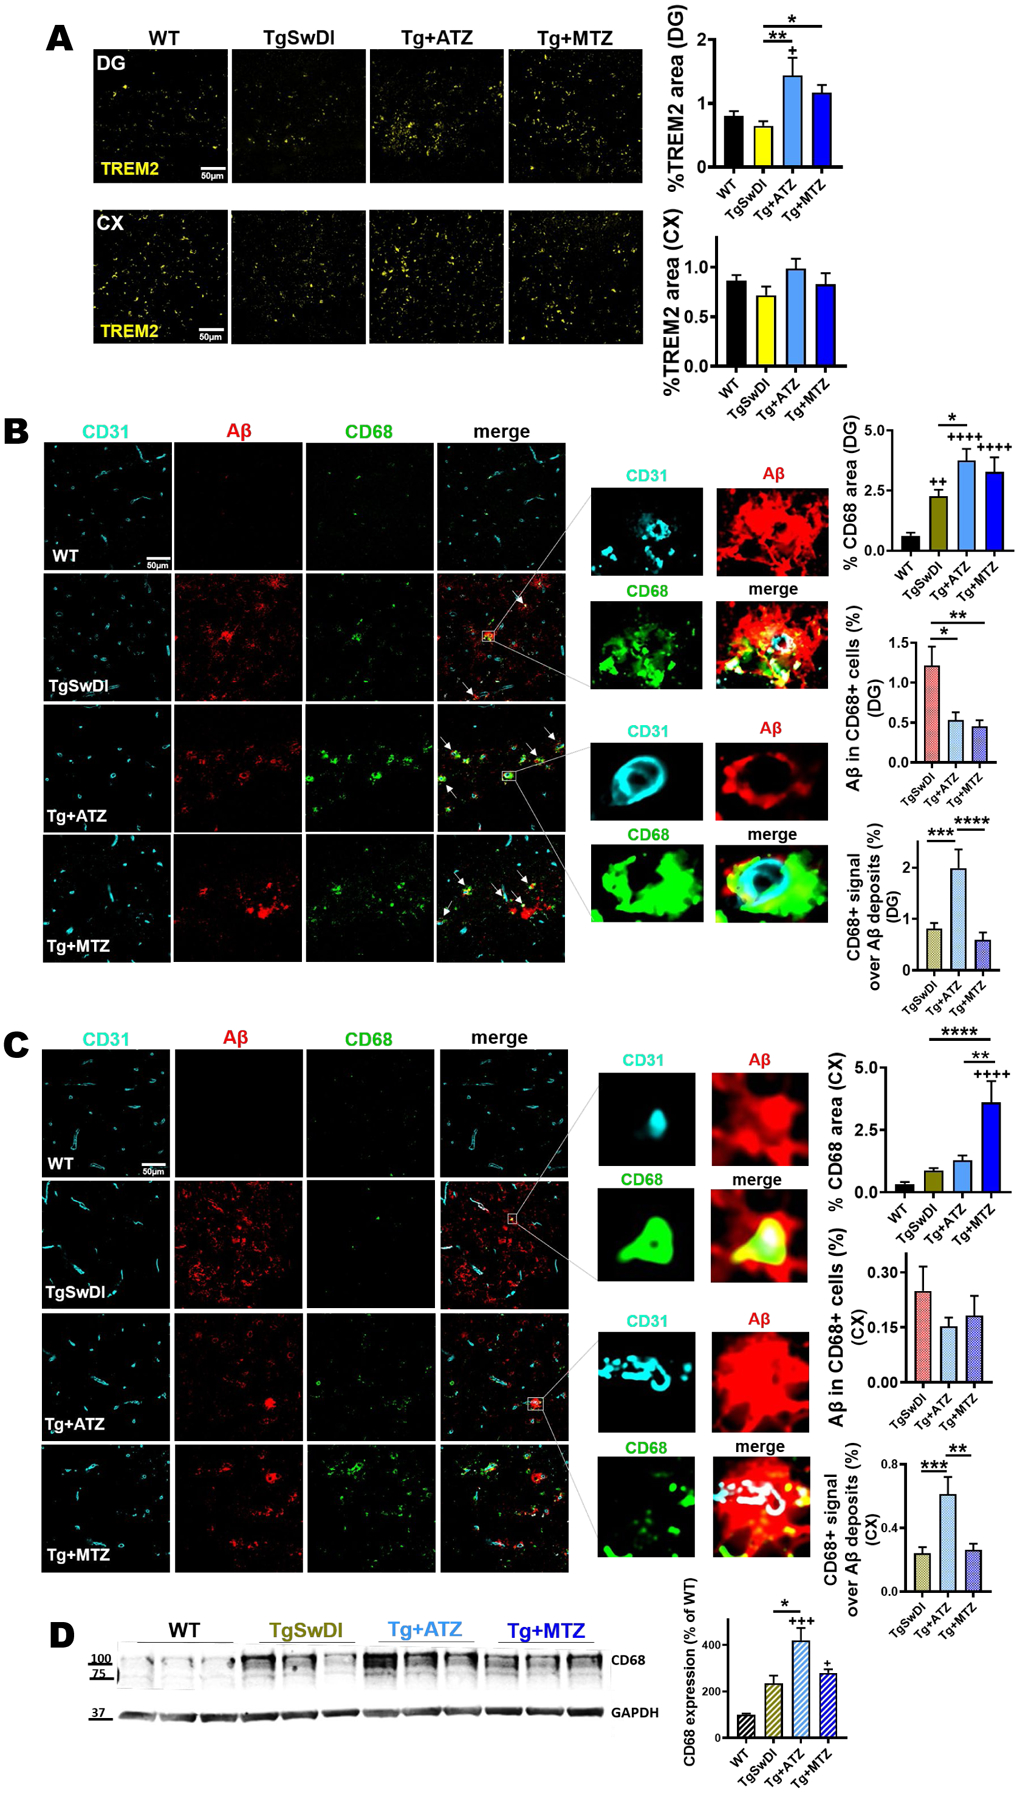
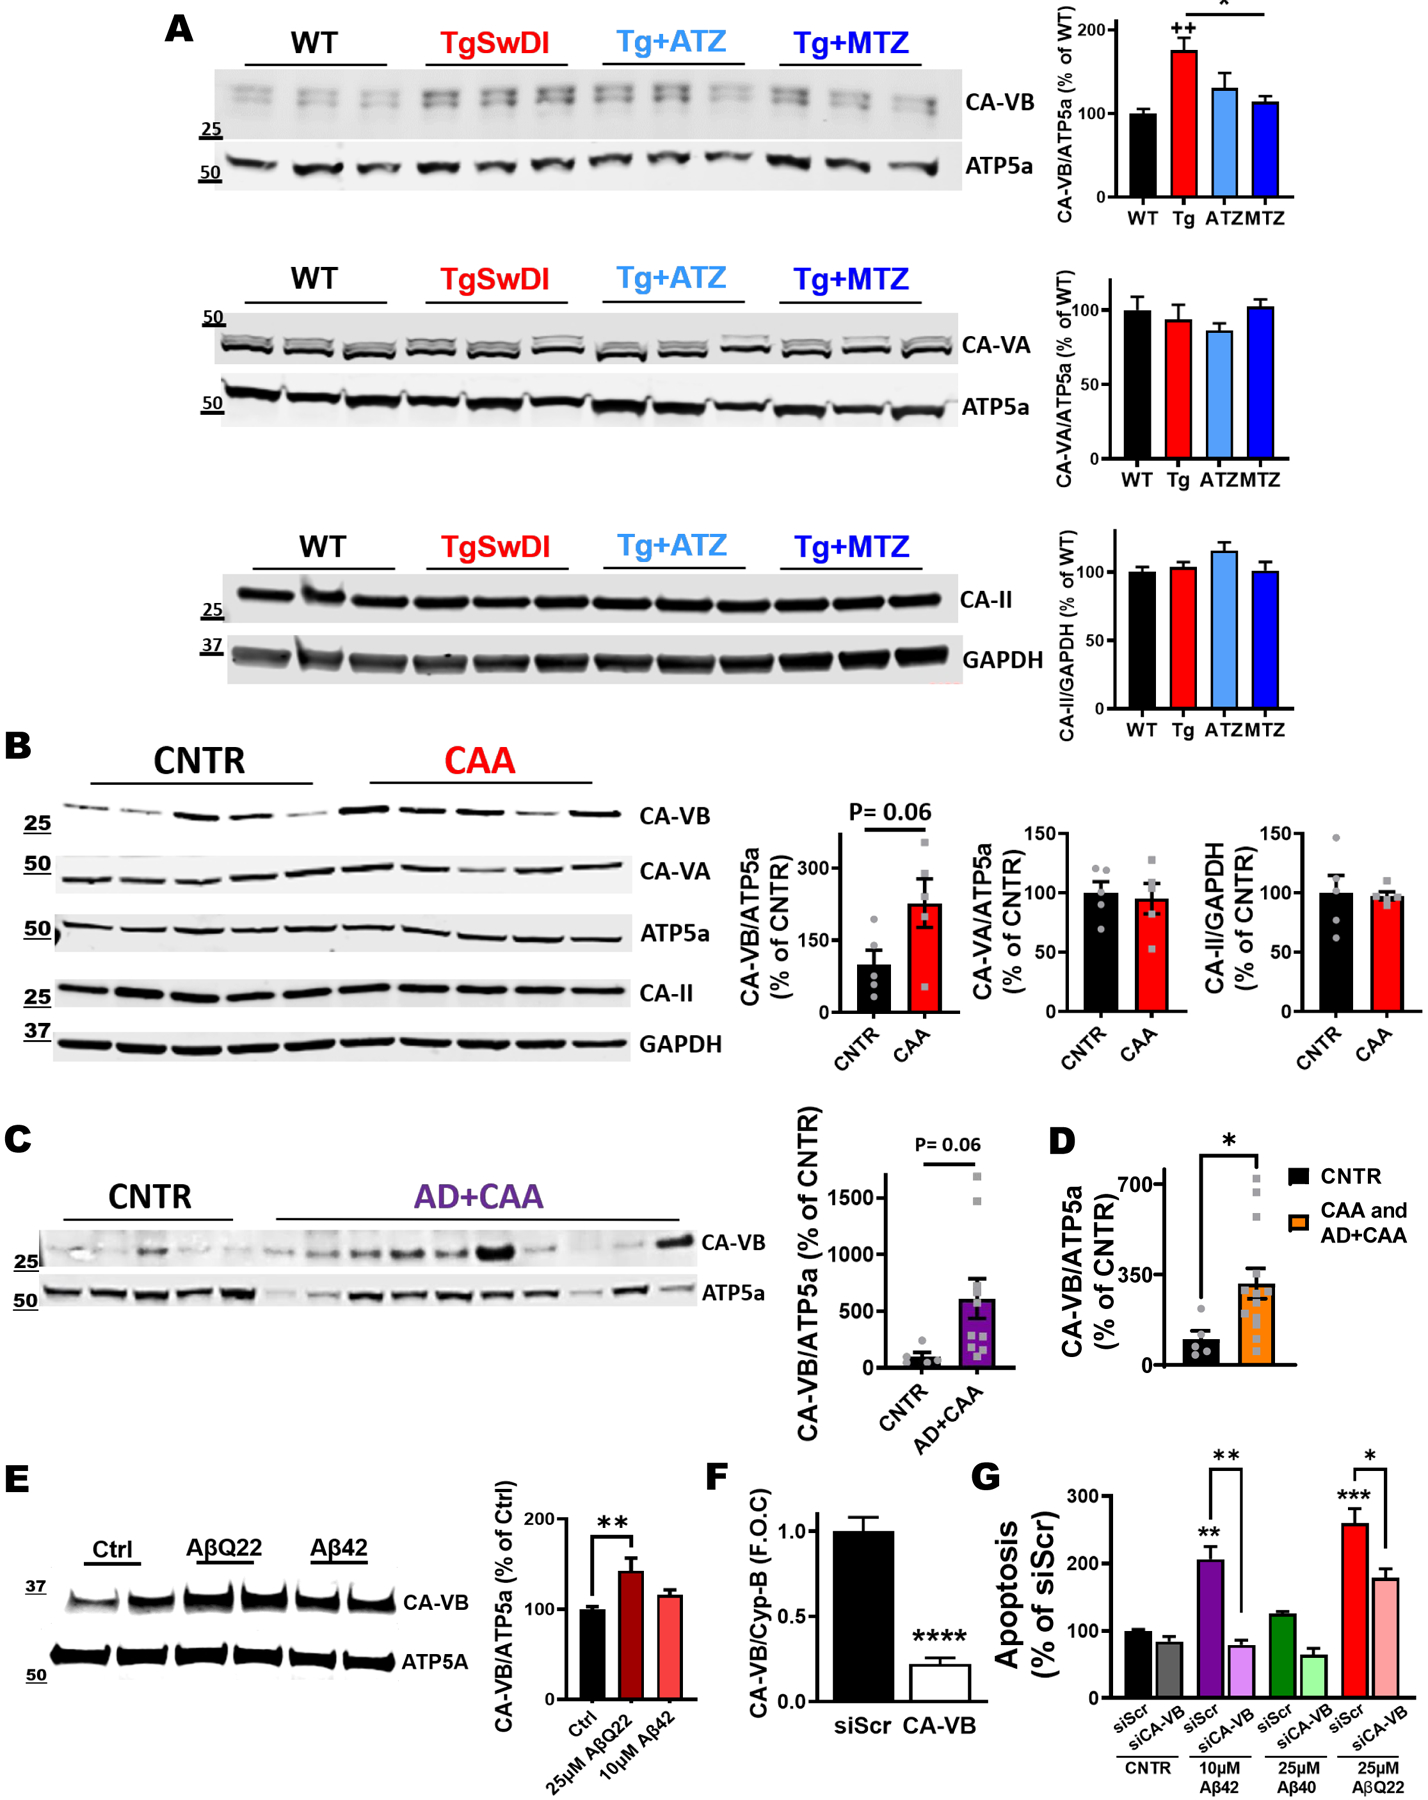
Results: Both CAIs reduced cerebral, vascular, and glial amyloid beta (Aβ) accumulation and caspase activation, diminished gliosis, and ameliorated cognition in TgSwDI mice. The CAIs also improved microvascular fitness and induced protective glial pro-clearance pathways, resulting in the reduction of Aβ deposition. Notably, we unveiled that the mitochondrial carbonic anhydrase-VB (CA-VB) is upregulated in TgSwDI brains, CAA and AD+CAA human subjects, and in endothelial cells upon Aβ treatment. Strikingly, CA-VB silencing specifically reduces Aβ-mediated endothelial apoptosis.

Discussion: This work substantiates the potential application of CAIs in clinical trials for AD and CAA.

Keywords: Alzheimer's disease; amyloid beta; astrocytes; carbonic anhydrase inhibitors; cerebral amyloid angiopathy; cerebrovascular dysfunction; clearance; endothelial cells; microglia; neuroinflammation.


Conflict of interest statement

Conflicts of Interest. We declare no conflict of interest. SF in an inventor on US Patent 10780094 for the use of CAIs in Alzheimer’s disease and CAA. All other authors have nothing to disclose in relation to this study.

Figures

Figure 1:
Figure 1:. CAI treatment attenuates cognitive impairment, reduces brain Aβ pathology and decreases caspase-3 activation in TgSwDI mice.
A) CAIs did not affect motor coordination tested with rotarod. In the rotarod performance, there was a significant main effect of group (F(1,57)=4.863, p=0.004) with body weight significant as covariate (F(1,57)=6.059, p=0.017). Post-hoc tests showed that all Tg groups were significantly impaired relative to WT control mice (TgSwDI p=0.016, Tg+ATZ p=0.012, Tg+MTZ p=0.006). The analysis of motor function tested with grip strength (all limbs) showed that there was a significant main effect of group (F(3,57)=5.449, p=0.002) on grip strength with body weight significant as covariate (F(1,57)=29.302, p=0.000). Post-hoc comparisons revealed that untreated TgSwDI mice had lower all-limb grip strength than WT mice (p=0.003). Body weight did not change between groups. B) Spatial memory tested via Barnes maze task in 15/16-month-old WT and TgSwDI mice, in the presence or absence of MTZ- or ATZ-treatment. The heat maps show the path (in blue) covered by the animals to reach the escape hole (indicated with pink arrows) in the probe test. The plots represent the distance covered (cm) and the number of mistakes made before finding the escape hole, during the probe test. There was a significant main effect of group on appropriately transformed indices of distance (F(3, 48)=4.456, p=0.008) and mistakes (F(3, 48)=5.059, p=0.004). Post-hoc comparisons between groups on each measure revealed that only untreated Tg mice were impaired in distance (p=0.0104) and mistakes (p=0.0117), compared to WT animals. Same pattern of results was observed with ANOVA applied to the untransformed data or when using nonparametric Kruskal Wallis analysis. WT: N=10, TgSwDI: N=19, ATZ: N=13 and MTZ: N=14. Two-way ANOVA and Dunn’s post-hoc test. Data are expressed as mean ± SEM. C) Representative images of cerebral Aβ deposits stained with Thioflavin S. 16-month-old untreated TgSwDI mice exhibit a greater amount of Aβ, in both hippocampus (DG, CA1 and CA3 areas) and cortex (retrosplenial and granular retrosplenial cortex, RSC and gRSC), compared to WT animals. CAI treatment significantly decreases Aβ deposits in all areas. Original magnification, 20x. Scale bar 150μm. On the right, relative quantification. WT, TgSwDI, ATZ and MTZ: N=5, n≥10 measurements acquired/group. D) Brain Aβ content measured by ELISA in soluble and insoluble fractions. Compared to age-matched WT, 16-month-old TgSwDI animals show significantly higher concentration (pg/ml) of both soluble and insoluble Aβ40 and Aβ42. CAI treatment diminishes soluble Aβ40, and even more considerably insoluble Aβ40, compared to Tg mice. Oligomeric Aβ content (ng/ml) within the soluble fraction does not significantly change among Tg groups. Graphs represent N=3–8 animals/group, n=2 measurement/animal. E) CAI treatment does not change the expression of hAPP and APP metabolism enzymes APH-1 and nicastrin (γ-secretase subunits), and ADAM10 (α-secretase). Quantification (right side), normalized vs GAPDH, and expressed in percentage vs WT mice (or % vs Tg in hAPP graph). N=3 mice/group, n=9 technical replicates/group. F) Caspase-3 activity measured in brain homogenates. ATZ and MTZ treatments significantly reduce total cerebral caspase-3 activation, compared to untreated TgSwDI mice. N=3–5 mice/group, n ≥12 measurements/group. In (C-F), one-way Anova and Tukey’s post-hoc test: * (vs Tg) and + (vs WT) p<0.05, ** and ++ p<0.01, *** and +++ p<0.001, **** and ++++ p<0.0001. Data are expressed as mean ± SEM.
Figure 2:
Figure 2:. Vascular Aβ burden, endothelial caspase-3 activation, microhemorrhages and microvessel constriction are reduced by CAIs.
A, B) Representative immunofluorescence images of DG (A) and cortex (B) of 16-month-old mice. TgSwDI mice present highly elevated cerebral Aβ (red) and active caspase-3 (green) staining, which are significantly decreased by CAI treatment. Original magnification, 60x. Scale bar, 25μm. On the right, relative quantification plotted as the percentage of area occupied by Aβ or active caspase-3 per acquisition field. For %Aβ graph, WT, TgSwDI and MTZ: N=5, ATZ: N=4, n≥12 measurements acquired /group. For % active caspase-3 graph, WT, TgSwDI and MTZ: N=5, ATZ: N=3, n≥9 measurements acquired /group. In the merged images, arrows point to Aβ deposits surrounding ECs (CD31+ ECs in blue). The magnified images illustrate overlap between the signals: ECs and Aβ (signal overlap in magenta), ECs and active caspase-3 (signal overlap in cyan), and Aβ overlapping active caspase-3 (yellow). Below, the graphs depict the percentage of Aβ and active caspase-3 signals, respectively, overlapping with CD31. For Aβ/CD31 overlap, N=5 for TgSwDI and MTZ, N=4 for ATZ, n≥12 measurements/group. For active caspase-3/CD31 overlap, N=3–5 mice/group, n ≥5 measurements/group. C) Representative 10x and 60x images of DAB-enhanced Perls Prussian Blue staining in DG of 16-month-old mice, showing higher number of microhemorrhages (MH) (indicated with arrows) in TgSwDI mice, vs WT animals, which are reduced in CAI-treated groups. Colocalization of iron aggregates with CD31+ BVs (magenta) is shown in the 60x and magnified images. Scale bars are 250μm and 50μm, respectively for 10x and 60x magnification. The plot on the right represents the average number of MH counted. WT, TgSwDI and MTZ: N=4, ATZ: N=3, n≥10 counts/group. D) Representative 10x and 60x images of Perls Prussian Blue staining, in cortex. MH presence (indicated with arrows) in TgSwDI mice, significantly decreased by CAI-diet. DAB-enhanced iron aggregates colocalizing with CD31+ BVs (magenta) shown in the magnified image. For magnification 10x and 60x, scale bar 250μm and 50μm, respectively. Relative quantification plotted on the right as the average number of MH. WT, TgSwDI and MTZ: N=4, ATZ: N=3, n≥10 counts/group. E) CAI treatment diminishes Aβ deposition (red) in DG, in TgSwDI mice, affecting vessel diameter (CD31, vascular marker, green). Original magnification, 60x. Scale bar, 25μm. On the right, vessel width frequency quantification in each group. On the top right, the frequency of all groups is plotted. On the bottom right, vessel diameter quantification, showing that CAI-fed mice, similarly to WT animals, displayed BVs with wider average diameter compared to untreated TgSwDI animals. WT, TgSwDI and MTZ: N=5, ATZ: N=4, n=80 vessels/group. F) CAI-diet increased blood vessel width in cortex, in 16-month-old TgSwDI mice. Original magnification 60x, scale bar 25μm. WT, TgSwDI and MTZ N=5, ATZ: N=4, n=80 vessels/group. In (A-F), one-way ANOVA and Tukey’s post-hoc test: * and + p<0.05, ** and ++ p<0.01, *** and +++ p<0.001, **** and ++++ p<0.0001. Data are expressed as mean ± SEM.
Figure 3:
Figure 3:. Analysis of cerebral blood flow and volume during functional activation.
A) Experimental setup for IOS to measure total Hemoglobin (Hb), a proxy for cerebral blood volume (CBV). A LED constantly illuminated the cranial window with a spectrum of 570 ± 2nm (top), while AVI videos were recorded using a CMOS camera at 5-fps. IOS relies on the reflectance of light from the illuminated cortex. At 570nm, both oxy- and deoxy-Hb are absorbed at the same rate, equivalent to total Hb (rCBV). Whisker stimulation increases CBV, reducing the reflectance, hence the signal. In the postprocessing, the signal was inverted for better representation (middle). For IOS and LDF, whisker stimulation occurred from the second 5 to the second 15 in each epoch (bottom). B) Relative changes in CBV to the baseline (rCBV [%]) were estimated and plotted as time-series. C) No difference between the groups in the maximum CBV response (rCBV Peak [%]) to stimulation, and area under the curve (rCBV A.U.C. [a.u.]) (D), during the stimulation period (10’). E) Estimated changes in regional cerebral blood flow (CBF) during functional activation, using a commercial LDF. F) No difference between groups in the maximum response to functional activation (rCBF Peak [%]). G) Analysis of the A.U.C. for regional CBF (rCBF A.U.C. [a.u.]). Tg+MTZ mice showed an overall increase in CBF response during the stimulation period, compared to the WT mice. N values: WT = 16 mice (8 males and 8 females); TgSwDI, N=17 (6 males and 11 females); Tg+ATZ, N=17 (11 males and 6 females); Tg+MTZ, N=16 (8 males and 8 females). ** p<0.01. Abbreviations: Bl: Baseline, PSt: poststimulation. Statistics: Cluster analysis using linear mixed-models predicting the changes in peak and A.U.C. by stimulation and adjusted for gender.
Figure 4:
Figure 4:. Astrocytosis, astrocytic Aβ content and caspase-3 activation are reduced in CAI-treated TgSwDI mice.
A) 10x images of DG of 16-month-old TgSwDI mice show augmented GFAP expression (green) and Aβ overload (red). Nuclei stained with DAPI (blue). CAI treatment reduces both astrogliosis and Aβ deposits. Original magnification, 10x. Scale bar, 300μm. B) In TgSwDI mice, Aβ (red) is trapped within astrocytes (green), as shown by the colocalization (yellow) in the merged image. ATZ and MTZ treatment reduces astrocytic Aβ content. C, D) Representative immunofluorescence images of DG (C) and cortex (D). Compared to WT, untreated Tg animals exhibit greater expression of the astrocytic marker GFAP (blue), as well as Aβ (red) and active caspase-3 (green), all decreased by treatment with CAIs. Original magnification, 60x. Scale bar, 30μm. On the right, astrogliosis is plotted as %GFAP area per acquisition field. WT, TgSwDI and MTZ: N=5, ATZ: N=3, n≥9 measurements acquired/group. Arrows indicate colocalization of Aβ and active caspase-3 in astrocytes. The magnified images display Aβ within GFAP+ cells (signals overlap in magenta), astrocytic caspase-3 activation (signals overlap in cyan), and Aβ colocalizing with caspase-3 (yellow). Below, graphs represent the percentage of Aβ and active caspase-3 signals overlapping with GFAP+ cells, indicating that CAIs significantly reduced astrocytic Aβ accumulation and caspase-3 activation (significant for ATZ in DG, and for both CAIs in cortex) in astrocytes. WT, TgSwDI and MTZ: N=5, ATZ: N=3, n≥9 measurements/group. E) 60x magnified images representing astrogliosis in 16-month-old mice. TgSwDI brains are characterized by significantly increased GFAP+ average cell area (μm2) (GFAP in magenta), in both the hippocampus (DG, CA1 and CA3 areas) and cortex (RSC and gRSC). Nuclei are stained with DAPI (blue). 8-month-CAI-diet attenuates astrogliosis. Original magnification, 60x. Scale bar, 25μm. On the right, relative quantification of the mean area of one GFAP+ cell, for each brain area analyzed. For both hippocampus and cortex, WT, TgSwDI and MTZ: N=5, ATZ: N=4 animals/group. In (A-E), one-way ANOVA and Tukey’s post-hoc test: * and + p< 0.05, ** and ++ p<0.01, *** and +++ p<0.001, **** and ++++ p<0.0001. Data are expressed as mean ± SEM.
Figure 5:
Figure 5:. ATZ and MTZ reduce microglial Aβ overload and caspase-3 activity, and promote microglial pro-healing phenotype.
A, B) Representative immunofluorescence images of DG (A) and cortex (B), showing that Tg animals exhibit increased microgliosis (IBA1, microglia marker in blue), Aβ (red) accumulation and active caspase-3 (green) in microglia, all rescued by CAIs. Original magnification, 60x. Scale bar, 10μm. On the right, % of IBA1 area per acquisition field. WT, TgSwDI and MTZ: N=5, ATZ: N=4, n≥8 measurements acquired/group. Arrows indicate microglia presenting internalized Aβ and active caspase-3. The magnified images show Aβ within IBA1+ cells (signal overlap in magenta), active caspase-3 within IBA1+ cells (signal overlap in cyan), and Aβ colocalizing with caspase-3 (yellow). On the right, plots represent the percentage of Aβ and active caspase-3 signals overlapping with IBA1+ cells, indicating that CAIs significantly reduce microglial Aβ overload and caspase-3 activation. WT, TgSwDI and MTZ: N= 5, ATZ: N=4, n≥8 measurements/group). C) Representative immunofluorescence images of microglia (IBA1 marker, cyan) for analysis of resting, amoeboid and bushy morphology. On the right, plots represent the different microglial phenotypes in each treatment group, in DG. WT mice have resting microglia as the most numerous subpopulation. TgSwDI have amoeboid microglia as most represented microglial type, while ATZ- and MTZ-treated mice present more bushy and resting microglia than amoeboid. WT, TgSwDI and MTZ: N= 5, ATZ: N=4, n≥8 measurements/group. D) Comparison of DG resting, amoeboid or bushy microglia between the different groups. The number of resting microglia is significantly higher in WT mice compared to Tg mice, but is not significantly different from WT in MTZ- and ATZ-treated mice. The amount of amoeboid microglia is the highest in Tg mice, while bushy microglia is more abundant in CAI-treated mice compared to WT and Tg. WT, TgSwDI and MTZ: N=5, ATZ: N=4, n≥8 measurements/group. E) Microglial cell (IBA1+ cells) count in DG. TgSwDI mice have fewer microglia than WT animals, while CAIs increase microglial number in Tg mice. WT, TgSwDI and MTZ: N=5, ATZ: N=4, n≥8 measurements/group. In (A-E), one-way ANOVA and Tukey’s post-hoc test: * p< 0.05, ** and ++ p<0.01, *** and +++ p<0.001, **** and ++++ p<0.0001. Data are expressed as mean ± SEM.
Figure 6:
Figure 6:. CAI treatment increases TREM2 and CD68+ perivascular phagocytic cells.
A) ATZ and MTZ significantly increase microglial TREM2 expression in DG in TgSwDI mice, and show a trend to increase in the cortex (cx). Relative plots on the right. For % TREM2 area, both in DG and cortex, WT, TgSwDI and MTZ: N=5, ATZ: N=3, n≥9 measurements acquired /group. * and + p<0.05 and **p<0.01, One-way ANOVA and Tukey’s post-hoc test. B, C) Expression of CD68 (green) around microvasculature (CD31, cyan), and co-localization with Aβ (red) in DG (B) and cortex (C). Original magnification, 60x. Scale bar, 50μm. CAI-fed animals present higher phagocytic activity marker (CD68), plotted as %CD68 area per acquisition field, compared to WT and Tg mice. TgSwDI: N=7, WT: N=6, ATZ: N=4, MTZ: N=5, n≥12 measurements acquired/group. * p<0.05, ++ p<0.01, ++++ p<0.0001, One-way ANOVA and Tukey’s post-hoc test. Arrows indicate vascular Aβ internalized by CD68+ perivascular macrophages (PVM), as shown in yellow in the magnified images. On the right, colocalization plots for both Aβ within CD68+ cells (Aβ/CD68) and CD68+ area over Aβ deposits (CD68/Aβ). TgSwDI: N=7, MTZ: N=5, ATZ: N=4, n≥11 measurements/group. For Aβ/CD68 colocalization, * p<0.05 and ** p<0.01. For CD68/Aβ colocalization, *** p<0.001 and **** p<0.0001, ++++P<0.0001. One-way ANOVA and Tukey’s post-hoc test. D) WB of total brain homogenates showing that CD68 expression is significantly increased by CAIs, particularly ATZ. N=3/group, * and + p<0.05, +++ p<0.001, One-way ANOVA and Tukey’s post-hoc test. Data are expressed as mean ± SEM.
Figure 7:
Figure 7:. CA-VB expression increases in Tg mice, AβQ22-treated ECs and CA-VB silencing prevents endothelial apoptosis.
A) Immunoblot for CA-VA, -VB and -II in total brain lysates of 16-month-old mice. TgSwDI brains display a significant increase in the mitochondrial carbonic anhydrase-VB (CA-VB) compared to age-matched WT mice, while CAI-treated brains do not show the CA-VB increase (CA-VB normalized to the mitochondrial protein ATP5a). The expression of CA-VA (normalized to ATP5a) and of CA-II (normalized to GAPDH) does not change. N=3 animals/group, n=6 technical replicates/group. * p<0.05 and ++ p<0.01, One-way ANOVA and Tukey’s post-hoc test. B, C) Biochemical analysis of mitochondrial carbonic anhydrases in human cortices. CA-VB expression is upregulated in CAA (+127%, p=0.06) (B) and in AD+CAA subjects (+511%, p=0.06) (C), compared to healthy controls (CNTR). No significant alterations in CA-VA and CA-II levels, between CAA and CNTR brains (B). CNTR and CAA groups N=5, and AD+CAA group N=10. Two-tailed unpaired t test. D) The combination of CAA and AD+CAA groups shows significant upregulation of CA-VB levels compared to CNTR. CNTR N=5; CAA group combined with AD+CAA group N=15. *p<0.05. Two-tailed unpaired t test. E) Western Blot analysis of CA-VB in cerebral ECs after 24hr challenge with Aβ40-Q22 (25μM) and Aβ42 (10μM). CA-VB was normalized to the mitochondrial protein ATP5a. Quantification is represented on the right. The expression of CA-VB is significantly increased following 24hrs Aβ40-Q22 treatment. Data represents the combination of at least three experiments each with 2 replicates, graphed as mean + SEM. One-way ANOVA and Dunnett’s post-test. **p< 0.01 F) qRT-PCR for mRNA expression levels of CA-VB and Cyp-B (housekeeping control gene) in cerebral ECs 48hrs post-transfection with siRNA for CA-VB (siCA-VB) or with a scrambled siRNA sequence (siScr) as control. **** p<0.0001 vs. siScr, Unpaired two-tailed t-test. G) CA-VB silencing prevents apoptosis, measured as the formation of fragmented nucleosomes (by Cell death ELISAplus), after challenge with Aβ42 (10μM), Aβ40 (25μM) or Aβ40-Q22 (25μM) for 24hrs (starting after the 48hr silencing). The graph displays one representative experiment of at least N=3 experiments, each performed in duplicate (n=2). * p<0.05 and ** p<0.01 vs. siScr control, One-way ANOVA, and Tukey’s post-hoc test. Data are expressed as mean ± SEM.

References

    1. Zlokovic BV. Neurovascular mechanisms of Alzheimer’s neurodegeneration. Trends Neurosci. 2005;28(4):202–208. - PubMed
    1. Ostergaard L, Aamand R, Gutierrez-Jimenez E, et al. The capillary dysfunction hypothesis of Alzheimer’s disease. Neurobiol Aging. 2013;34(4):1018–1031. - PubMed
    1. Buee L, Hof PR, Delacourte A. Brain microvascular changes in Alzheimer’s disease and other dementias. Ann N Y Acad Sci. 1997;826:7–24. - PubMed
    1. Carare RO, Aldea R, Agarwal N, et al. Clearance of interstitial fluid (ISF) and CSF (CLIC) group-part of Vascular Professional Interest Area (PIA): Cerebrovascular disease and the failure of elimination of Amyloid-beta from the brain and retina with age and Alzheimer’s disease-Opportunities for Therapy. Alzheimers Dement (Amst). 2020;12(1):e12053. - PMC - PubMed
    1. Snyder HM, Corriveau RA, Craft S, et al. Vascular contributions to cognitive impairment and dementia including Alzheimer’s disease. Alzheimer’s & dementia : the journal of the Alzheimer’s Association. 2015;11(6):710–717. - PMC - PubMed

Publication types

MeSH terms

Substances