. 2023 Apr;13(4):e1235.
doi: 10.1002/ctm2.1235.

Therapeutic targeting of CNBP phase separation inhibits ribosome biogenesis and neuroblastoma progression via modulating SWI/SNF complex activity

Affiliations

Therapeutic targeting of CNBP phase separation inhibits ribosome biogenesis and neuroblastoma progression via modulating SWI/SNF complex activity

Anpei Hu et al. Clin Transl Med. 2023 Apr.

Abstract

Background: Neuroblastoma (NB) is the most common extracranial malignancy in childhood; however, the mechanisms underlying its aggressive characteristics still remain elusive.

Methods: Integrative data analysis was performed to reveal tumour-driving transcriptional regulators. Co-immunoprecipitation and mass spectrometry assays were applied for protein interaction studies. Real-time reverse transcription-polymerase chain reaction, western blotting, sequential chromatin immunoprecipitation and dual-luciferase reporter assays were carried out to explore gene expression regulation. The biological characteristics of NB cell lines were examined via gain- and loss-of-function assays. For survival analysis, the Cox regression model and log-rank tests were used.

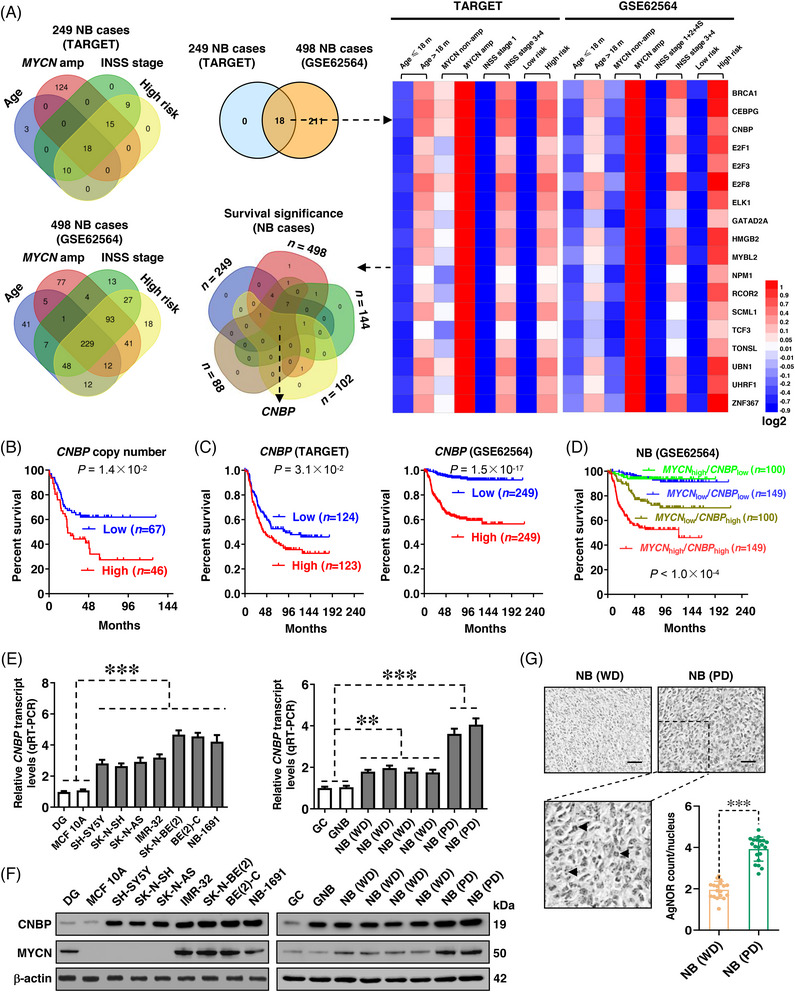
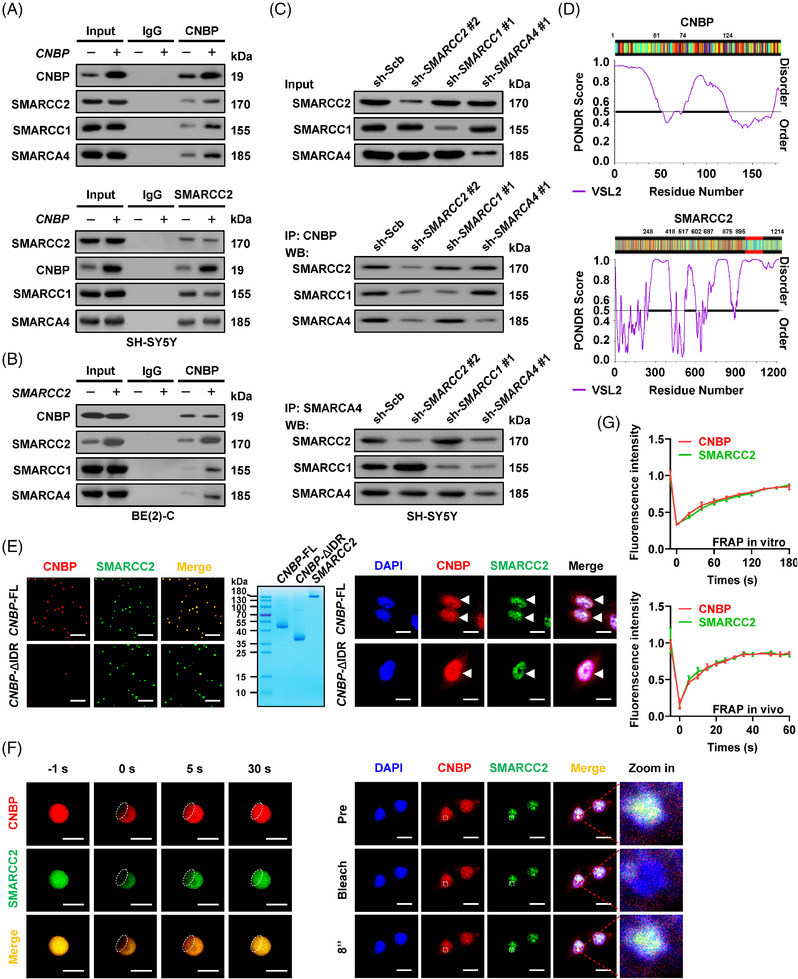
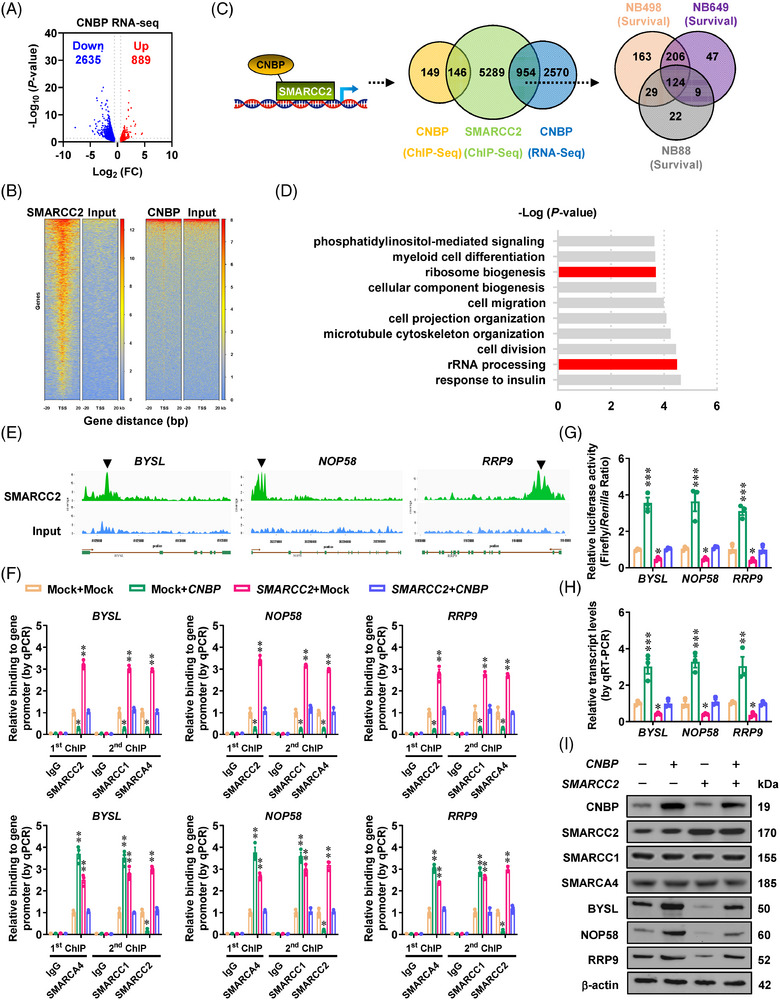
Results: Cellular nucleic acid-binding protein (CNBP) was found to be an independent factor affecting NB outcome, which exerted oncogenic roles in ribosome biogenesis, tumourigenesis and aggressiveness. Mechanistically, karyopherin subunit beta 1 (KPNB1) was responsible for nuclear transport of CNBP, whereas liquid condensates of CNBP repressed the activity of switch/sucrose-nonfermentable (SWI/SNF) core subunits (SMARCC2/SMARCC1/SMARCA4) via interaction with SMARCC2, leading to alternatively increased activity of SMARCC1/SMARCA4 binary complex in facilitating gene expression essential for 18S ribosomal RNA (rRNA) processing in tumour cells, extracellular vesicle-mediated delivery of 18S rRNA and subsequent M2 macrophage polarisation. A cell-penetrating peptide blocking phase separation and interaction of CNBP with SMARCC2 inhibited ribosome biogenesis and NB progression. High KPNB1, CNBP, SMARCC1 or SMARCA4 expression or low SMARCC2 levels were associated with poor survival of NB patients.

Conclusions: These findings suggest that CNBP phase separation is a target for inhibiting ribosome biogenesis and tumour progression in NB via modulating SWI/SNF complex activity.

Keywords: SWI/SNF complex; cellular nucleic acid-binding protein; karyopherin subunit beta 1; phase separation; ribosome biogenesis; tumour progression.


Conflict of interest statement

The authors declare that they have no competing interests.

Figures

FIGURE 1
FIGURE 1
Cellular nucleic acid‐binding protein (CNBP) is associated with poor prognosis and clinical progression of neuroblastoma (NB). (A) Venn diagram (left and middle upper panels) and heatmap (right panel) revealing the identification of transcriptional regulators associated with older age at diagnosis (>18 months), MYCN amplification, advanced International Neuroblastoma Staging System (INSS) stages and high risk of 249 (TARGET) and 498 (GSE62564) NB cases. Venn diagram (middle lower panel) indicating further overlapping analysis for survival significance of identified transcriptional regulators in 249 (TARGET), 498 (GSE62564), 144 (gencode19), 102 (GSE3446) and 88 (GSE16476) NB patients. (B) Kaplan–Meier plots showing event‐free survival curves of 113 NB patients with high or low CNBP copy number (cutoff value = 0.992) derived from Oncogenomics database (https://omics‐oncogenomics.ccr.cancer.gov/cgi‐bin/JK). (C) Kaplan–Meier curves indicating the survival of 249 (TARGET, cutoff value = 10.01) and 498 (GSE62564, cutoff value = 6.82) NB patients with high or low CNBP expression. (D) Kaplan–Meier curves showing the survival of patients with high or low expression of MYCN (cutoff value = 5.76) and CNBP (cutoff value = 6.82) in 498 NB cases (GES62564). (E and F) Real‐time quantitative reverse transcription‐polymerase chain reaction (qRT‐PCR, E, normalised to β‐actin, n = 6) and western blot (F) assays indicating the expression of CNBP or MYCN in normal dorsal ganglia (DG), normal cell line (MCF 10A), NB cell lines without (SH‐SY5Y, SK‐N‐SH, SK‐N‐AS) or with MYCN amplification (IMR32, SK‐N‐BE(2), BE(2)‐C, NB‐1691), gangliocytoma (GC), ganglioneuroblastoma (GNB) or NB tissues (n = 21). (G) Representative images and quantification of argyrophilic nucleolar organiser region (AgNOR) staining assay showing the localisation (arrowheads) and number of nucleolar organiser region (NOR) dots within well differentiated (WD, n = 18) or poorly differentiated (PD, n = 20) NB tissues. Scale bars: 100 µm. Fisher's exact test for overlapping analysis in (A); log‐rank test in (B–D); one‐way analysis of variance (ANOVA) with Bonferroni's multiple comparison test in (E); unpaired two‐sided Student's t test in (G). ** p < .01, *** p < .001 versus DG, GC or NB (WD). Data are shown as mean ± standard error of the mean (s.e.m.) (error bars) and representative of three independent experiments in (E–G).
FIGURE 2
FIGURE 2
Cellular nucleic acid‐binding protein (CNBP) facilitates growth and aggressiveness of neuroblastoma (NB) cells in vitro and in vivo. (A) Western blot assay indicating the expression of CNBP in SH‐SY5Y and IMR‐32 cells stably transfected with empty vector (mock), CNBP, scramble shRNA (sh‐Scb) or sh‐CNBP. (B) 2‐(4,5‐Dimethyltriazol‐2‐yl)−2,5‐diphenyl tetrazolium bromide (MTT) colorimetric assay depicting the change in viability of SH‐SY5Y and IMR‐32 cells stably transfected with mock, CNBP, sh‐Scb or sh‐CNBP (n = 5 per group). (C) Representative images (upper panel) and quantification (lower panel) of soft agar and Matrigel invasion assays showing the anchorage‐independent growth and invasion of SH‐SY5Y and IMR‐32 cells stably transfected with mock, CNBP, sh‐Scb, sh‐CNBP #2 or sh‐CNBP #3 (n = 5 per group). (D) In vivo imaging, growth curve, and weight at the end points of xenograft tumours formed by subcutaneous injection of SH‐SY5Y cells stably transfected with mock, CNBP, sh‐Scb or sh‐CNBP #2 into dorsal flanks of nude mice (n = 5 for each group). (E) Representative images (upper panel) and quantification (lower panel) of immunohistochemical staining showing the intratumoural expression of Ki‐67 and CD31 (brown, arrowheads) within subcutaneous xenograft tumours of nude mice formed by SH‐SY5Y cells stably transfected with mock, CNBP, sh‐Scb or sh‐CNBP #2 (n = 5 for each group). Scale bars: 100 µm. (F) Representative images (top panel), haematoxylin and eosin (HE) staining (middle panel, arrowheads), quantification (bottom left panel) of lung metastatic colonisation and Kaplan–Meier curves (bottom right panel) of nude mice treated with tail vein injection of SH‐SY5Y cells stably transfected with mock, CNBP, sh‐Scb or sh‐CNBP #2 (n = 5 for each group). Scale bars: 100 µm. Student's t test and one‐way analysis of variance (ANOVA) compared the difference in (B–F). Log‐rank test for survival comparison in (F). ** p < .01, *** p < .001 versus mock or sh‐Scb. Data are shown as mean ± standard error of the mean (s.e.m.) (error bars) and representative of three independent experiments in (A–C).
FIGURE 3
FIGURE 3
Karyopherin subunit beta 1 (KPNB1) facilitates nuclear translocation and oncogenic roles of cellular nucleic acid‐binding protein (CNBP). (A and B) Venn diagram (left panel) assays revealing the overlapping analysis of proteins pulled down by CNBP antibody from lysates of IMR‐32 cells stably transfected with empty vector (mock) or CNBP, and comprehensive analysis with nucleocytoplasmic transporters, epigenetic factors and transcriptional regulators derived from AmiGO2 (http://amigo.geneontology.org), EpiFactors (https://epifactors.autosome.ru/) or Genomatrix (http://www.genomatix.de) databases. Kaplan–Meier curves (right panel) indicating the survival of patients with high or low expression of KPNB1 (cutoff values = 10.46 and 7.80) or SMARCC2 (cutoff values = 9.42 and 7.57) in 249 (TARGET) and 498 (GES62564) neuroblastoma (NB) cases. (C) Bimolecular fluorescence complementation (BiFC) assay showing the interaction of CNBP with KPNB1 or SMARCC2 (arrowheads) in SH‐SY5Y cells co‐transfected with their respective constructs. Scale bars: 10 µm. (D) Western blot assay indicating the cytoplasmic and nuclear accumulation of CNBP in IMR‐32 cells stably transfected with mock, KPNB1, scramble shRNA (sh‐Scb) or sh‐KPNB1. (E) Western blot assay showing the cytoplasmic and nuclear levels (right panel) of CNBP in IMR‐32 cells treated with importazole (IPZ, 20 µmol L−1, left panel) for different time points as indicated. (F) Immunofluorescence assays revealing the cytoplasmic and nuclear levels of KPNB1 and CNBP (arrowheads) in IMR‐32 cells, and those stably transfected with sh‐KPNB1 #1 or treated with IPZ (20 µmol L−1) for 24 h. Scale bars: 10 µm. (G) Quantification of soft agar and Matrigel invasion assays showing the anchorage‐independent growth and invasion capability of SH‐SY5Y and IMR‐32 cells transfected with scramble CRISPRa (CRISPRa‐Scb) or CRISPRa‐CNBP #1, and those treated with dimethylsulfoxide (DMSO) or IPZ (20 µmol L−1) for 24 h. Fisher's exact test for overlapping analysis in (A and B). Log‐rank test compared the survival difference in (A and B). One‐way analysis of variance (ANOVA) with Bonferroni's multiple comparison test in (G). ** p < .01, *** p <  .001 versus a‐sgCtrl + DMSO. ns, non‐significant. Data are shown as mean ± standard error of the mean (s.e.m.) (error bars) and representative of three independent experiments in (C–G).
FIGURE 4
FIGURE 4
Cellular nucleic acid‐binding protein (CNBP) interacts with switch/sucrose‐nonfermentable (SWI/SNF) complex via SMARCC2 in liquid condensates. (A and B) Co‐immunoprecipitation (Co‐IP) and western blot assays indicating the interaction of CNBP with SWI/SNF complex subunits SMARCC2, SMARCC1 or SMARCA4 in SH‐SY5Y or BE(2)‐C cells stably transfected with empty vector (mock), CNBP or SMARCC2. (C) Co‐IP and western blot assays showing the interaction among CNBP, SMARCC2, SMARCC1 and SMARCA4 in SH‐SY5Y cells stably transfected with scramble shRNA (sh‐Scb), sh‐SMARCC2 #2, sh‐SMARCC1 #1 or sh‐SMARCA4 #1. (D) Intrinsically disordered region (IDR) within CNBP and SMARCC2 proteins analysed by PONDR (http://www.pondr.com/) program. (E) Fluorescence imaging assay indicating the condensate formation of recombinant full‐length (FL) or IDR‐deficient CNBP‐mCherry and SMARCC2‐EGFP proteins (left panel) with purity detected by SDS‐PAGE and Coomassie blue staining (middle panel), and that of CNBP and SMARCC2 in SH‐SY5Y cells stably transfected with CNBP construct (right panel, arrowheads). Scale bars: 10 µm. (F and G) Representative images (F) and quantification (G) of fluorescence recovery after photobleaching (FRAP) assay showing the exchange kinetics of CNBP‐mCherry and SMARCC2‐EGFP within condensates, and those of CNBP and SMARCC2 in SH‐SY5Y cells stably transfected with CNBP construct. Scale bars: 10 µm. Data are shown as representative of three independent experiments in (A–C) and (E–G).
FIGURE 5
FIGURE 5
Cellular nucleic acid‐binding protein (CNBP) facilitates switch/sucrose‐nonfermentable (SWI/SNF) target gene expression essential for 40S ribosomal subunit assembly. (A) Volcano plots of RNA sequencing (RNA‐seq) assay revealing the alteration of gene expression (fold change > 1.5, false discovery rate < 0.05) in IMR‐32 cells stably transfected with empty vector (mock) or CNBP. (B) Chromatin immunoprecipitation sequencing (ChIP‐seq) assay indicating endogenous enrichment of SMARCC2 or CNBP on target genes in IMR‐32 cells. (C) Schematic depiction (left panel) and Venn diagram (middle and right panels) showing the target genes of CNBP or SMARCC2 in indicated action modes, and those associated with survival of 498 (GSE62564), 649 (GSE45547) and 88 (GSE16476) neuroblastoma (NB) patients. (D) DAVID analysis of 124 SMRCCC2 target genes with significant association with survival of NB patients. (E) ChIP‐seq peak indicating SMARCC2 enrichment on promoter regions of target genes BYSL, NOP58 and RRP9. (F) By using first antibody specific for SMARCC2 or SMARCA4, sequential ChIP and qPCR assays indicating relative enrichment of SMARCC2, SMARCC1 or SMARCA4 (normalised to input) on promoter regions of BYSL, NOP58 and RRP9 in IMR‐32 cells stably transfected with mock, SMARCC2 or CNBP (n = 5). (G–I) Dual‐luciferase (G), real‐time quantitative reverse transcription‐polymerase chain reaction (qRT‐PCR, H) and western blot (I) assays indicating the promoter activity, transcript and protein levels of target genes BYSL, NOP58 and RRP9, as well as the expression of SMARCC1 and SMARCA4, in IMR‐32 cells stably transfected with mock, CNBP or SMARCC2. Fisher's exact test for overlapping analysis in (C). One‐way analysis of variance (ANOVA) with Bonferroni's multiple comparison test in (F–H). * p <  .05, ** p <  .01, *** p < .001 versus mock + mock. Data are shown as mean ± standard error of the mean (s.e.m.) (error bars) and representative of three independent experiments in (F–I).
FIGURE 6
FIGURE 6
Cellular nucleic acid‐binding protein (CNBP) represses tumour suppressive roles of SMARCC2 in ribosome biogenesis. (A) Schematic diagram (upper panel) indicating ribosomal RNA (rRNA) processing in human cells. Northern blot using 5′‐ITS1 or 18S rRNA probe (lower panels) revealing the amount of 18S rRNA precursors in IMR‐32 cells stably transfected with empty vector (mock), SMARCC2 or CNBP. The 28S rRNA was shown as loading control. (B–E) Sucrose gradient sedimentation (B), argyrophilic nucleolar organiser region (AgNOR) staining (C, n = 5), puromycin incorporation (D), and OP‐puro incorporation (E) assays showing the ribosomal subunit assembly, nucleolar organiser region (NOR) dots, nascent protein synthesis and protein production in IMR‐32 cells stably transfected with mock, SMARCC2 or CNBP. (F–I) Sucrose gradient sedimentation (F), AgNOR staining (G, n = 5), puromycin incorporation (H) and OP‐puro incorporation (I) assays indicating the ribosomal subunit assembly, nucleolar NOR dots, nascent protein synthesis and protein production in IMR‐32 cells stably transfected with mock or CNBP, and those treated with dimethylsulfoxide (DMSO) or CX‐5461 (5 µmol L−1) for 48 h (n = 4). (J and K) Representative images (left panel) and quantification (right panel) of soft agar (J) and Matrigel invasion (K) assays showing the anchorage‐independent growth and invasion of IMR‐32 cells stably transfected with mock or SMARCC2, and those co‐transfected with CNBP (n = 5). One‐way analysis of variance (ANOVA) with Bonferroni's multiple comparison test in (B, C, F, G, J and K). * p < .05, ** p < .01, *** p < .001 versus mock + mock. Data are shown as mean ± standard error of the mean (s.e.m.) (error bars) and representative of three independent experiments in (A–K).
FIGURE 7
FIGURE 7
Cellular nucleic acid‐binding protein (CNBP) facilitates extracellular vesicle‐mediated 18S ribosomal RNA (rRNA) delivery and M2 macrophages polarization via repressing SMARCC2 activity. (A) Schematic illustration (left panel) and western blot (right panel) indicating the polarisation of CD163‐ and CD206‐positive M2 macrophages from Tohoku Hospital Pediatrics‐1 (THP‐1) cells co‐cultured with IMR‐32 cells stably transfected with empty vector (mock), SMARCC2 or CNBP. (B and C) Electron microscopic observation (B), Northern blot and western blot (C) assays showing extracellular vesicles (EVs) extracted from IMR‐32 cells stably transfected with mock, SMARCC2 or CNBP. (D) Confocal images indicating uptake of Dil‐labelled EVs (red color, arrowheads) extracted from IMR‐32 cells stably transfected with mock, SMARCC2 or CNBP into M2 macrophages. Scale bars: 10 µm. (E) Real‐time quantitative reverse transcription‐polymerase chain reaction (qRT‐PCR) assay showing the transcript levels (normalised to β‐actin) of secretory macrophage markers interleukin‐10 (IL‐10) and transforming growth factor beta‐1 (TGFB1) in THP‐1 cells treated with EVs extracted from IMR‐32 cells stably transfected with mock, SMARCC2 or CNBP (n = 5). (F) In vivo imaging, growth, weight at the end points, Ki‐67 and CD31 expression, F4/80‐positive macrophages (brown, arrowheads) of subcutaneous xenograft tumours formed by injection of IMR‐32 cells stably transfected with mock or SMARCC2, and those co‐transfected with CNBP into the dorsal flanks of nude mice (n = 5 for each group). Scale bars: 100 µm. (G) In vivo imaging, haematoxylin and eosin staining (arrowheads), quantification of lung metastatic colonisation and Kaplan–Meier curves of nude mice treated with tail vein injection of IMR‐32 cells stably transfected with mock or SMARCC2, and those co‐transfected with CNBP (n = 5 for each group). Scale bars: 100 µm. One‐way analysis of variance (ANOVA) with Bonferroni's multiple comparison test in (E–G). Log‐rank test for survival comparison in (G). * p < .05, ** p < .01, *** p < .001 versus mock + mock. Data are shown as mean ± standard error of the mean (s.e.m.) (error bars) and representative of three independent experiments in (A–E).
FIGURE 8
FIGURE 8
Targeting phase separation and interaction of cellular nucleic acid‐binding protein (CNBP) with SMARCC2 inhibits neuroblastoma (NB) progression. (A) Three‐dimensional structure and sequences of wild‐type or mutant (Mut) inhibitory peptide (CIP‐12) blocking interaction between CNBP and SMARCC2. (B) Biotin‐labelled peptide pull‐down and western blot assays indicating the binding of inhibitory peptides (20 µmol L−1) to CNBP protein within lysates of BE(2)‐C cells. (C) Confocal images showing the distribution (arrowheads) of FITC‐labelled CIP‐12 or CIP‐12 Mut (20 µmol L−1) within cultured BE(2)‐C cells, with nuclei and cellular membranes staining by 4′,6‐diamidino‐2‐phenylindole (DAPI) or Dil. Scale bars: 10 µm. (D) Fluorescence imaging assay revealing the condensates of recombinant CNBP‐mCherry and SMARCC2‐EGFP proteins (left panel), CNBP and SMARCC2 in BE(2)‐C cells stably transfected with CNBP constructs (right panel, arrowheads), and those treated with CIP‐12 or CIP‐12 Mut (20 µmol L−1). Scale bars: 10 µm. (E) Co‐immunoprecipitation (Co‐IP) and western blot assays indicating the interaction between CNBP and SMARCC2 in BE(2)‐C cells treated with different doses of CIP‐12 or CIP‐12 Mut for 48 h. (F) Western blot assay showing the expression of CNBP, SMARCC2 or target genes in BE(2)‐C cells treated with CIP‐12 or CIP‐12 Mut (20 µmol L−1) for 48 h. (G) Quantification of soft agar and Matrigel invasion assays showing the anchorage‐independent growth and invasion capability of viable SH‐SY5Y and BE(2)‐C cells pretreated with CIP‐12 or CIP‐12 Mut (20 µmol L−1) for 48 h (n = 5 per group). (H and I) In vivo imaging (H), growth curve, weight at the end points (I) of xenograft tumours formed by subcutaneous injection of BE(2)‐C cells in nude mice (n = 5 per group) that were subsequently treated with intravenous injection of CIP‐12 or CIP‐12 Mut (3 mg kg−1) as indicated. Quantification of lung metastatic colonisation and Kaplan–Meier curves (I) of nude mice (n = 5 per group) treated with tail vein injection of BE(2)‐C cells and CIP‐12 or CIP‐12 Mut (3 mg kg−1) as indicated. (J) Mechanisms underlying oncogenic roles of CNBP: karyopherin subunit beta 1 (KPNB1) is responsible for nuclear transport of CNBP, whereas liquid condensates of CNBP interact with SMARCC2 to selectively inhibit the activity of SMARCC2/SMARCC1/SMARCA4 subunits, resulting in increase of SMARCC1/SMARCA4 binary complex‐facilitated gene expression essential for rRNA processing and ribosome biogenesis in tumour cells, which subsequently leads to extracellular vesicle‐mediated delivery of 18S rRNA and subsequent M2 macrophages polarization. A cell‐penetrating peptide blocking phase separation and interaction of CNBP with SMARCC2 inhibits ribosome biogenesis and progression of NB. Student's t test and one‐way analysis of variance (ANOVA) with Bonferroni's multiple comparison test in (G and I). Log‐rank test for survival comparison in (I). * p < .05, ** p < .01, *** p < .001 versus CIP‐12 Mut. Data are shown as mean ± standard error of the mean (s.e.m.) (error bars) and representative of three independent experiments in (A–G).

References

    1. Pinto NR, Applebaum MA, Volchenboum SL, et al. Advances in risk classification and treatment strategies for neuroblastoma. J Clin Oncol. 2015;33:3008‐3017. - PMC - PubMed
    1. Irwin MS, Naranjo A, Zhang FF, et al. Revised neuroblastoma risk classification system: a report from the Children's Oncology Group. J Clin Oncol. 2021;39:3229‐3241. - PMC - PubMed
    1. Armas P, Coux G, Weiner AMJ, et al. What's new about CNBP? Divergent functions and activities for a conserved nucleic acid binding protein. Biochim Biophys Acta Gen Subj. 2021;1865:129996. - PubMed
    1. Thornton CA, Wang E, Carrell EM. Myotonic dystrophy: approach to therapy. Curr Opin Genet Dev. 2017;44:135‐140. - PMC - PubMed
    1. Margarit E, Armas P, García Siburu N, et al. CNBP modulates the transcription of Wnt signaling pathway components. Biochim Biophys Acta. 2014;1839:1151‐1160. - PubMed

Publication types