Review
. 2023 Jul 24;62(30):e202302967.
doi: 10.1002/anie.202302967. Epub 2023 May 15.

DNA Nanotechnology for Investigating Mechanical Signaling in the Immune System

Affiliations
Review

DNA Nanotechnology for Investigating Mechanical Signaling in the Immune System

Yuesong Hu et al. Angew Chem Int Ed Engl. .

Abstract

Immune recognition occurs at specialized cell-cell junctions when immune cells and target cells physically touch. In this junction, groups of receptor-ligand complexes assemble and experience molecular forces that are ultimately generated by the cellular cytoskeleton. These forces are in the range of piconewton (pN) but play crucial roles in immune cell activation and subsequent effector responses. In this minireview, we will review the development of DNA based molecular tension sensors and their applications in mapping and quantifying mechanical forces experienced by immunoreceptors including T-cell receptor (TCR), Lymphocyte function-associated antigen (LFA-1), and the B-cell receptor (BCR) among others. In addition, we will highlight the use of DNA as a mechanical gate to manipulate mechanotransduction and decipher how mechanical forces regulate antigen discrimination and receptor signaling.

Keywords: DNA Tension Probe; Force Manipulating; Force Sensing; Immunoreceptor; Mechanical Signalling.


Figures

Figure 1.
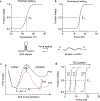
Figure 1.. Mechanical melting vs thermal melting of DNA hairpins.
a-b) DNA melting curves showing that the DNA hairpin unfolds with increased temperature or increased mechanical forces. c) Energy landscape of DNA mechanical unfolding “reaction”. Applied force alters the rate and the equilibrium of the reaction by lowering the transition state energy and unfolded state energy, respectively. d) Theoretical plot showing F1/2 increases with the GC content of the DNA hairpin stem region.
Figure 2.
Figure 2.. DNA duplexes melting under force.
a) Schematic showing rupturing a DNA duplex with different force application geometries (unzipping, shearing and intermediate). b) Δ Base pair determines the force application geometry, and it represents the number of base pairs between force application points. Plot showing the Ttol of a 21 mer DNA duplex increases with Δ Base pair.
Figure 3.
Figure 3.. Studying TCR force with DNA hairpin tension sensor
a) Schematic of DNA-TPs for mapping TCR-mediated tension. b) Time lapse images showing T-cell spread on DNA-TPs surface, and 12 pN tension signal was observed underneath the T-cell. c) TCR tension signal was correlated with calcium flux signal. d) Representative images showing that cytoskeleton inhibitors abolished TCR tension signal. Reproduced with permission.[8b] Copyright 2016, National Academy of Sciences, USA.
Figure 4.
Figure 4.. DNA-TPs on fluid membrane.
a) Ratiometric DNA-TPs for mapping TCR force on the SLB. TCR force unfolds DNA hairpin and separates the Cy3B/BHQ2 FRET pair, leading to an enhancement of Cy3B fluorescence over that of Atto488 which is insensitive to mechanical force. b) Representative images showing TCRs exerted forces to antigens on fluid substrate. Reproduced with permission.[39a] Copyright 2016, American Chemical Society
Figure 5.
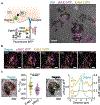
Figure 5.. DNA based microparticle tension for investigating TCR force on non-planar geometry
a) Schematic of μTS for mapping TCR forces at cell-μTS junctions. b) Representative images showing the interaction between T-cell and μTS and tension signal at the junction. c) Representative confocal images showing the colocalized ring-like force (green) and F-actin (red) patterns at the T-cell-μTS junction. Reproduced with permission. Copyright 2021, Wiley-VCH.
Figure 6.
Figure 6.. DNA-TPs for mapping LFA-1 forces.
a) Scheme of ICAM-1 DNA-TPs. b) Representative images show that T-cells spread and exerted tension on surfaces coated with DNA-TPs with a F1/2 of 4.7 or 19 pN. c) Schematic showing that spectrally encoded DNA-TPs simultaneously map TCR and LFA-1 forces. d) Tension maps of the LFA-1 and TCR forces. Colocalization analysis confirmed the lack of colocalization of LFA-1 and TCR forces at the lamella region of a spreading T-cell, but moderate colocalization was observed at the focal zone. Reproduced with permission.[22] Copyright 2022, American Association for the Advancement of Science
Figure 7.
Figure 7.. LFA-1 forces are correlated with cytotoxic degranulation
a) Investigating spatiotemporal correlations between degranulation events and receptor force events with DNA-TPs. F = fluorophore, Q = quencher, G = pHluorin. Representative images showing the T-cell spreading and real-time TCR and LFA-1 tension signals underneath the T-cell. b) Time-lapse images showing a representative degranulation event (indicated by a white arrowhead) together with TCR and LFA-1 tension signals. c) Comparison of TCR force and LFA-1 signals at the degranulation spots. Line scan analysis confirmed the correlation between LFA-1 force and degranulation signal. Reproduced with permission.[41] Copyright 2022, Springer Nature.
Figure 8.
Figure 8.. DNA-TPs for mapping BCR forces
a) Design of DNA-TPs for measuring BCR forces. b) Time lapse images showing the growth of BCR force signal exerted by naïve and GC B-cells. c) Quantitative comparison of tension signal of naïve and GC B-cells on different F1/2 DNA-TPs. Reproduced with permission.[24] Copyright 2016, Springer Nature. d) Time lapse images showing the dynamics of BCR force signal across the human naïve and LZ GC B-cell surfaces. Reproduced with permission. e) Quantification of tension signal exerted by human naïve and GC B-cells.[39b] Copyright 2018, American Association for the Advancement of Science
Figure 9.
Figure 9.. Force triggered DNA binding for capturing transient force events.
a) Schematic showing that locking strand selectively binds to mechanically opened DNA-TPs and locked it at the open state. Unlocking strand can release the locking strand through toehold-mediated strand displacement reaction. b) Time lapse imaging showing the TCR tension signal increased over time after addition of locking strand. c) Representative images showing PD-1 tension signal before (real-time tension) and after adding locking strand (locked tension). Reproduced with permission.[23] Copyright 2019, National Academy of Sciences, USA.
Figure 10.
Figure 10.. TCR forces amplify the specificity of T-cell recognition.
a) Schematic showing pMHC tagged TGTs can be utilized to manipulate TCR forces. The threshold of TGT is dependent on the force applying geometry which is tuneable by changing the ligand position. b) Representative images showing stronger T-cell activation signal on 12 pN TGT surfaces compared with 56 pN TGT surfaces. c) Bar graphs showing pYZap70 levels of T-cells seeded on surface presenting antigens with different potencies. Antigens were anchored on 12 and 56 pN TGTs. d) Plot showing pYZAP70 levels of T-cells in response to antigens on 12 and 56 pN TGT surfaces. The slopes (m) of lines indicate the specificities of T-cells to antigens in each condition. Reproduced with permission.[8b] Copyright 2016, National Academy of Sciences, USA.
Figure 11.
Figure 11.. LFA-1-ICAM-1 force regulates TCR signalling.
a) ICAM-1 TGT for manipulating the forces transmitted to LFA-1-ICAM bonds. b) Plot showing T-cell displayed higher pYZAP70 intensities on 12 pN ICAM-1 TGT substrates. c) Plot quantifying the pYZap70 intensity of cells seeded on altered peptide antigens together with 12/56 pN ICAM TGTs d) Schematic showing multiplexed TGT surfaces where ICAM and antigen were both tethered to 12 or 56 TGT. e) Plot quantifying pYZap70 levels on multiplexed TGT surfaces. Reproduced with permission.[22] Copyright 2022, American Association for the Advancement of Science
Figure 12.
Figure 12.. BCR forces facilitate BCR signaling and B-cell activation.
a) Schematic showing the designs of TGT with thresholds ranging from 12 to 56 pN to manipulate BCR forces. b) Bar graphs comparing the levels of BCR accumulation on different TGT surfaces. c) Bar graphs illustrates the variations in the sizes of BCR microclusters across different TGT surfaces. d) Bar graphs quantifying the recruitments of signaling molecules pSyk, pPLCγ2, and pTyr to the B-cell IS. Reproduced with permission.[54] Copyright 2015. eLife Sciences Publications.

Similar articles

Cited by

References

    1. Huppa JB, Davis MM, Nat. Rev. Immunol. 2003, 3, 973–983. - PubMed
    1. Hoffman BD, Grashoff C, Schwartz MA, Nature 2011, 475, 316–323; - PMC - PubMed
    2. Vining KH, Mooney DJ, Nat. Rev. Mol. Cell Biol. 2017, 18, 728–742; - PMC - PubMed
    3. Trepat X, Wasserman MR, Angelini TE, Millet E, Weitz DA, Butler JP, Fredberg JJ, Nat. Phys. 2009, 5, 426–430;
    4. Huse M, Nat. Rev. Immunol. 2017, 17, 679–690. - PMC - PubMed
    1. Murrell M, Oakes PW, Lenz M, Gardel ML, Nat. Rev. Mol. Cell Biol. 2015, 16, 486–498. - PMC - PubMed
    1. Das DK, Feng Y, Mallis RJ, Li X, Keskin DB, Hussey RE, Brady SK, Wang JH, Wagner G, Reinherz EL, Lang MJ, Proc. Natl. Acad. Sci. U S A 2015, 112, 1517–1522; - PMC - PubMed
    2. Kim ST, Takeuchi K, Sun ZY, Touma M, Castro CE, Fahmy A, Lang MJ, Wagner G, Reinherz EL, J. Biol. Chem. 2009, 284, 31028–31037. - PMC - PubMed
    1. Gaud G, Lesourne R, Love PE, Nat. Rev. Immunol. 2018, 18, 485–497. - PubMed

Publication types

LinkOut - more resources