. 2022:1:3.

FGF21 has a sex-specific role in calorie-restriction-induced beiging of white adipose tissue in mice

Affiliations

FGF21 has a sex-specific role in calorie-restriction-induced beiging of white adipose tissue in mice

Mariah F Calubag et al. Aging Biol. 2022.

Abstract

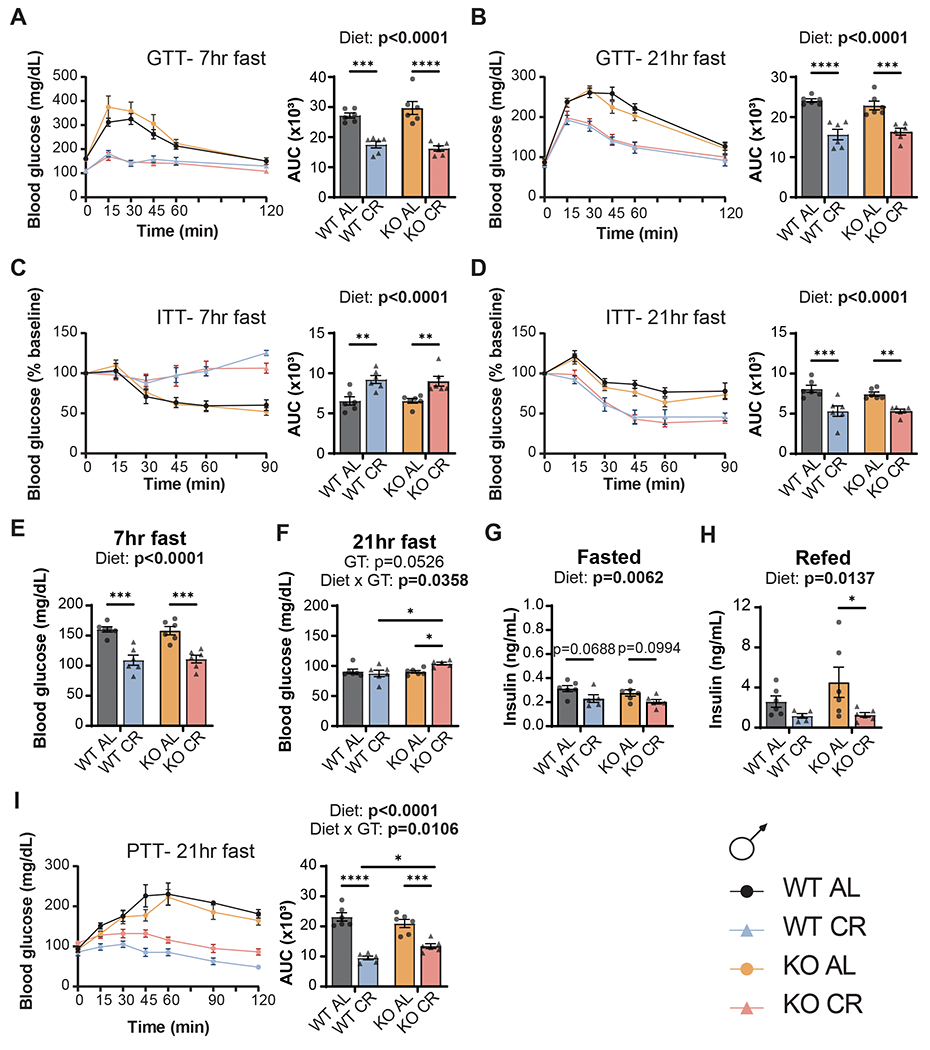
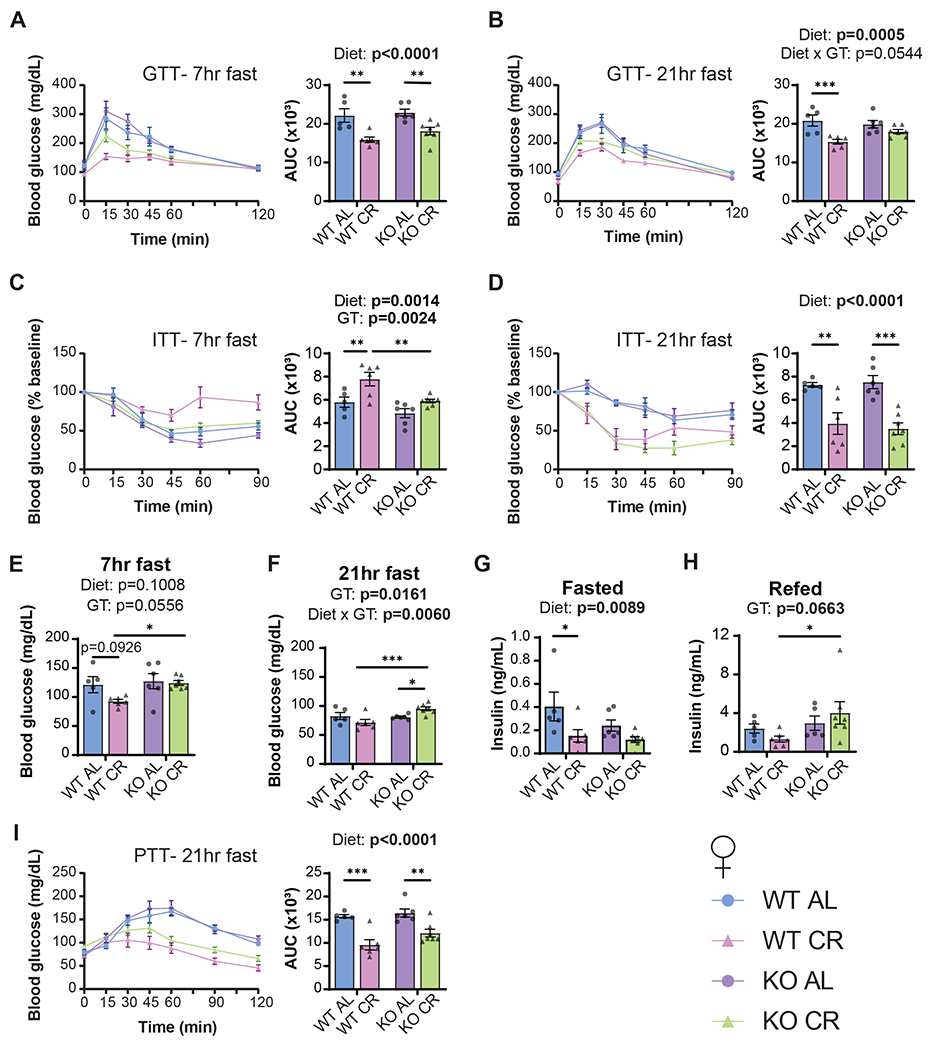
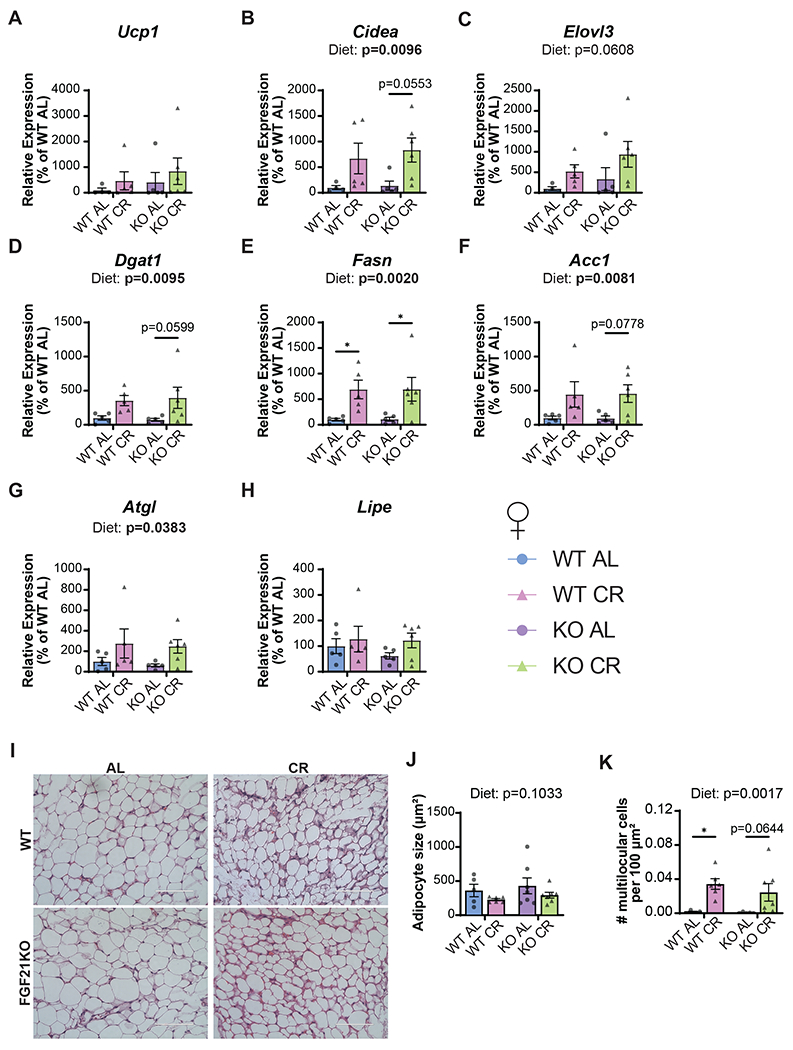
Calorie restriction (CR) promotes healthspan and extends the lifespan of diverse organisms, including mice, and there is intense interest in understanding the molecular mechanisms by which CR functions. Some studies have demonstrated that CR induces fibroblast growth factor 21 (FGF21), a hormone that regulates energy balance and that when overexpressed, promotes metabolic health and longevity in mice, but the role of FGF21 in the response to CR has not been fully investigated. We directly examined the role of FGF21 in the physiological and metabolic response to a CR diet by feeding Fgf21-/- and wild-type control mice either ad libitum (AL) diet or a 30% CR diet for 15 weeks. Here, we find that FGF21 is largely dispensable for CR-induced improvements in body composition and energy balance, but that lack of Fgf21 blunts CR-induced changes aspects of glucose regulation and insulin sensitivity in females. Surprisingly, despite not affecting CR-induced changes in energy expenditure, loss of Fgf21 significantly blunts CR-induced beiging of white adipose tissue in male but not female mice. Our results shed new light on the molecular mechanisms involved in the beneficial effects of a CR diet, clarify that FGF21 is largely dispensable for the metabolic effects of a CR diet, and highlight a sex-dependent role for FGF21 in the molecular adaptation of white adipose tissue to CR.

Keywords: FGF21; beiging; calorie restriction; glucose homeostasis; metabolic health; white adipose tissue.


Conflict of interest statement

D.W.L has received funding from, and is a scientific advisory board member of, Aeovian Pharmaceuticals, which seeks to develop novel, selective mTOR inhibitors for the treatment of various diseases. The remaining authors declare no competing interests.

Figures

Figure 1.
Figure 1.. Loss of Fgf21 does not impact the effect of CR on body weight, body composition and food consumption in male mice.
(A) Plasma FGF21 levels from male mice on either an AL or CR diet for 20 weeks (B) Experimental design. (C-D) Body weight measurement of male mice on the indicated diets (C) with final body weight at 15 weeks (D). (E-F) Fat mass measurement of male mice on the indicated diets (E) with final fat mass at 13 weeks (F). (G-H) Lean mass measurement of male mice on the indicated diets (G) with final lean mass at 13 weeks (H). (I-J) Adiposity of male mice on the indicated diets (I) with final adiposity at 13 weeks (J). (K-L) Food consumption (kcal/day) of male mice on the indicated diets (K) with average food consumed (L). (M-N) Food consumption per gram of body weight (kcal/day/g BW) of male mice on the indicated diets (M) with average food consumed per gram of body weight (N). (A) n=9 males/group, **= p=0.0027, unpaired two-tailed t-test. (C-N) n=5-6 mice/group. For longitudinal studies, statistics for the overall effects of genotype, diet, and the interaction represent the p value from a two-way repeated measures (RM) ANOVA or residual maximum likelihood (REML) analysis conducted individually for each genotype. For analyses of weight or body composition as a single time point, or analysis of average food consumption, statistics for the overall effects of genotype, diet, and the interaction represent the p value from a two-way ANOVA; *p<0.05, **p<0.01, **p<0.001, ****p<0.0001 Sidak’s test post 2-way ANOVA. Data represented as mean ± SEM.
Figure 2.
Figure 2.. Loss of Fgf21 does not impact the effect of CR on body weight, body composition and food consumption in female mice.
(A) Plasma FGF21 levels from female mice on either an AL or CR diet for 20 weeks (B) Experimental design. (C-D) Body weight measurement of female mice on the indicated diets (C) with final body weight at 15 weeks (D). (E-F) Fat mass measurement of female mice on the indicated diets (E) with final fat mass at 13 weeks (F). (G-H) Lean mass measurement of female mice on the indicated diets (G) with final lean mass at 13 weeks (H). (I-J) Adiposity of female mice on the indicated diets (I) with final adiposity at 13 weeks (J). (K-L) Food consumption (kcal/day) of female mice on the indicated diets (K) with average food consumed (L). (M-N) Food consumption per gram of body weight (kcal/day/g BW) of female mice on the indicated diets (M) with average food consumed per gram of body weight (N). (A) n=10 females/group, *p=0.0122, unpaired two-tailed t-test. (C-N) n=5-7 mice/group. For longitudinal studies, statistics for the overall effects of genotype, diet, and the interaction represent the p value from a two-way RM ANOVA or residual maximum likelihood (REML) analysis conducted individually for each genotype. For analyses of weight or body composition as a single time point, or analysis of average food consumption, statistics for the overall effects of genotype, diet, and the interaction represent the p value from a two-way ANOVA; *p<0.05, **p<0.01, **p<0.001, ****p<0.0001 Sidak’s test post 2-way ANOVA. Data represented as mean ± SEM.
Figure 3.
Figure 3.. FGF21 is largely dispensable for the effects of CR on glucose homeostasis in male mice.
(A-B) A glucose tolerance test (GTT) was conducted after a 7-hour (A) or 21-hour (B) fast. (C-D) An insulin tolerance test (ITT) was conducted after a 7-hour (C) or 21-hour (D) fast. (E-F) Fasting blood glucose (FBG) was measured after a 7-hour (E) or 21-hour (F) fast prior to the start of the ITT in panels C & D. (G-H) Plasma insulin was determined after a 16-hour fast (G) and after a 3-hour refeeding (H) after 15 weeks on diet. (I) A pyruvate tolerance test (PTT) was conducted after a 21-hour fast. (A-F, I) GTTs, ITTs, and PTT were performed between 8-13 weeks on diet regimens. (A-I) n=5-6 mice/group; statistics for the overall effects of genotype, diet, and the interaction represent the p value from a two-way ANOVA, *p<0.05, **p<0.01, **p<0.001, ****p<0.0001 from a Sidak’s post-test examining the effect of parameters identified as significant in the 2-way ANOVA. Data represented as mean ± SEM.
Figure 4.
Figure 4.. Loss of Fgf21 impacts glucose homeostasis in female mice under specific feeding conditions.
(A-B) A glucose tolerance test (GTT) was conducted after a 7-hour (A) or 21-hour (B) fast. (C-D) An insulin tolerance test (ITT) was conducted after a 7-hour (C) or 21-hour (D) fast. (E-F) Fasting blood glucose (FBG) was measured after a 7-hour (E) or 21-hour (F) fast prior to the start of the ITT in panels C & D. (G-H) Plasma insulin was determined after a 16-hour fast (G) and after a 3-hour refeeding (H) after 15 weeks on diet. (I) A pyruvate tolerance test (PTT) was conducted after a 21-hour fast. (A-F, I) GTTs, ITTs, and PTT were performed between 8-13 weeks on diet regimens. (A-I) n=5-7 mice/group; statistics for the overall effects of genotype, diet, and the interaction represent the p value from a two-way ANOVA, *p<0.05, **p<0.01, **p<0.001, ****p<0.0001 from a Sidak’s post-test examining the effect of parameters identified as significant in the 2-way ANOVA. Data represented as mean ± SEM.
Figure 5.
Figure 5.. Loss of Fgf21 does not affect heat, respiratory exchange ratio (RER) or spontaneous activity in CR-fed male and female mice.
(A-B) Energy expenditure of male mice as a function of body weight (A) and lean mass (B) over a 24-hour period. (C-D) Respiratory Exchange Ratio (RER) of male mice over the course of a 24-hour period (C) or averaged during the light and dark cycles (D). Arrow indicates feeding time of CR mice. (E) Spontaneous activity of male mice. (F-G) Energy expenditure of female mice as a function of body weight (F) and lean mass (G) over a 24-hour period. (H-I) RER of female mice over the course of a 24-hour period (H) or averaged during the light and dark cycles (I). Arrow indicates feeding time of CR mice. (J) Spontaneous activity of female mice. (A-J) Energy expenditure, RER and spontaneous activity was determined after mice were on the dietary regimens for 13-15 weeks. n=5-6 (males), n=5-7 (females). (A-B, F-G) data for each individual mouse is plotted; simple linear regression (ANCOVA) was calculated to determine if the slopes or elevations are equal; if the slopes are significantly different, differences in elevation cannot be determined. (C, H) statistics for the overall effects of genotype, diet, and the interaction represent the p value from a two-way RM ANOVA or REML analysis conducted individually for each genotype. (D, I) statistics for the overall effects of genotype, diet, and the interaction represent the p value from a two-way ANOVA conducted separately for the light and dark cycles; *p<0.05, **p<0.01, **p<0.001, ****p<0.0001 from a Sidak’s post-test examining the effect of parameters identified as significant in the 2-way ANOVA. (E, J) statistics for the overall effects of genotype, diet, and the interaction represent the p value from a two-way ANOVA; *p<0.05, Sidak’s test post 2-way ANOVA. Data represented as mean ± SEM.
Figure 6:
Figure 6:. Loss of Fgf21 blunts CR-induced beiging in the inguinal white adipose tissue of male mice.
(A-C) The expression of three thermogenic genes, Ucp1 (A), Cidea (B) and Elovl3 (C) was quantified in the inguinal white adipose tissue (iWAT) of male mice. (D-F) The expression of three lipogenic genes, Dgat1 (D), Fasn (E) and Acc1 (F) was quantified in the iWAT of male mice. (G-H) The expression of the lipolytic genes Atgl (G) and Lipe (H) was quantified in the iWAT of male mice. (I) Hematoxylin and eosin (HE) staining (representative images; scale bar=100μm, 40X magnification) from iWAT of male mice. (J) Quantified adipocyte size (μm2) from HE-stained iWAT images from male mice. (K) Number of multilocular cells per 100 μm2 of HE-stained iWAT images of male mice. (A-H, J-K) n=5-6 mice/group; statistics for the overall effects of genotype, diet, and the interaction represent the p value from a two-way ANOVA, *p < 0.05, **p<0.01, **p<0.001, ****p<0.0001 from a Sidak’s post-test examining the effect of parameters identified as significant in the 2-way ANOVA. Data represented as mean ± SEM.
Figure 7:
Figure 7:. Loss of Fgf21 does not impact CR-induced beiging in the inguinal white adipose tissue of female mice.
(A-C) The expression of three thermogenic genes, Ucp1 (A), Cidea (B) and Elovl3 (C) was quantified in the inguinal white adipose tissue (iWAT) of female mice. (D-F) The expression of three lipogenic genes, Dgat1 (D), Fasn (E) and Acc1 (F), was quantified in the iWAT of female mice. (G-H) The expression of the lipolytic genes Atgl (G) and Lipe (H) was quantified in the iWAT of female mice. (I) Hematoxylin and eosin (HE) staining (representative images; scale bar = 100μm, 40X magnification) from iWAT of female mice. (J) Quantified adipocyte size (μm2) from HE-stained iWAT images from female mice. (K) Number of multilocular cells per 100 μm2 of HE-stained iWAT images of female mice. (A-H, J-K) n=4-7 mice/group; statistics for the overall effects of genotype, diet, and the interaction represent the p value from a two-way ANOVA, *p < 0.05, **p<0.01, **p<0.001, ****p<0.0001 from a Sidak’s post-test examining the effect of parameters identified as significant in the 2-way ANOVA. Data represented as mean ± SEM.
Figure 8:
Figure 8:. Loss of Fgf21 does not affect the overall phenotypic response to CR, but blunts the induction of iWAT genes in a sex-specific manner.
(A) Phenotypic measurements of individual mice visualized by genotype and diet groups and split by sex indicating separation along PC1 and PC2; 95% confidence ellipses are indicated. (B) Log2 fold changes in gene expression induced by CR in the iWAT of each genotype and sex of mice were z-scaled normalized.

References

    1. Acosta-Rodriguez V, Rijo-Ferreira F, Izumo M, Xu P, Wight-Carter M, Green CB, & Takahashi JS (2022). Circadian alignment of early onset caloric restriction promotes longevity in male C57BL/6J mice. Science, 376(6598), 1192–1202. doi:10.1126/science.abk0297 - DOI - PMC - PubMed
    1. Balasubramanian P, Schaar AE, Gustafson GE, Smith AB, Howell PR, Greenman A, … Anderson RM (2021). Adiponectin receptor agonist AdipoRon improves skeletal muscle function in aged mice. bioRxiv, 2021.2009.2016.460597. doi:10.1101/2021.09.16.460597 - DOI - PMC - PubMed
    1. Bellantuono I, de Cabo R, Ehninger D, Di Germanio C, Lawrie A, Miller J, … Lamming DW (2020). A toolbox for the longitudinal assessment of healthspan in aging mice. Nat Protoc, 15(2), 540–574. doi:10.1038/s41596-019-0256-1 - DOI - PMC - PubMed
    1. Belsky DW, Huffman KM, Pieper CF, Shalev I, & Kraus WE (2017). Change in the Rate of Biological Aging in Response to Caloric Restriction: CALERIE Biobank Analysis. J Gerontol A Biol Sci Med Sci, 73(1), 4–10. doi:10.1093/gerona/glx096 - DOI - PMC - PubMed
    1. Bonkowski MS, Rocha JS, Masternak MM, Al Regaiey KA, & Bartke A (2006). Targeted disruption of growth hormone receptor interferes with the beneficial actions of calorie restriction. Proc Natl Acad Sci U S A, 103(20), 7901–7905. doi:10.1073/pnas.0600161103 - DOI - PMC - PubMed

LinkOut - more resources