. 2023 May 23;120(21):e2220684120.
doi: 10.1073/pnas.2220684120. Epub 2023 May 15.

Loss of insulin signaling in astrocytes exacerbates Alzheimer-like phenotypes in a 5xFAD mouse model

Affiliations

Loss of insulin signaling in astrocytes exacerbates Alzheimer-like phenotypes in a 5xFAD mouse model

Wenqiang Chen et al. Proc Natl Acad Sci U S A. .

Abstract

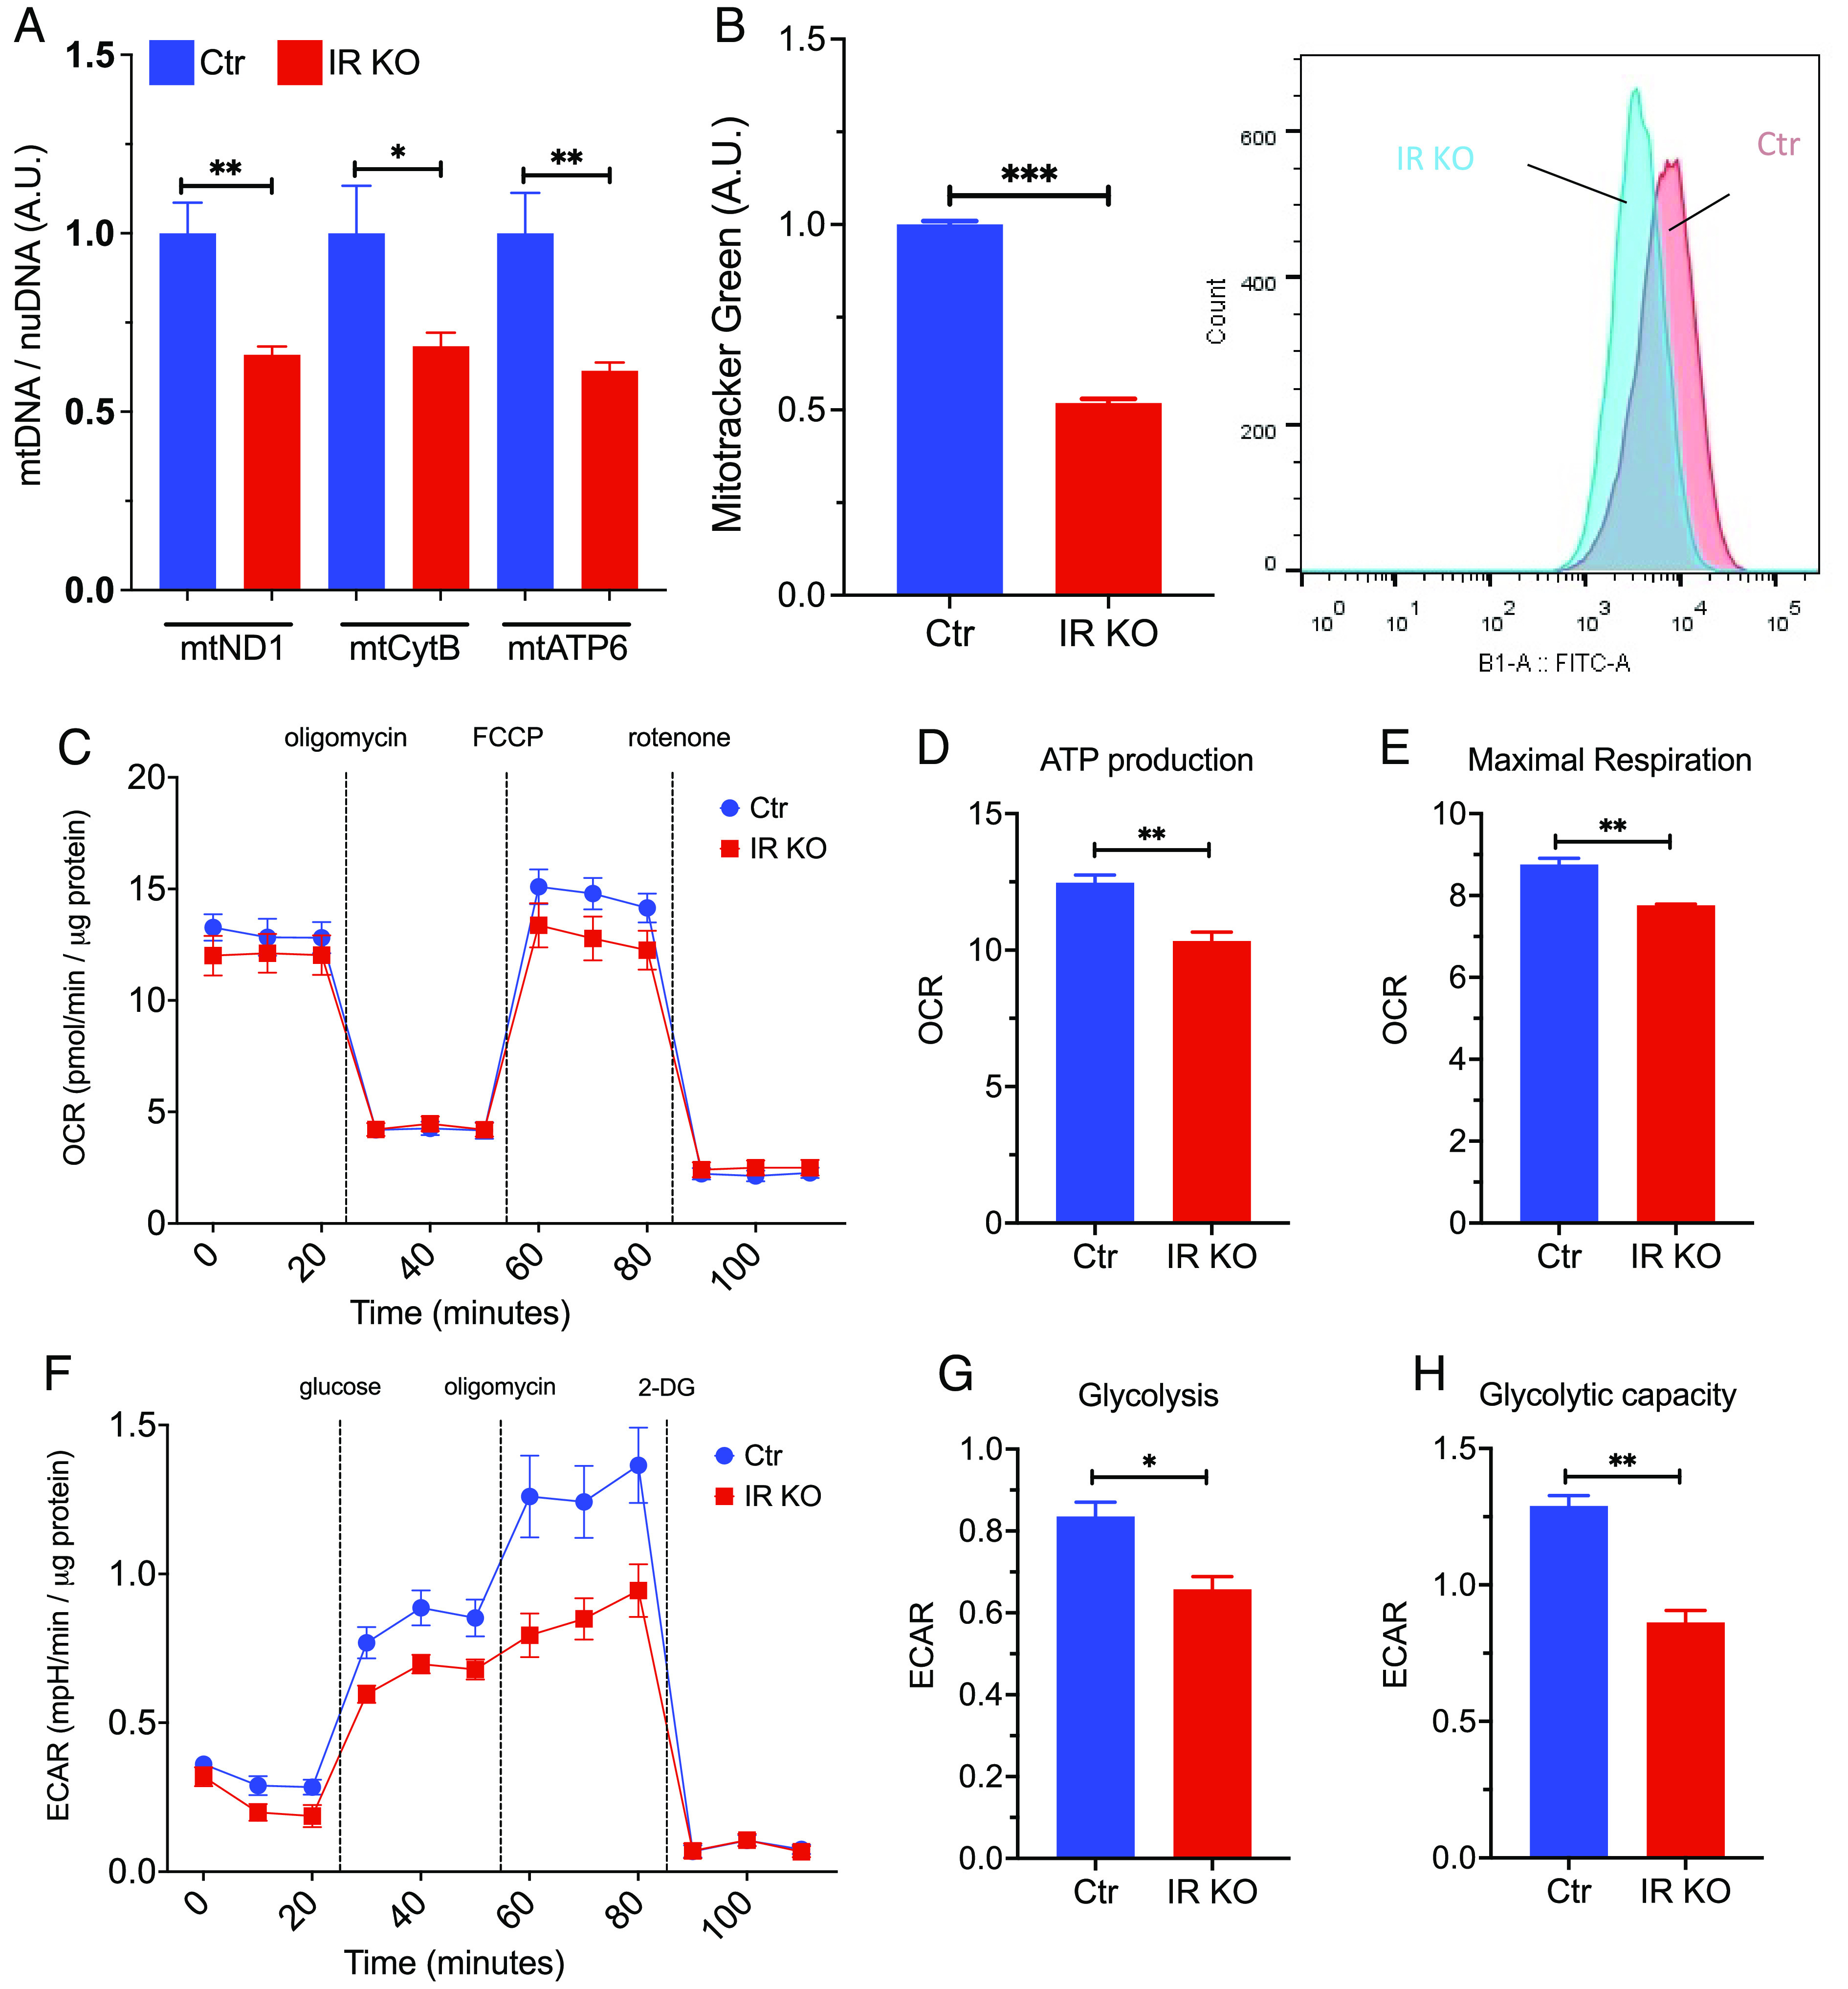
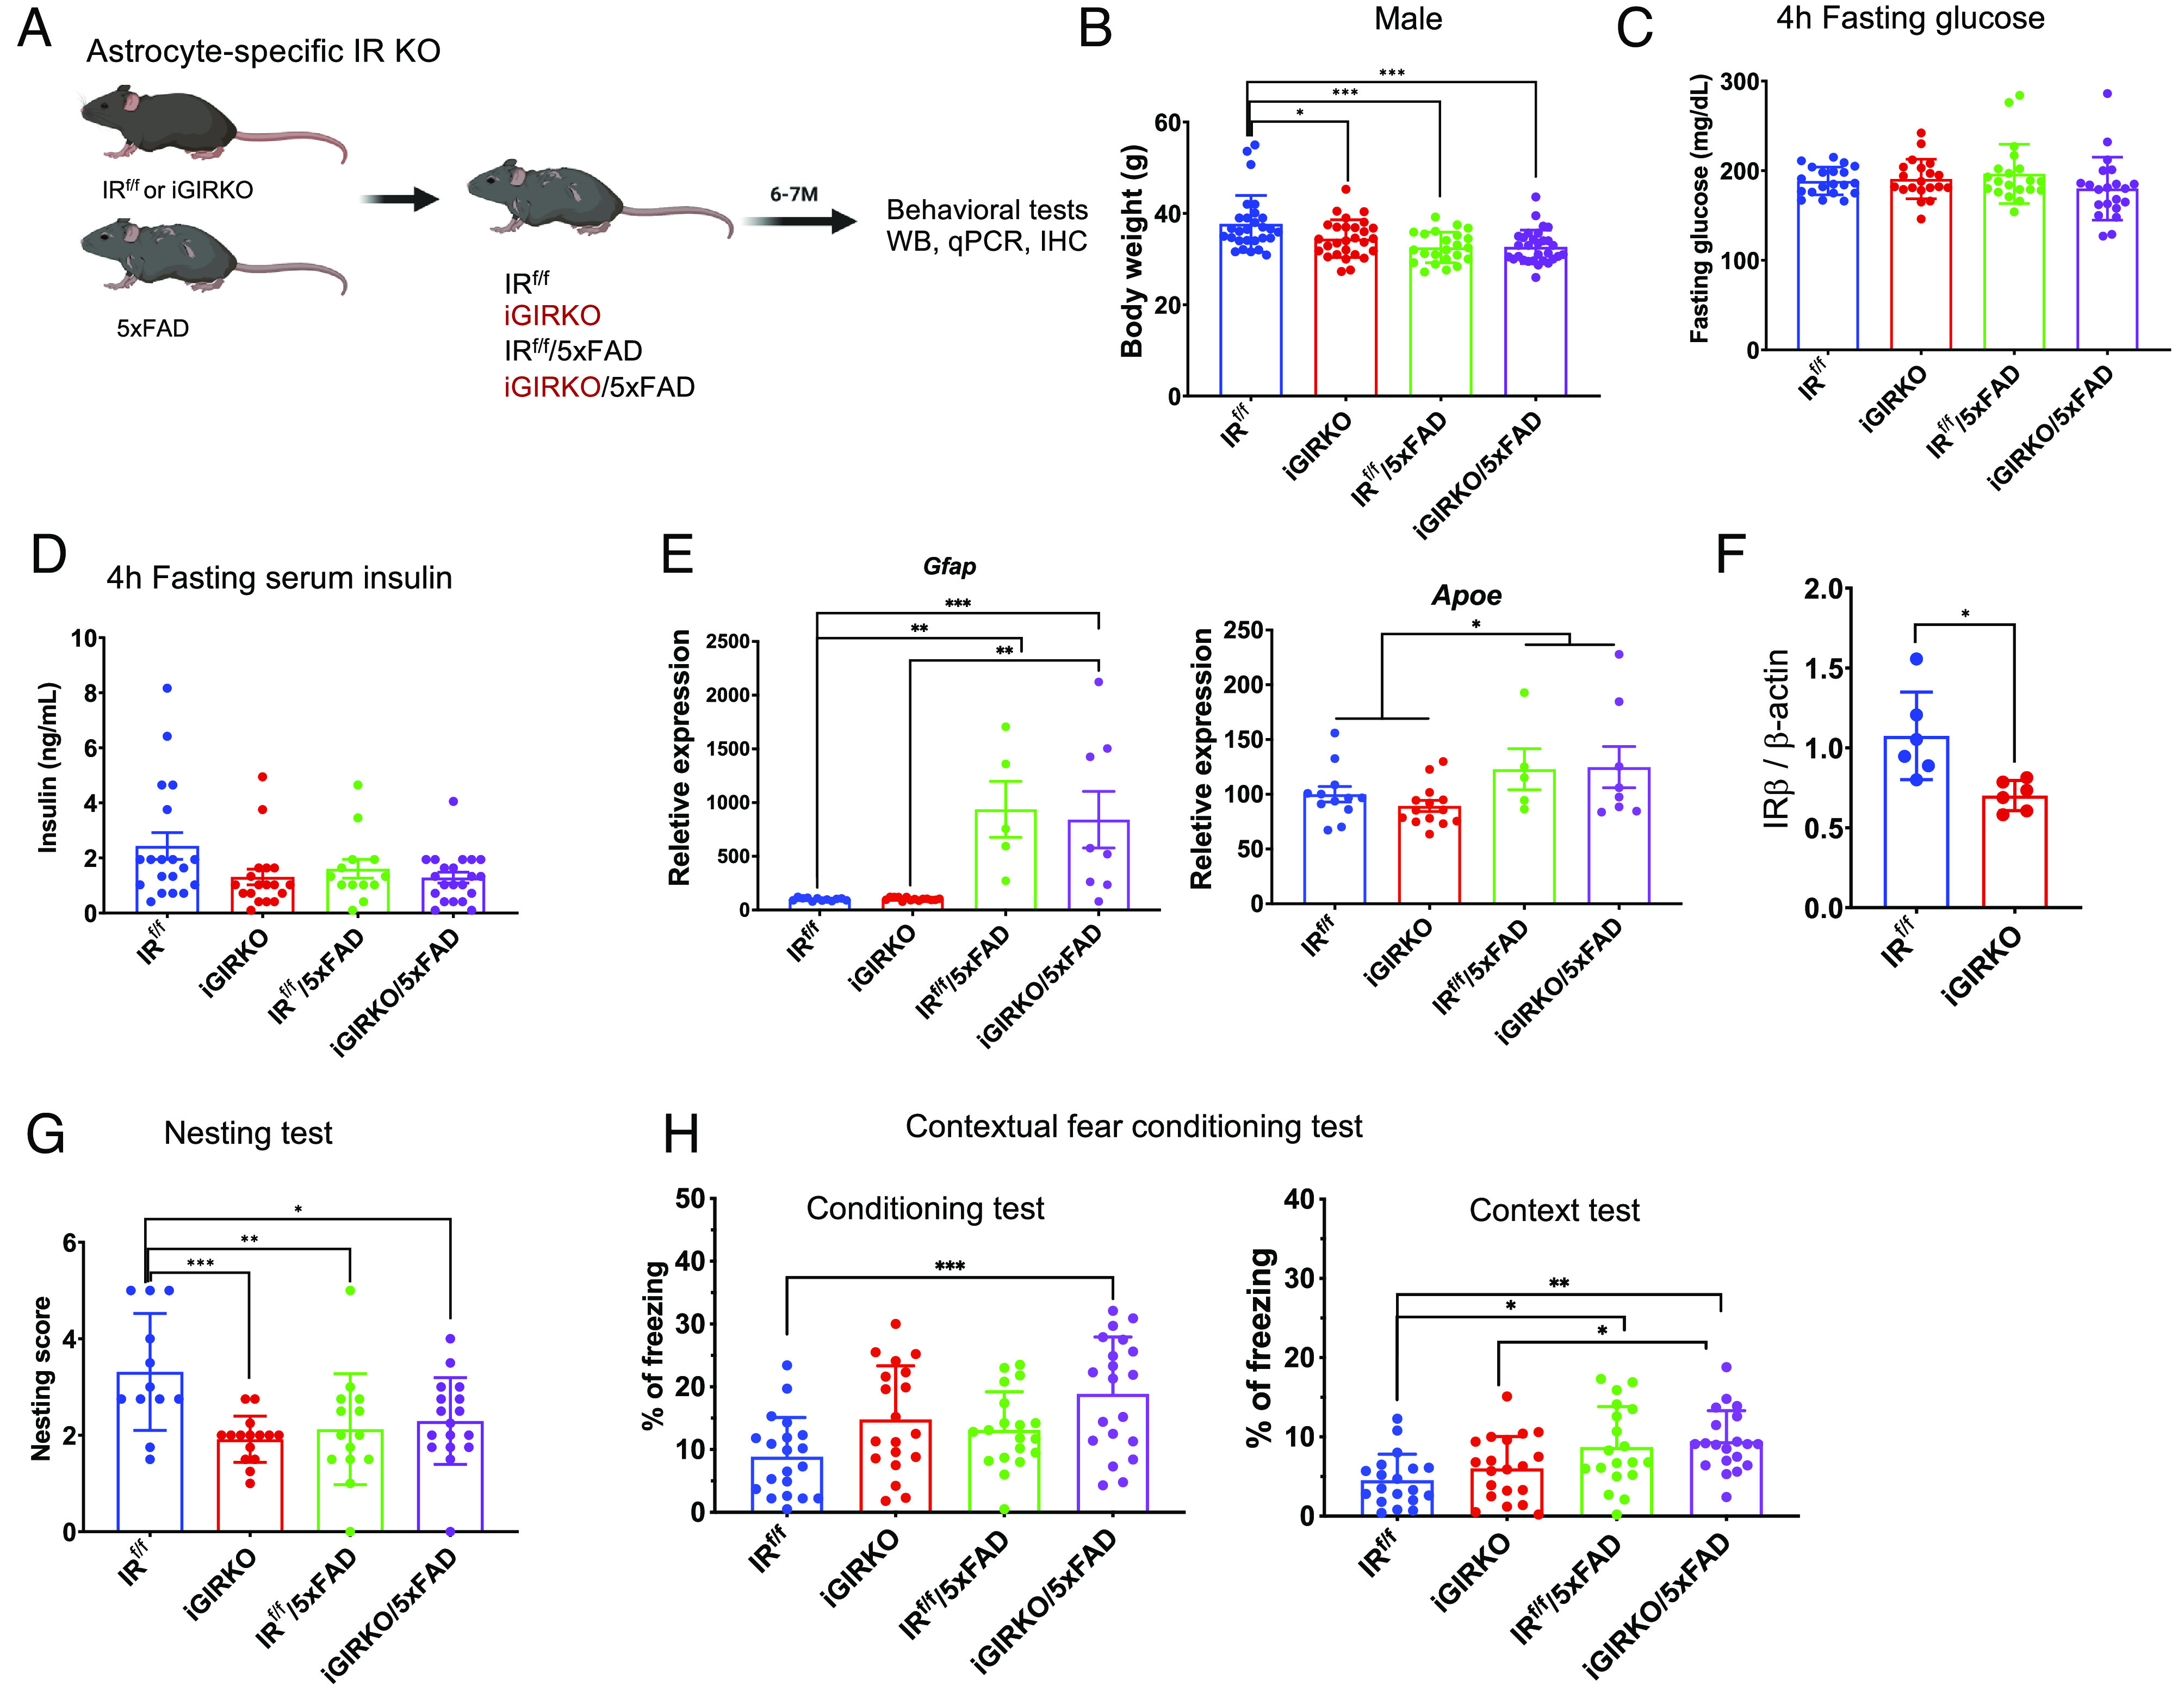
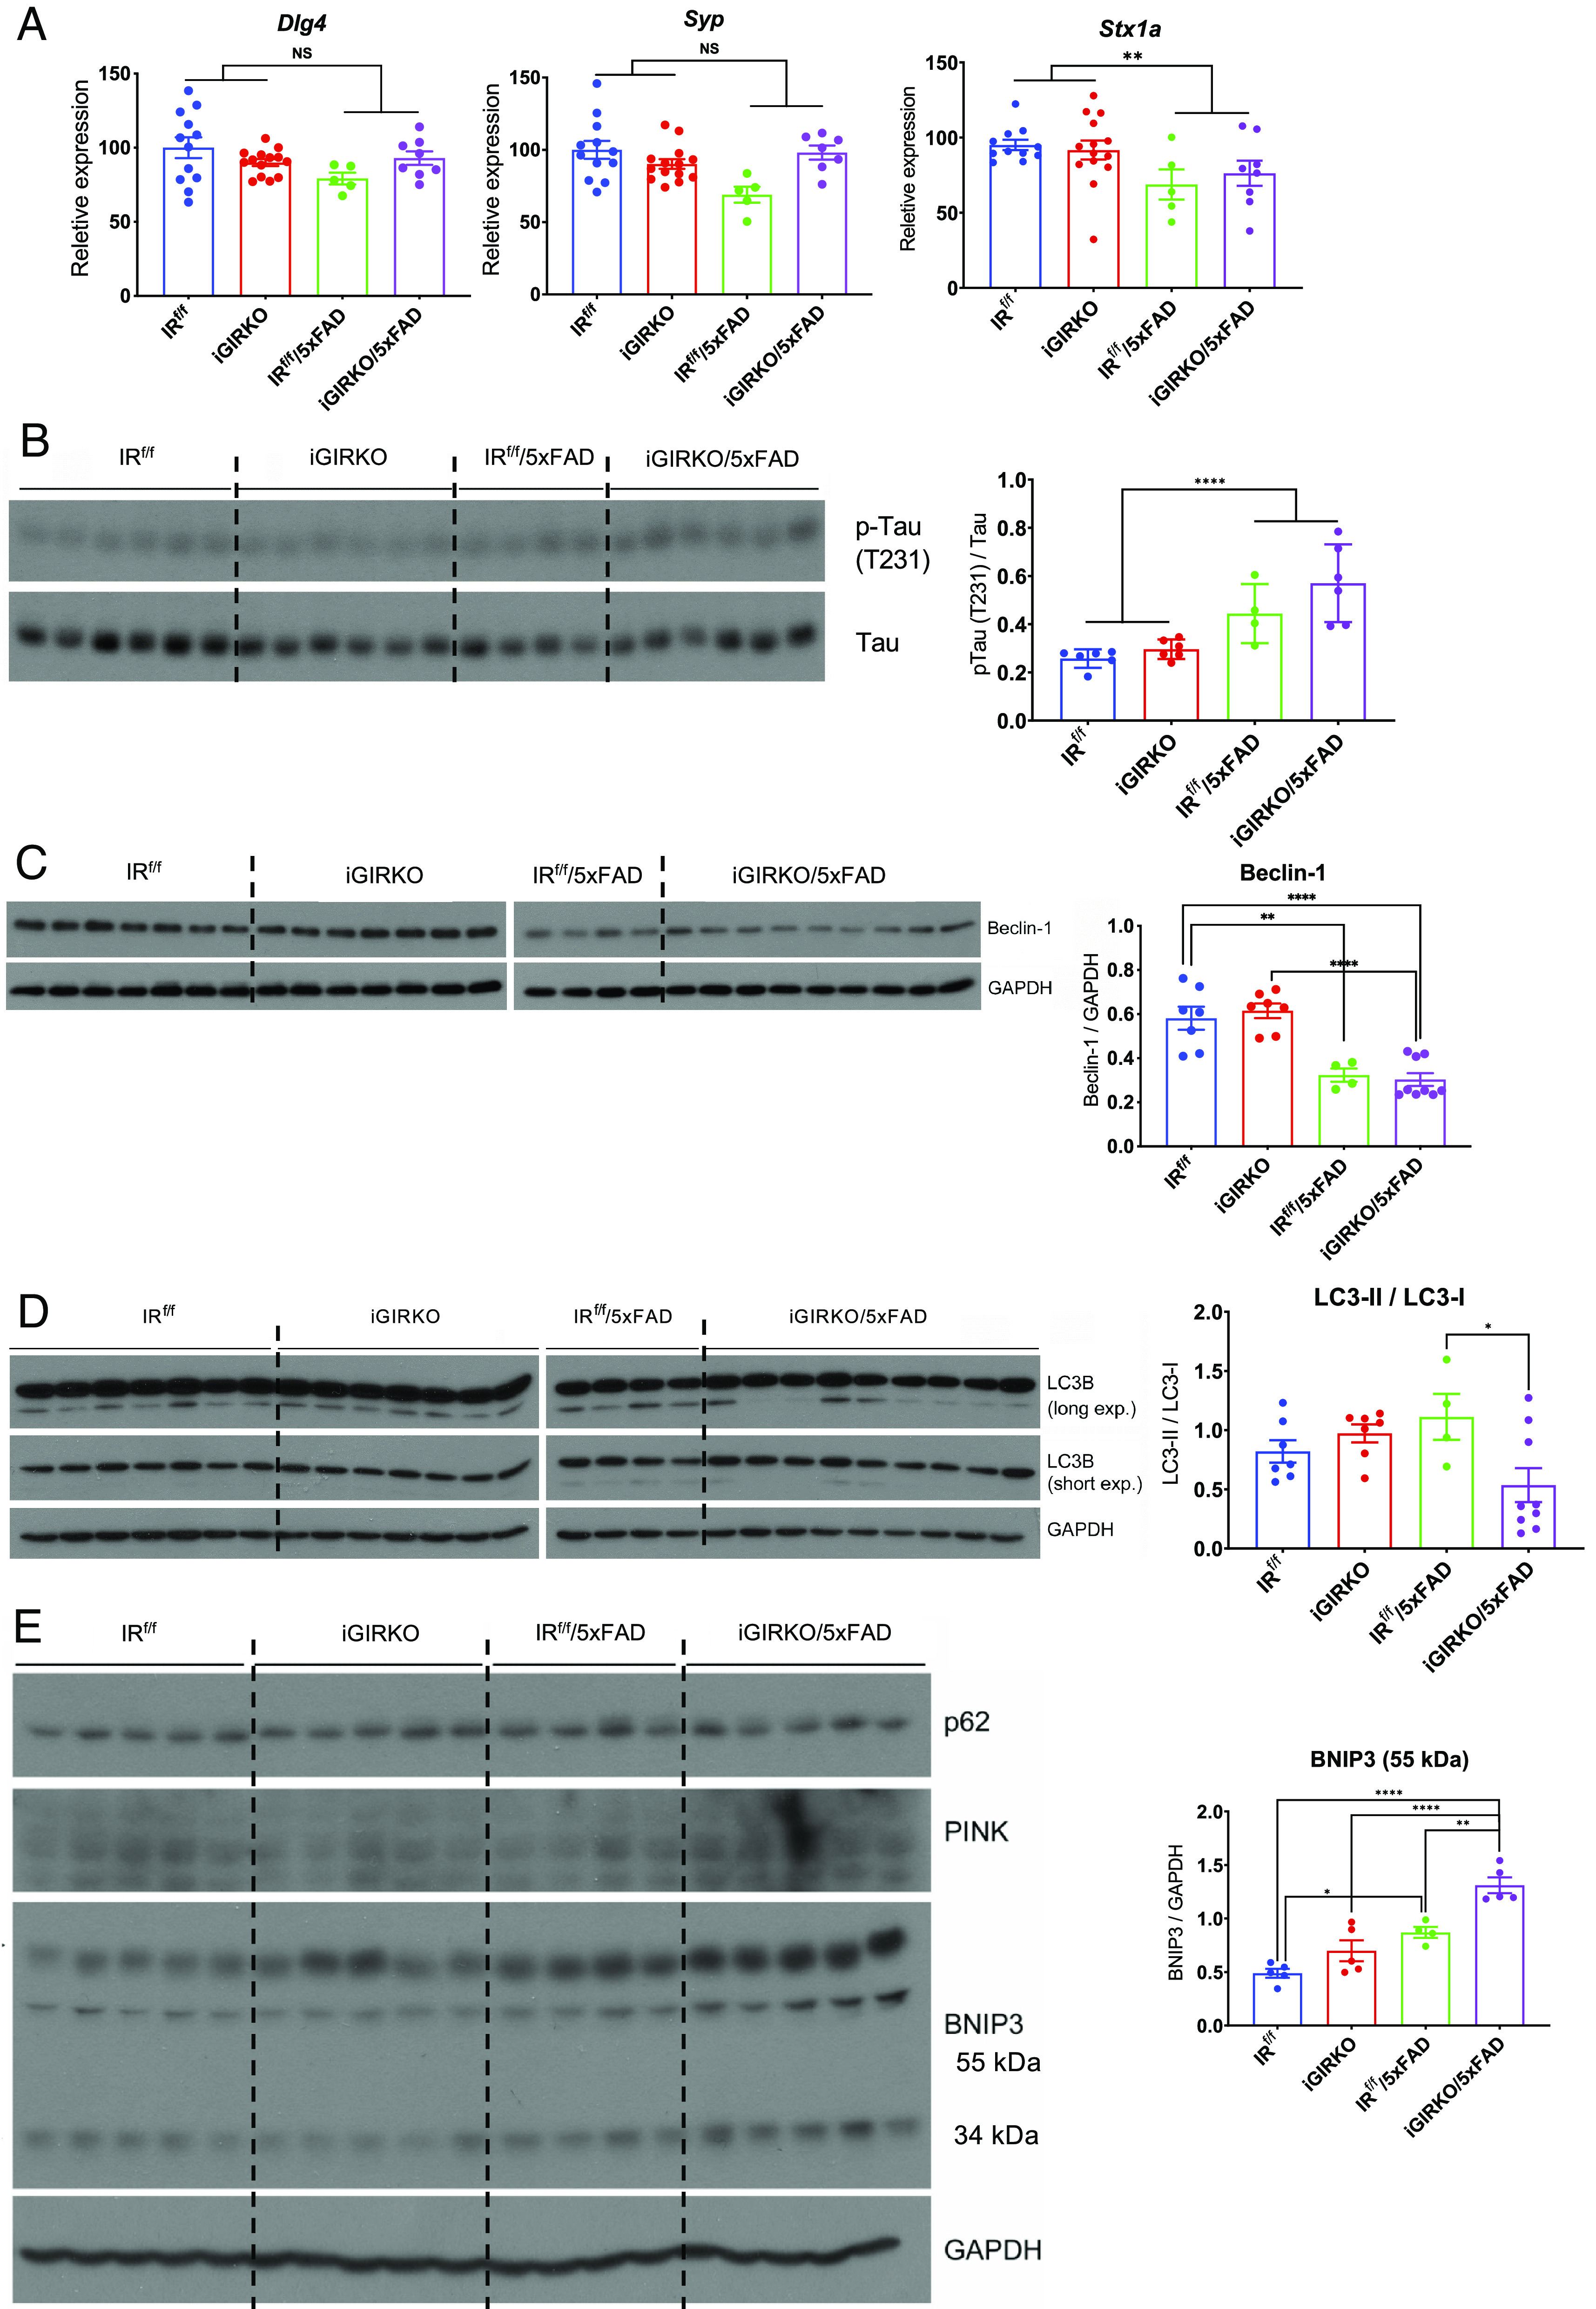
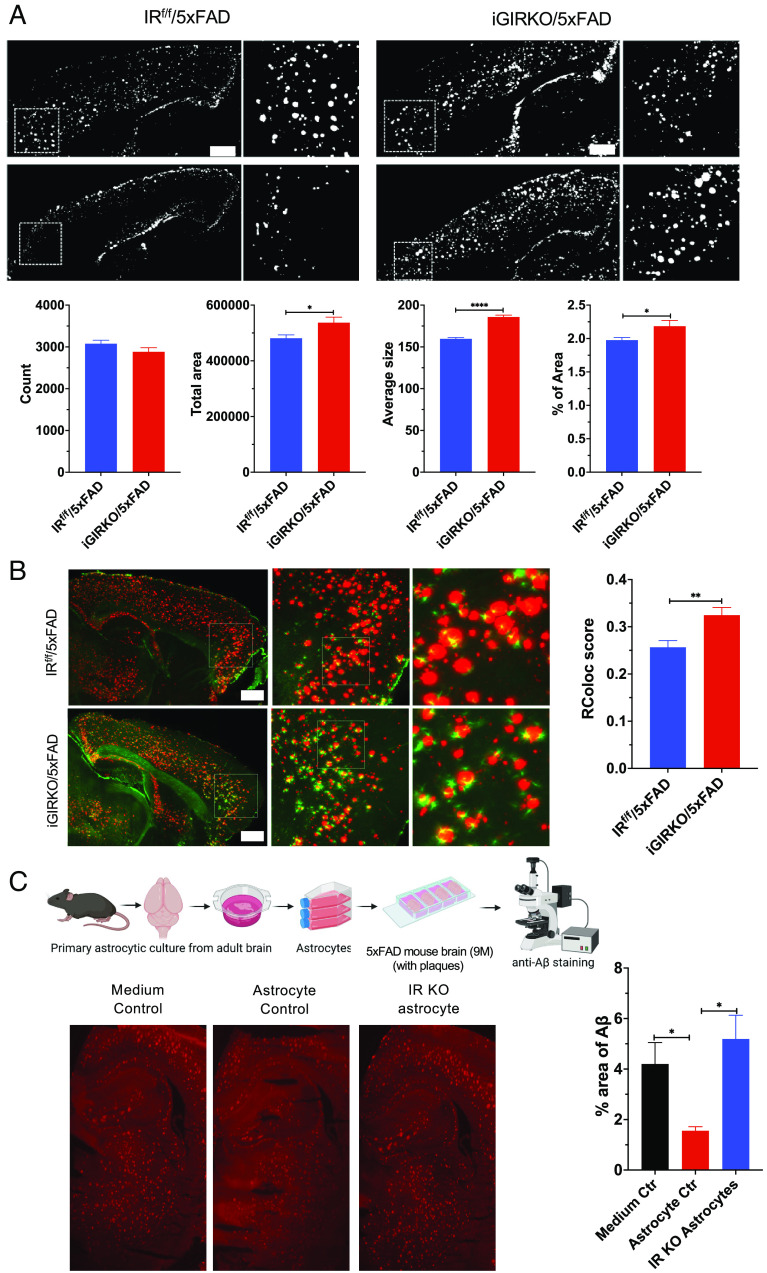
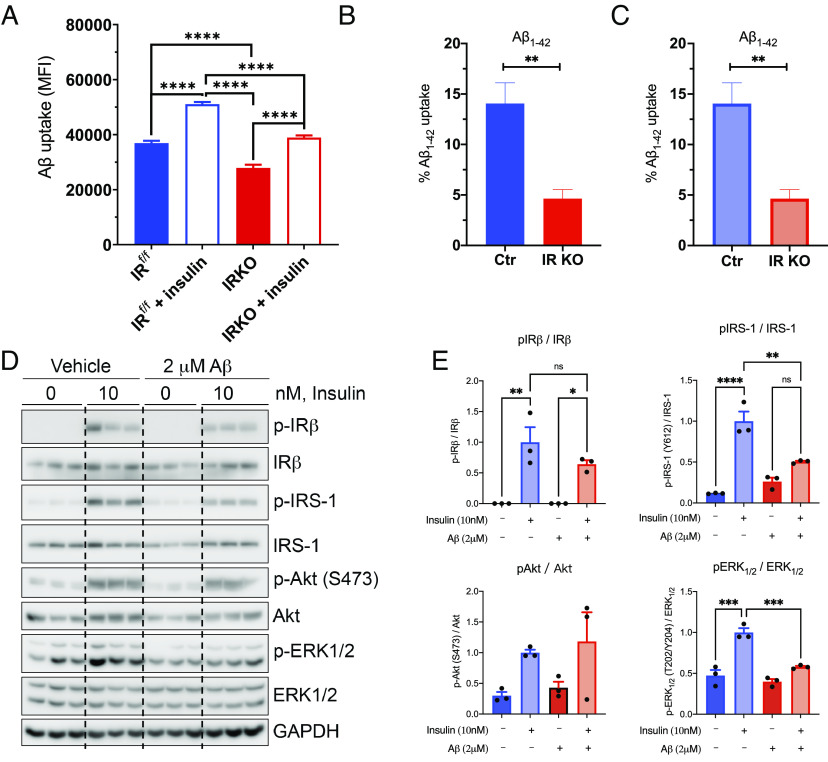
Brain insulin signaling controls peripheral energy metabolism and plays a key role in the regulation of mood and cognition. Epidemiological studies have indicated a strong connection between type 2 diabetes (T2D) and neurodegenerative disorders, especially Alzheimer's disease (AD), linked via dysregulation of insulin signaling, i.e., insulin resistance. While most studies have focused on neurons, here, we aim to understand the role of insulin signaling in astrocytes, a glial cell type highly implicated in AD pathology and AD progression. To this end, we created a mouse model by crossing 5xFAD transgenic mice, a well-recognized AD mouse model that expresses five familial AD mutations, with mice carrying a selective, inducible insulin receptor (IR) knockout in astrocytes (iGIRKO). We show that by age 6 mo, iGIRKO/5xFAD mice exhibited greater alterations in nesting, Y-maze performance, and fear response than those of mice with the 5xFAD transgenes alone. This was associated with increased Tau (T231) phosphorylation, increased Aβ plaque size, and increased association of astrocytes with plaques in the cerebral cortex as assessed using tissue CLARITY of the brain in the iGIRKO/5xFAD mice. Mechanistically, in vitro knockout of IR in primary astrocytes resulted in loss of insulin signaling, reduced ATP production and glycolic capacity, and impaired Aβ uptake both in the basal and insulin-stimulated states. Thus, insulin signaling in astrocytes plays an important role in the control of Aβ uptake, thereby contributing to AD pathology, and highlighting the potential importance of targeting insulin signaling in astrocytes as a site for therapeutics for patients with T2D and AD.

Keywords: Alzheimer’s disease; astrocytes; diabetes; insulin resistance; neurons.


Conflict of interest statement

The lead author, C.R.K., and one reviewer, D.A., are co-authors of a recent publication (DOI: 10.1038/s41467-022-33008-2) in which they each provided different reagents to a third group whose publication this represents. In this co-authored publication, there was no collaboration between C.R.K. and D.A. themselves.

Figures

Fig. 1.
Fig. 1.
Loss of insulin signaling impairs mitochondrial respiration and glycolytic capacity in astrocytes. (A) qPCR analysis showing copy number of the mitochondrial DNA versus genomic DNA (mtND1, mtCytB, mtATP6) in control and IRKO astrocytes. N = 6. (B) Mean fluorescent intensity (MFI) in control and IRKO astrocytes loaded with mitotracker green and quantified by flow cytometry. N = 5. (C) OCR of control and IRKO astrocytes sequentially treated with oligomycin (2 µM), FCCP (2 µM), and rotenone (2.5 µM) was measured using a Seahorse X24 Bioanalyzer. All data were normalized to the protein content of the corresponding wells (N = 9 to 10). (D and E) Mitochondrial ATP production and maximal respiration of control and IRKO astrocytes were calculated from the Seahorse data (25) (N = 9 to 10). (F) ECAR of control and IRKO astrocytes sequentially treated with glucose (10 mM), oligomycin (2 µM), and 2-deoxyglucose (50 µM) was measured using a Seahorse X24 Bioanalyzer. All the data were normalized to the protein content of the corresponding wells (N = 10). (G and H) Glucose-induced glycolysis and maximal glycolic capacity of control and IRKO astrocytes (N = 10), *P < 0.05, **P < 0.01, ***P < 0.001, in an unpaired t test. Data are presented as mean ± SEM.
Fig. 2.
Fig. 2.
Establishment and characterization of 5xFAD mouse strains with inducible IR KO in astrocytes (iGIRKO/5FAD). (A) Schematic of creation of the iGIRKO/5xFAD mouse. (B) Measurement of body weight (g) at 6-mo-old in male mice. N = 23 to 30 mice per condition. (C and D) 4-h fasting glucose (C) and serum insulin levels (D) in 6-mo-old male mice. N = 20 to 21 mice per condition in C and N = 13 to 21 per condition in D. (E) qPCR analysis of astrocyte marker genes Gfap and Apoe in the cortex of 8-mo-old male mice. N = 5 to 14 mice per condition. (F) Quantification of insulin receptor β-subunit (IRβ) in protein extracted from the cortex of 8-mo-old male mice. N = 4 to 6 per condition. Related to SI Appendix, Fig. S2 C and D. (G) Analysis of scores in nest building test in 6-mo-old male mice (N = 12 to 17 mice per condition). (H) Percent of time with freezing behavior in contextual fear conditioning test in 6-mo-old male mice (N = 19 to 20 mice per condition). *P < 0.05, **P < 0.01, ***P < 0.001, by two-way ANOVA analysis followed by Tukey’s multiple comparisons test. Data are presented as mean ± SEM. Schematic was created with BioRender.
Fig. 3.
Fig. 3.
Loss of insulin signaling in astrocytes enhances Tau phosphorylation, mitophagy, and autophagy. (A) qPCR analysis of synaptic marker genes (Dlg4, Syp, Stx1a) in 8-mo-old male mouse cortex. N = 5 to 14 per condition. (B) Representative western blots and quantification of phosphorylated Tau proteins in protein extracted from the cortex of 6-mo-old male mice. N = 4 to 6 per condition. (C) Representative western blots and quantification of Beclin-1 in proteins extracted from the cortex of 6-mo-old male mice. N = 4 to 9 per condition. (D) Representative western blots and quantification of mitophagy pathway-related proteins LC3-I and LC3-II and ratio of LC3-II to LC3-I in protein extracted from the cortex of 6-mo-old male mice. N = 4 to 9 per condition. (E) Representative western blots and quantification of autophagy marker proteins BNIP3 in protein extracted from the cortex of 6-mo-old male mice. N = 4 to 5 per condition. *P < 0.05, **P < 0.01, ***P < 0.001, ****P < 0.0001 by two-way ANOVA analysis followed by Tukey’s multiple comparisons test. Quantitative data are presented as mean ± SEM.
Fig. 4.
Fig. 4.
Loss of astrocyte insulin signaling in mice leads to accumulation of Aβ plaque in the cortex. (A) Representative images and quantification of Aβ plaque in the cerebral cortex of male 5xFAD and iGIRKO/5xFAD mice. N = 160 images from four mice were analyzed. (Scale bar: 1 mm.) (B) Representative images of astrocyte processes surround Aβ plaque in the cerebral cortex and quantification of this colocalization. N = 8 to 23 ROI images from two mice were analyzed per condition. (Scale bar: 1 mm.) (C) Schematic (up) showing the workflow of in situ Aβ uptake analysis in brain slice preparation. Representative images (down) and quantification of percent area of Aβ plaque on brain slices treated with control medium, isolated WT astrocytes, or isolated IR KO astrocytes. *P < 0.05, **P < 0.01, ****P < 0.0001, by unpaired t test. Quantitative data are presented as mean ± SEM. Schematic was created with BioRender.
Fig. 5.
Fig. 5.
Effect of Aβ on insulin signaling and insulin signaling on uptake of Aβ peptides by astrocytes. (A) MFI analysis of Aβ1-42 HiLyte Fluor 647 labeled uptake by sorted neonatal astrocytes (IRf/f) following a 1-h incubation. N = 5 to 6 per condition. (B and C) FACS analysis of Aβ1-42 HiLyte Fluor 647 labeled peptide (B) and Aβ1-40 HiLyte Fluor 647 labeled uptake by isolated adult astrocytes following a 2-h incubation (C). (D) Representative western blots showing the effects of Aβ1-42 (2 µM) on insulin (10 nM)-stimulated signaling pathway. (E) Quantification of insulin signaling molecules and their phosphorylation. N = 3 per condition. *P < 0.05, **P < 0.01, ***P < 0.001 by unpaired t test. Data are presented as mean ± SEM.

References

    1. Sun H., et al. , IDF diabetes atlas: Global, regional and country-level diabetes prevalence estimates for 2021 and projections for 2045. Diabetes Res. Clin. Pract. 183, 109119 (2022). - PMC - PubMed
    1. Barbagallo M., Dominguez L. J., Type 2 diabetes mellitus and Alzheimer’s disease. World J. Diabetes 5, 889–893 (2014). - PMC - PubMed
    1. Kahn C. R., Suzuki R., “Insulin action in the brain and the pathogenesis of alzheimer’s disease” in Diabetes, Insulin and Alzheimer’s Disease, Craft S., Christen Y., Eds. (Springer, Berlin Heidelberg, Berlin, Heidelberg, 2010), pp. 1–20, 10.1007/978-3-642-04300-0_1. - DOI
    1. Kleinridders A., Ferris H. A., Cai W., Kahn C. R., Insulin action in brain regulates systemic metabolism and brain function. Diabetes 63, 2232–2243 (2014). - PMC - PubMed
    1. Chen W., Cai W., Hoover B., Kahn C. R., Insulin action in the brain: Cell types, circuits, and diseases. Trends Neurosci. 45, 384–400 (2022). - PMC - PubMed

Publication types

LinkOut - more resources