. 2023 May 23;120(21):e2209639120.
doi: 10.1073/pnas.2209639120. Epub 2023 May 15.

SMARCB1 regulates the hypoxic stress response in sickle cell trait

Affiliations

SMARCB1 regulates the hypoxic stress response in sickle cell trait

Melinda Soeung et al. Proc Natl Acad Sci U S A. .

Abstract

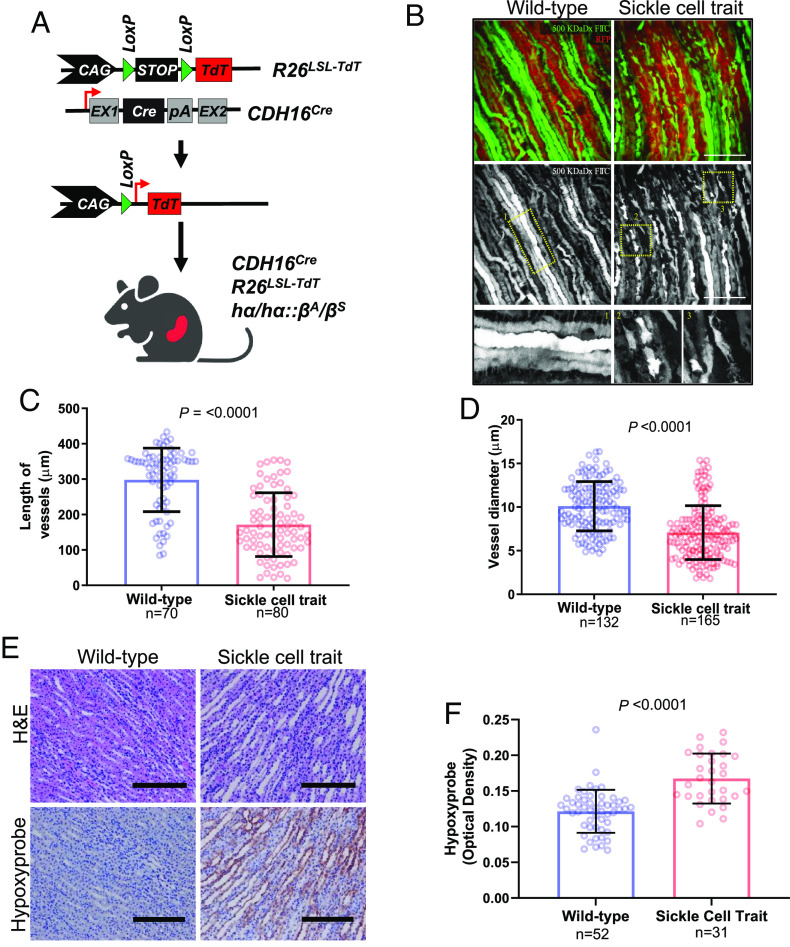
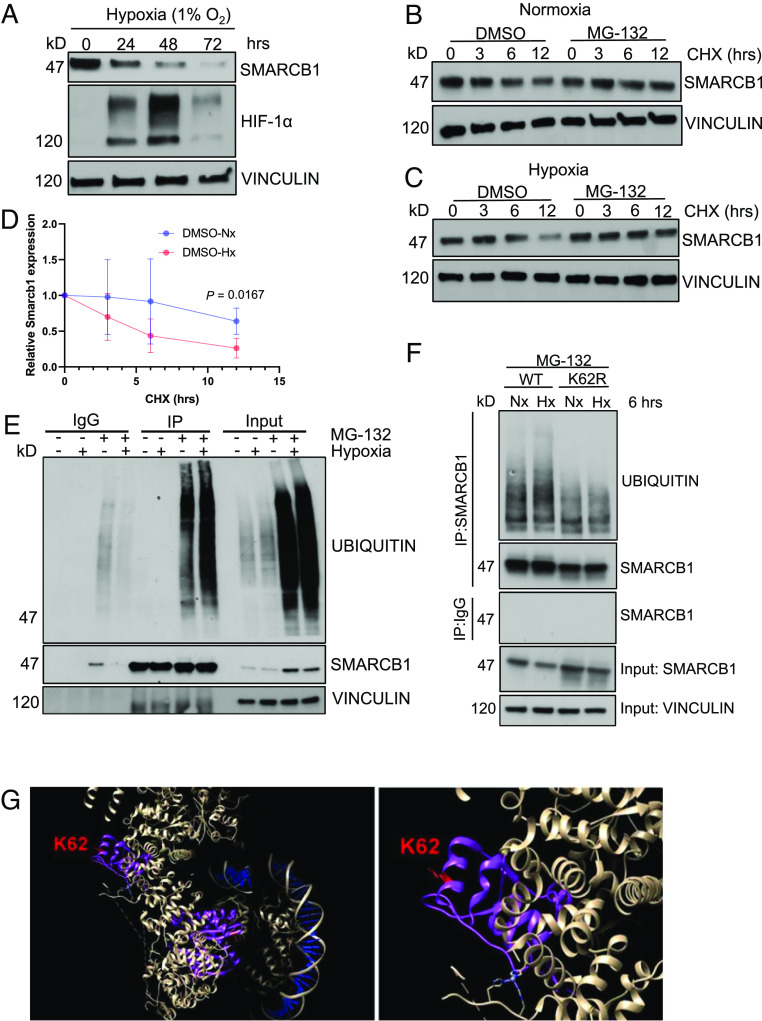
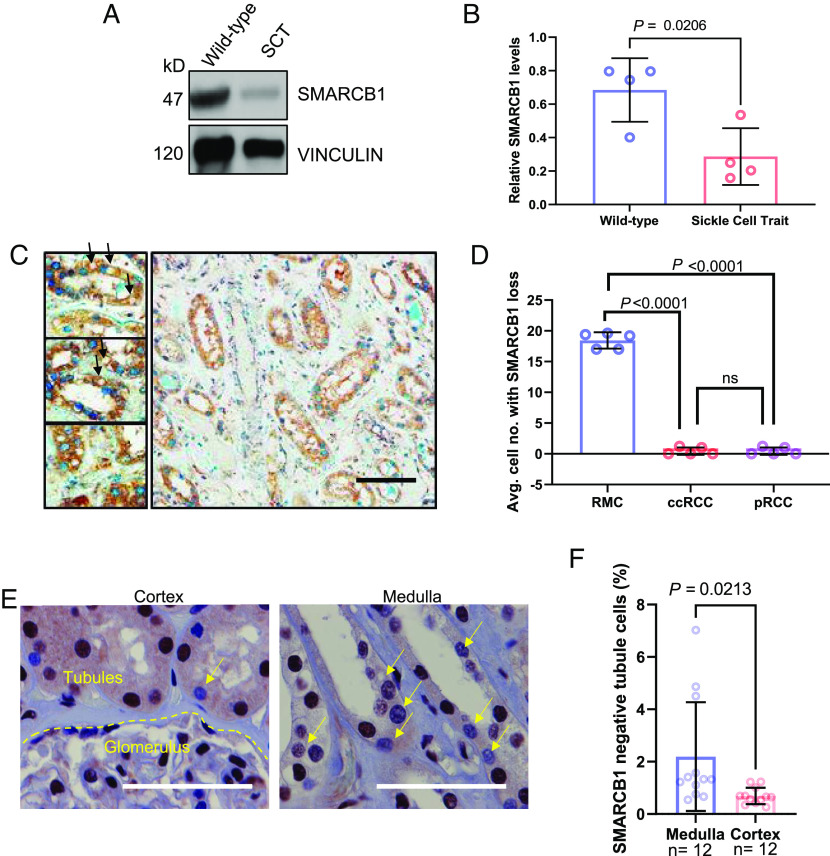
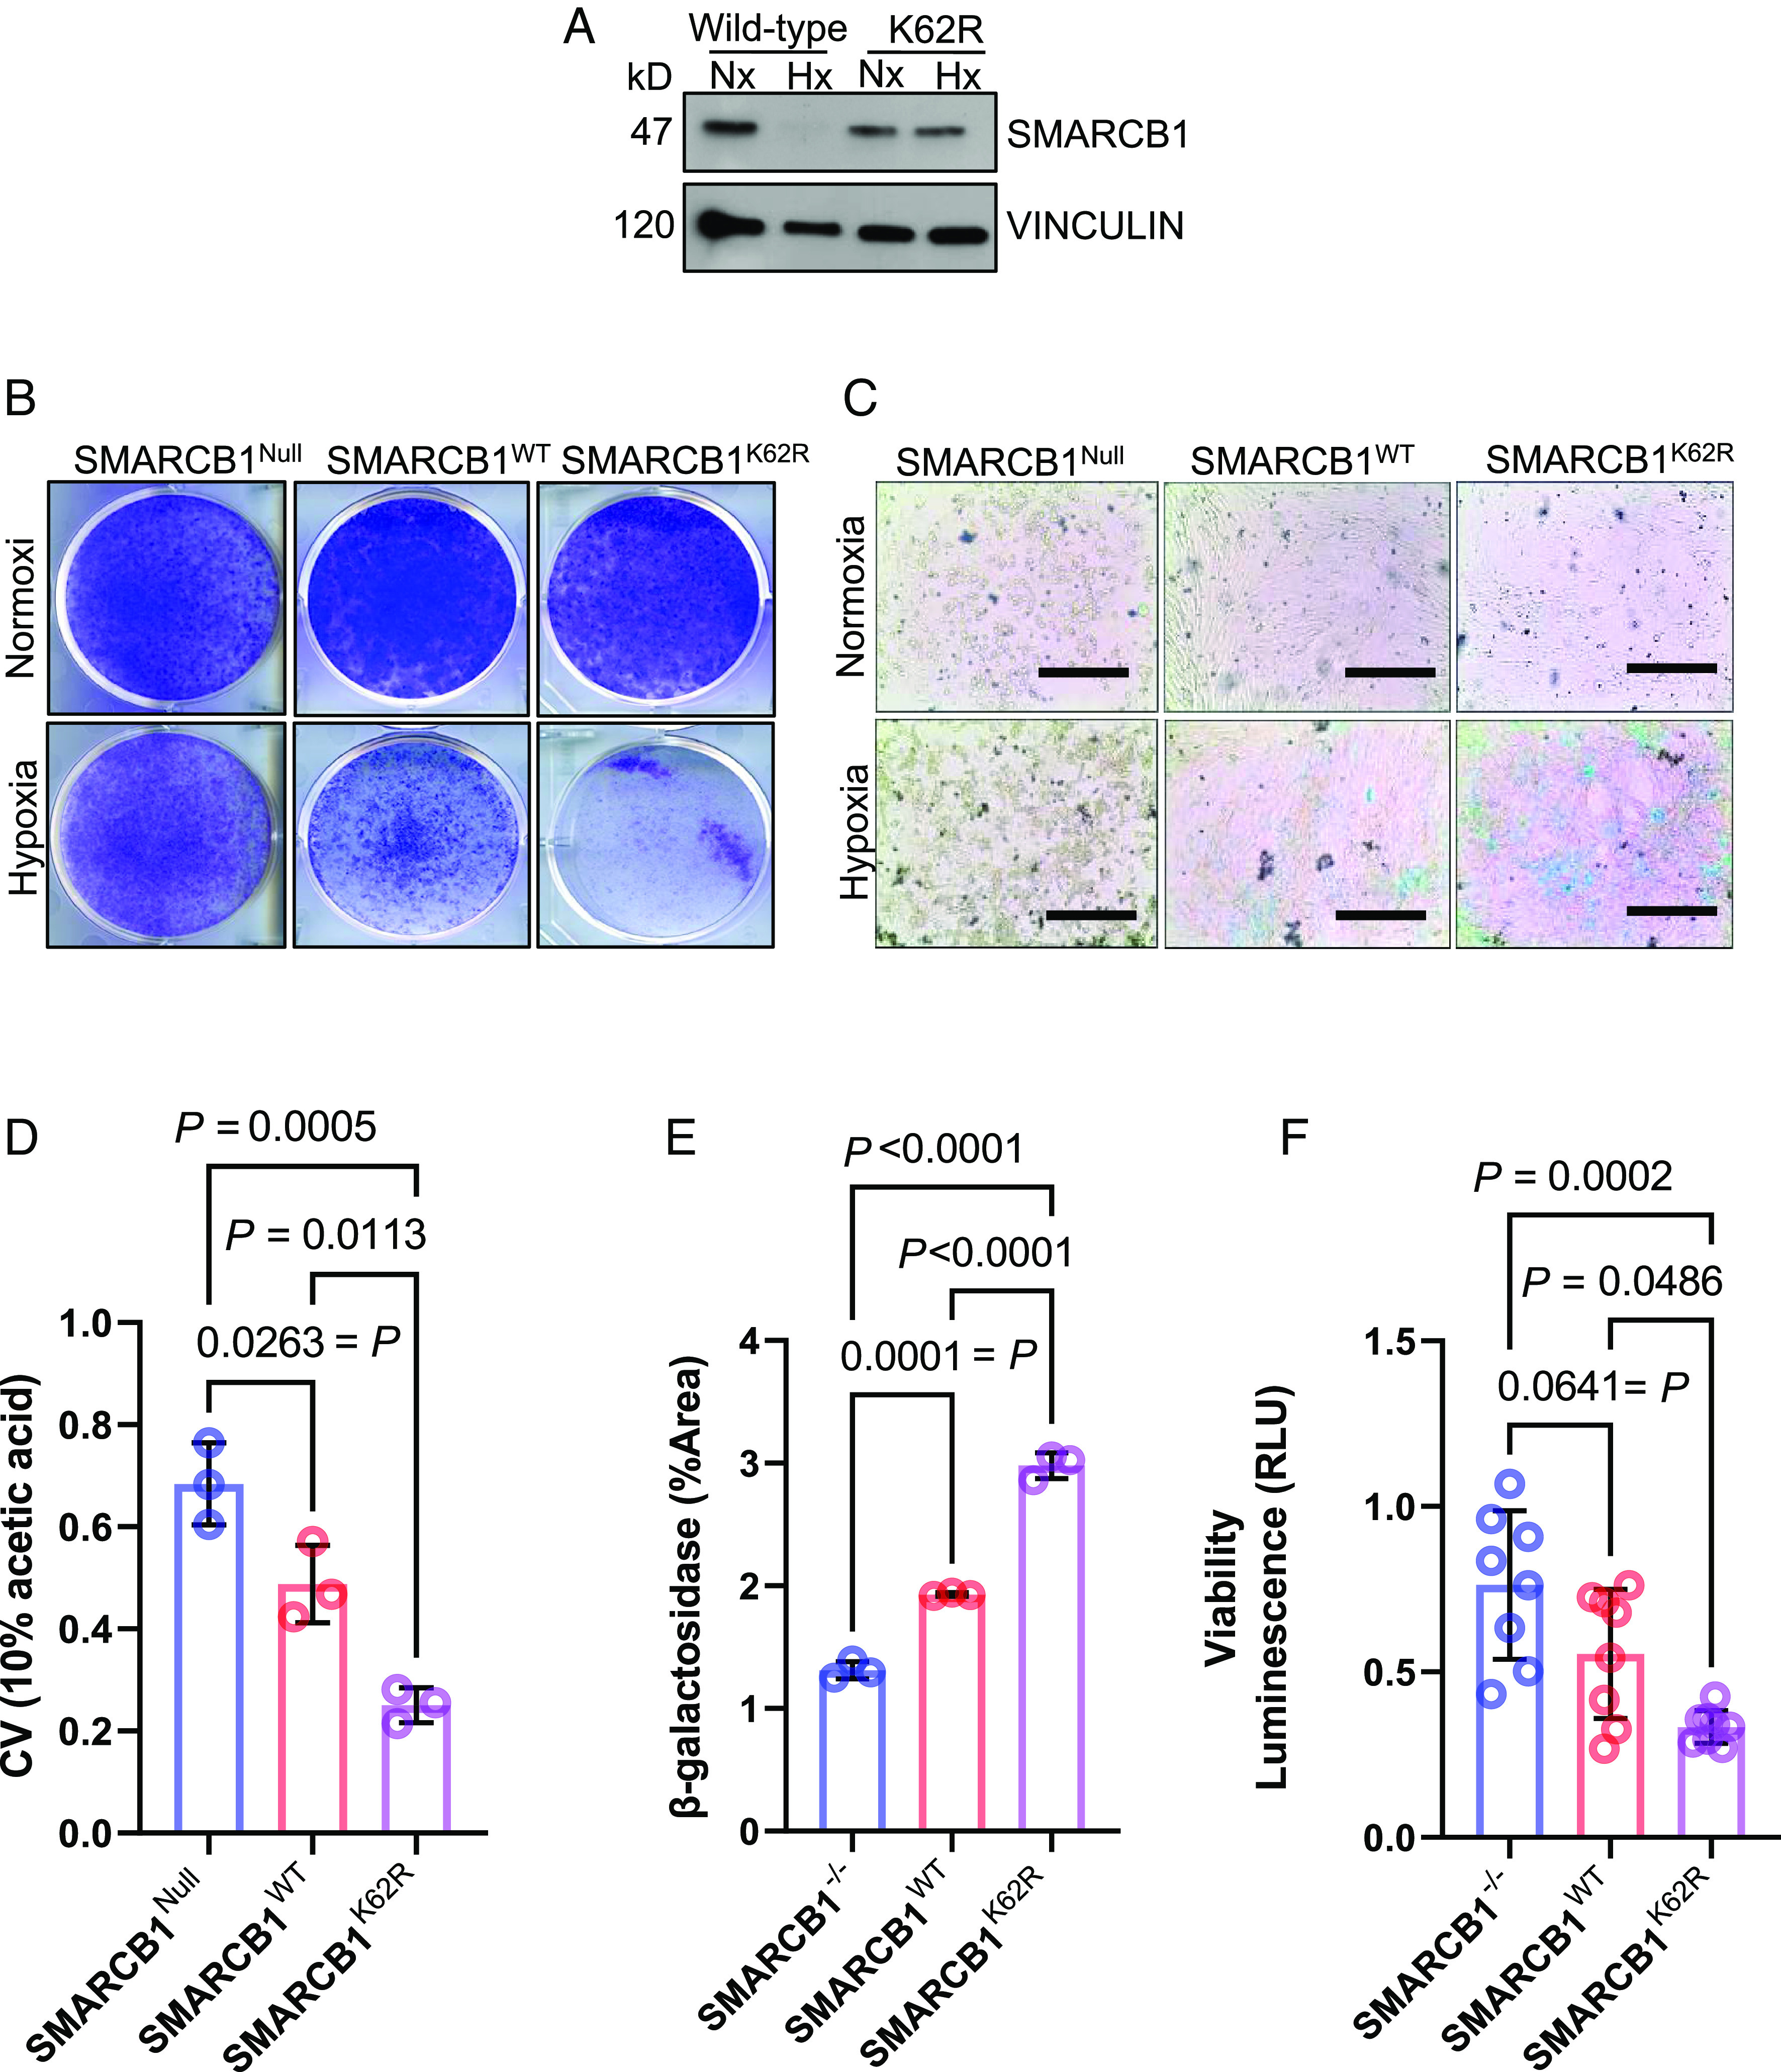
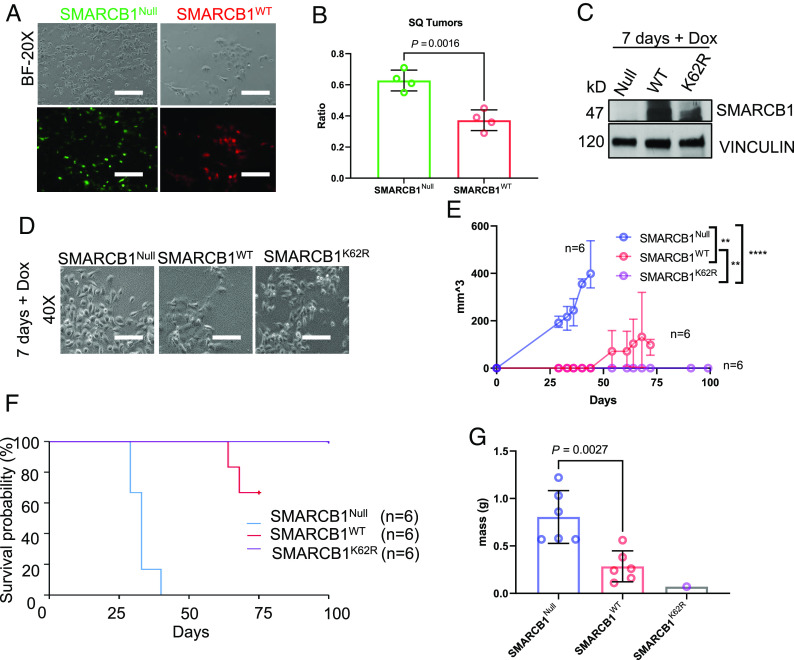
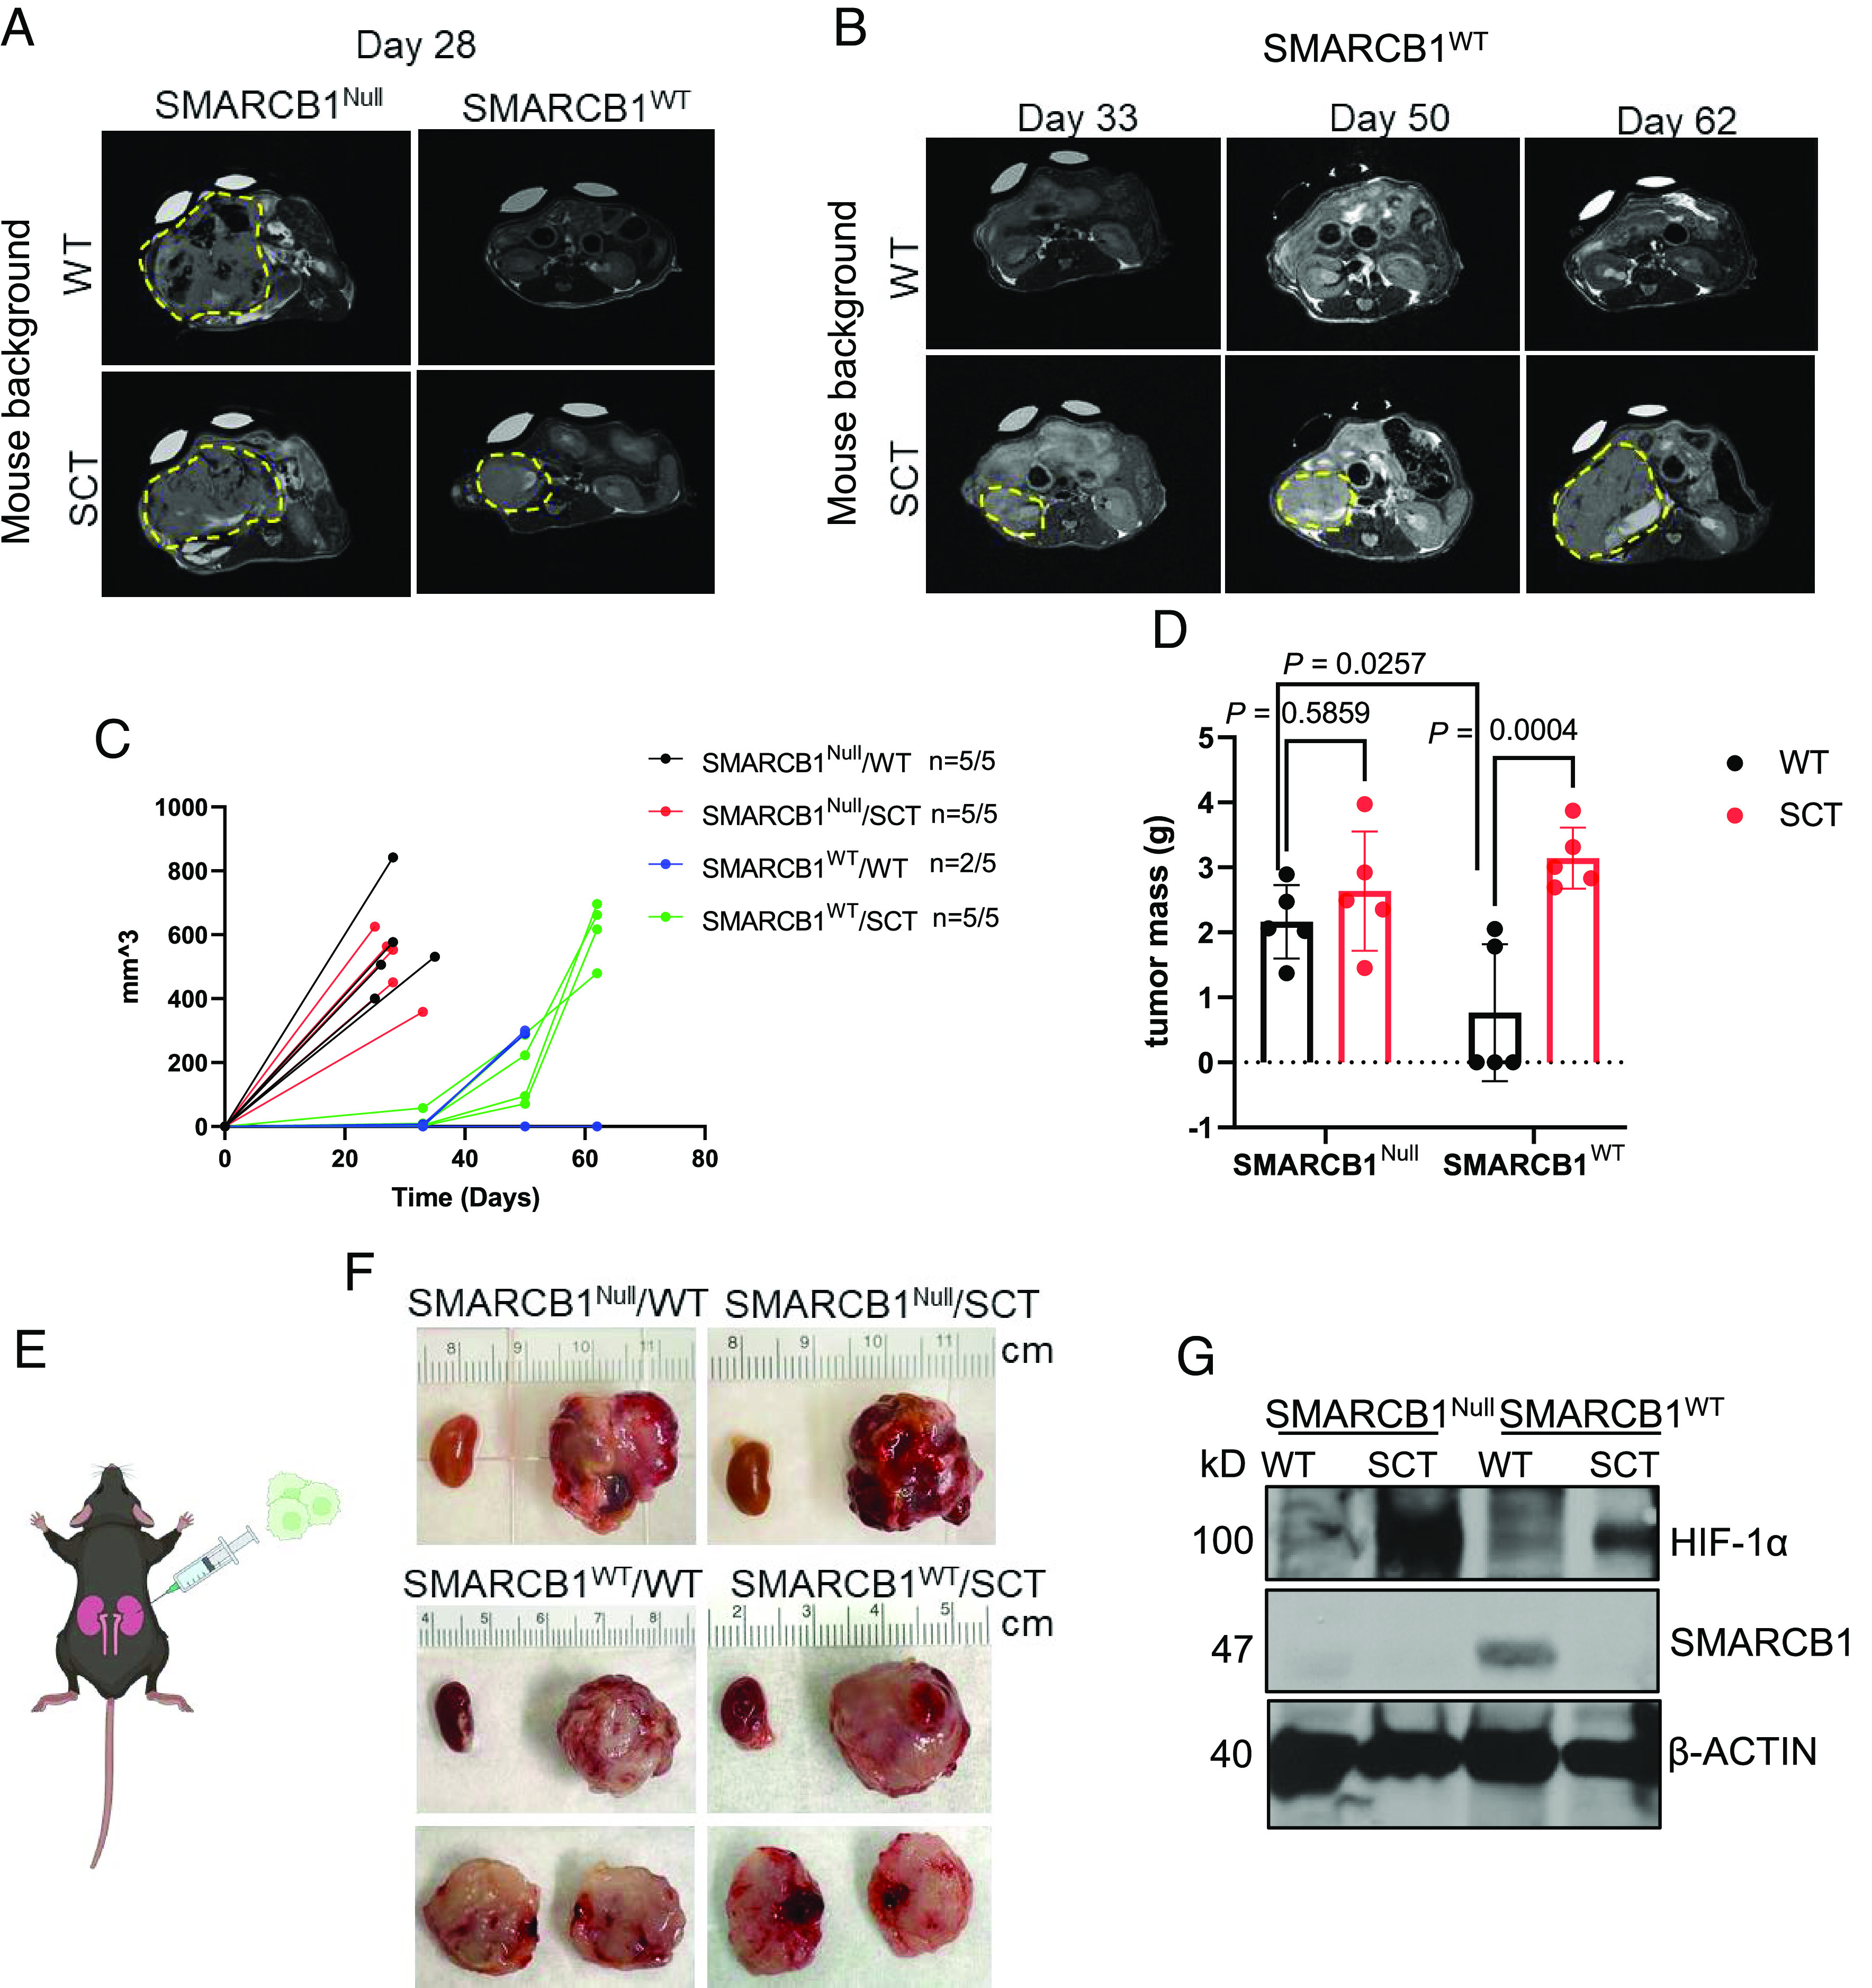
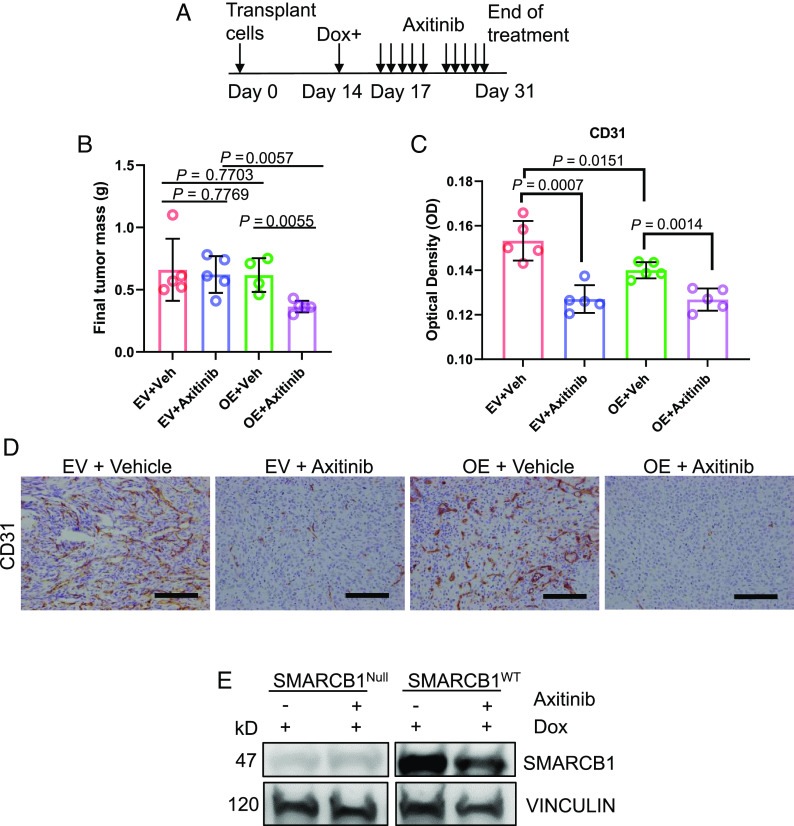
Renal medullary carcinoma (RMC) is an aggressive kidney cancer that almost exclusively develops in individuals with sickle cell trait (SCT) and is always characterized by loss of the tumor suppressor SMARCB1. Because renal ischemia induced by red blood cell sickling exacerbates chronic renal medullary hypoxia in vivo, we investigated whether the loss of SMARCB1 confers a survival advantage under the setting of SCT. Hypoxic stress, which naturally occurs within the renal medulla, is elevated under the setting of SCT. Our findings showed that hypoxia-induced SMARCB1 degradation protected renal cells from hypoxic stress. SMARCB1 wild-type renal tumors exhibited lower levels of SMARCB1 and more aggressive growth in mice harboring the SCT mutation in human hemoglobin A (HbA) than in control mice harboring wild-type human HbA. Consistent with established clinical observations, SMARCB1-null renal tumors were refractory to hypoxia-inducing therapeutic inhibition of angiogenesis. Further, reconstitution of SMARCB1 restored renal tumor sensitivity to hypoxic stress in vitro and in vivo. Together, our results demonstrate a physiological role for SMARCB1 degradation in response to hypoxic stress, connect the renal medullary hypoxia induced by SCT with an increased risk of SMARCB1-negative RMC, and shed light into the mechanisms mediating the resistance of SMARCB1-null renal tumors against angiogenesis inhibition therapies.

Keywords: SMARCB1; hypoxia; renal medullary carcinoma; sickle cell trait.


Conflict of interest statement

Pavlos Msaouel has received honoraria for service on a Scientific Advisory Board for Mirati Therapeutics, Bristol Myers Squibb, and Exelixis; consulting for Axiom Healthcare Strategies; non-branded educational programs supported by Exelixis and Pfizer; and research funding for clinical trials from Takeda, Bristol Myers Squibb, Mirati Therapeutics, Gateway for Cancer Research, and UT MD Anderson Cancer Center.

Figures

Fig. 1.
Fig. 1.
Renal ischemia is associated with chronic hypoxia in sickle cell trait mouse model. (A) Schematic of genetically engineered mouse model (GEMM) of SCT. (B) 3D image reconstruction of renal epithelia (RFP) and FITC-dextran (GFP) in adult mice (n = 4 to 5) with kidney-specific CDH16Cre and conditional R26LSL-Tom (and D) Quantification of the diameter (C) and length (D) of the renal blood vessels (10 vessels/image, 3 locations/vessel). (E) IHC of mouse kidneys after injection with Hypoxyprobe. (F) Quantification of the optical density of horseradish peroxidase (HRP) staining for 20× images was done using ImageJ. Data are expressed as mean value ±SD, with the P value calculated by Student’s t test.
Fig. 2.
Fig. 2.
SMARCB1 is degraded via ubiquitin-proteasome-mediated degradation. (A) Immunoblotting analysis of mIMCD-3 cells after increasing time exposure to hypoxia (1% oxygen). (B) Cycloheximide chase assay of mIMCD-3 cells in 24 h of normoxia and (C) 24 h of hypoxia. Cells were treated with 20 μM cycloheximide for 0, 3, 6, and 12 h. (D) Quantification of SMARCB1 protein expression in mIMCD-3 after cycloheximide (CHX) chase experiment in 24 h of growth in normoxia and hypoxia. (E) Immunoprecipitation (IP) analysis of SMARCB1 ubiquitination after 6 h of hypoxia treatment. (F) MSRT1 cells ectopically overexpressing SMARCB1WT and SMARCB1K62R were cultured in 6 h of normoxia (21% oxygen) and hypoxia (1% oxygen) coupled with 3 h of treatment with 50 μM MG-132 to prevent proteasome degradation for subsequent immunoprecipitation assay. Protein analysis was then used to detect ubiquitin levels on SMARCB1. Data are expressed as mean value ±SD, with the P value calculated by Student’s t test. (G) Crystal structure of SMARCB1 (purple) in the SWI/SNF complex (white) bound to DNA (blue) using cryoelectron microscopy. Lysine residue 62 is indicated in red. The crystal structure was obtained from He et al. and UCSF Chimera software (https://www.cgl.ucsf.edu/chimera/download.html) was used to visualize crystal structure.
Fig. 3.
Fig. 3.
SMARCB1 protein expression is significantly lower in the renal medullary tubule cells of RMC patient nephrectomy samples and mouse models with sickle cell trait. (A) Representative image of immunoblotting analysis of kidney lysates from wild-type mice and mice with SCT. (B) Quantification of immunoblotting analysis of SMARCB1 protein in mouse kidney lysates. (C) RMC adjacent kidneys with SMARCB1 loss characterized using IHC analysis. SMARCB1 is indicated in blue (Alkaline phosphatase) staining and eIF2-alpha is indicated in HRP 3,3′-Diaminobenzidine (DAB) staining. The arrows indicate SMARCB1 loss. (D) Quantification of SMARCB1 protein in IHC experiment comparing normal adjacent kidney tissue in different renal tumors. Five 40X images were taken per patient and quantified. The average of five images is shown per patient and represented as a single dot in the plot. (E) IHC analysis of SMARCB1 protein expression in normal adjacent renal tissue from nephrectomy samples of two patients with RMC. Yellow arrows indicate SMARCB1-deficient tubule cells. (F) Quantification of SMARCB1-deficient tubule cells. The number of SMARCB1-deficient tubule cells was expressed as a percentage of total tubule cells in the 40X images. Data are expressed as mean value ±SD, with the P value calculated by Student’s t test.
Fig. 4.
Fig. 4.
SMARCB1-deficient tumors are resistant to hypoxic stress, while SMARCB1-proficient tumors are sensitive to hypoxic stress. (A) Western blotting analysis of MSRT1 cells overexpressed with either SMARCB1WT or SMARCB1K62R. (B) Clonogenic assay of MSRT1 tumors overexpressed with either SMARCB1Null, SMARCB1WT, and SMARCB1K62R grown in either normoxia or hypoxia. (C) Representative images of β-galactosidase staining of MSRT1 cells overexpressed with SMARCB1Null, SMARCB1WT, and SMARCB1K62R. (D) Quantification of clonogenic assay. Crystal violet was dissolved from cells using 10% acetic acid. (E) Quantification of β-galactosidase using FIJI ImageJ software. (F) Luminescent (RLU) activity indicating cell viability in MSRT1 with SMARCB1Null, SMARCB1WT, and SMARCB1K62R after prolonged exposure to normoxia and hypoxia. For all quantification experiments shown in DF, the cell viability of cells in hypoxic condition was normalized to its corresponding normoxic condition. Data are expressed as mean value ±SD, with the P value calculated by Student’s t test.
Fig. 5.
Fig. 5.
SMARCB1-deficient tumor cells are more resistant to hypoxia and expand under hypoxic conditions. Preventing the degradation of SMARCB1 significantly impairs tumor expansion. (A) Microscopic images of SMARCB1Null mouse renal tumors (GFP) and SMARCB1WT cells (GFP/RFP) prior to subcutaneous injection into NSG mice. (B) Flow cytometry evaluation of SMARCB1Null and SMARCB1WT tumor cells that were mixed in a 1:1 ratio and injected subcutaneously into NSG mice. (C) Immunoblotting analysis of SMARCB1 protein expression in RMC219-tet-empty vector (SMARCB1Null) and RMC219-tet-inducible SMARCB1WT and RMC219-tet-inducible SMARCB1K62R after 7 d of treatment with 2 μg of Doxycycline (DOX). (D) Corresponding microscopic images of RMC219-tet-inducible cells showing that cells are healthy prior to subcutaneous injection in NSG mice. (E) Growth curve of subcutaneous tumors in NSG mice. (F) Kaplan–Meier survival curve of RMC219 subcutaneous tumors. For time-to-event event-free survival analysis, 200 mm3 was set as the endpoint. (G) Final tumor mass of RMC219 subcutaneous tumors. Data are expressed as mean value ±SD, with the P value calculated by Student’s t test.
Fig. 6.
Fig. 6.
Sickle cell trait promotes tumor growth and aggressiveness in SMARCB1-deficient tumors. (A and B) Representative coronal T2-weighted MRI sections of tumor-bearing mice after orthotopic injection of MSRT1-SMARCB1Null and MSRT1-SMARCB1WT tumor cells into right kidney of wild-type mice (n = 5) and mice with sickle cell trait (n = 5). (C) Growth curve of primary kidney tumors. Tumor volume was quantified using coronal T2-weighted MRI sections at various timepoints after initial orthotopic injection of cells. ImageJ was used to calculate the tumor volume from T2-weighted MRI sections. (D) Final tumor mass of primary kidney tumors. (E) Schematic of orthotopic right kidney injections of MSRT1 tumor cell line. (F) Gross images of right primary kidney tumor compared to normal left kidney. Ruler increments are in cm. (G) Immunoblotting analysis of SMARCB1 and HIF-1α protein expression in orthotopic kidney tumors. β-ACTIN was used as the internal control for the immunoblotting analysis. Data are expressed as mean value ±SD, with the P value calculated by Student’s t test.
Fig. 7.
Fig. 7.
SMARCB1Null renal tumors are insensitive to angiogenesis inhibition. (A) Axitinib treatment schedule. (B) Final tumor mass of RMC219-tet-inducible cell lines that were injected subcutaneously (SQ) into NSG mice. Each dot represents one mouse. (C) and corresponding quantification of the optical density of CD31 IHC analysis. (D) Representative IHC image of CD31 staining of subcutaneous tumors treated with axitinib. Data are expressed as mean value ±SD, with the P value calculated by Student’s t test. (E) Representative immunoblotting analysis of final tumors after axitinib treatment. Data are expressed as mean value ±SD, with the P value calculated by Student’s t test.

References

    1. Msaouel P., et al. , Updated recommendations on the diagnosis, management, and clinical trial eligibility criteria for patients with renal medullary carcinoma. Clin. Genitourin. Cancer 17, 1–6 (2019). - PMC - PubMed
    1. Msaouel P., Tannir N. M., Walker C. L., A model linking sickle cell hemoglobinopathies and SMARCB1 loss in renal medullary carcinoma. Clin. Cancer Res. 24, 2044–2049 (2018). - PubMed
    1. Msaouel P., et al. , Comprehensive molecular characterization identifies distinct genomic and immune hallmarks of renal medullary carcinoma. Cancer Cell 37, 720–734.e713 (2020). - PMC - PubMed
    1. Msaouel P., et al. , Comprehensive molecular characterization identifies distinct genomic and immune hallmarks of renal medullary carcinoma. Cancer Cell 37, 720–734. e13 (2020). - PMC - PubMed
    1. Zoumpourlis P., Genovese G., Tannir N. M., Msaouel P., Systemic therapies for the management of non-clear cell renal cell carcinoma: What works, what doesn’t, and what the future holds. Clin. Genitourin. Cancer 19, 103–116 (2021). - PMC - PubMed

Publication types

Substances