Observational Study
. 2023 Jun:92:104613.
doi: 10.1016/j.ebiom.2023.104613. Epub 2023 May 13.

Development of early life gut resistome and mobilome across gestational ages and microbiota-modifying treatments

Affiliations
Observational Study

Development of early life gut resistome and mobilome across gestational ages and microbiota-modifying treatments

Ahmed Bargheet et al. EBioMedicine. 2023 Jun.

Abstract

Background: Gestational age (GA) and associated level of gastrointestinal tract maturation are major factors driving the initial gut microbiota composition in preterm infants. Besides, compared to term infants, premature infants often receive antibiotics to treat infections and probiotics to restore optimal gut microbiota. How GA, antibiotics, and probiotics modulate the microbiota's core characteristics, gut resistome and mobilome, remains nascent.

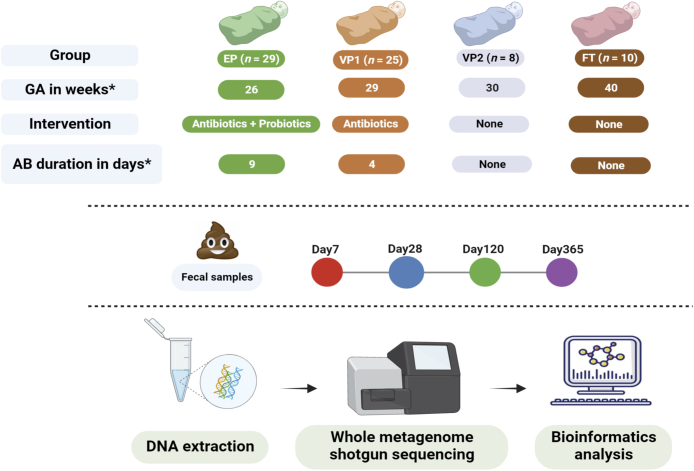
Methods: We analysed metagenomic data from a longitudinal observational study in six Norwegian neonatal intensive care units to describe the bacterial microbiota of infants of varying GA and receiving different treatments. The cohort consisted of probiotic-supplemented and antibiotic-exposed extremely preterm infants (n = 29), antibiotic-exposed very preterm (n = 25), antibiotic-unexposed very preterm (n = 8), and antibiotic-unexposed full-term (n = 10) infants. The stool samples were collected on days of life 7, 28, 120, and 365, and DNA extraction was followed by shotgun metagenome sequencing and bioinformatical analysis.

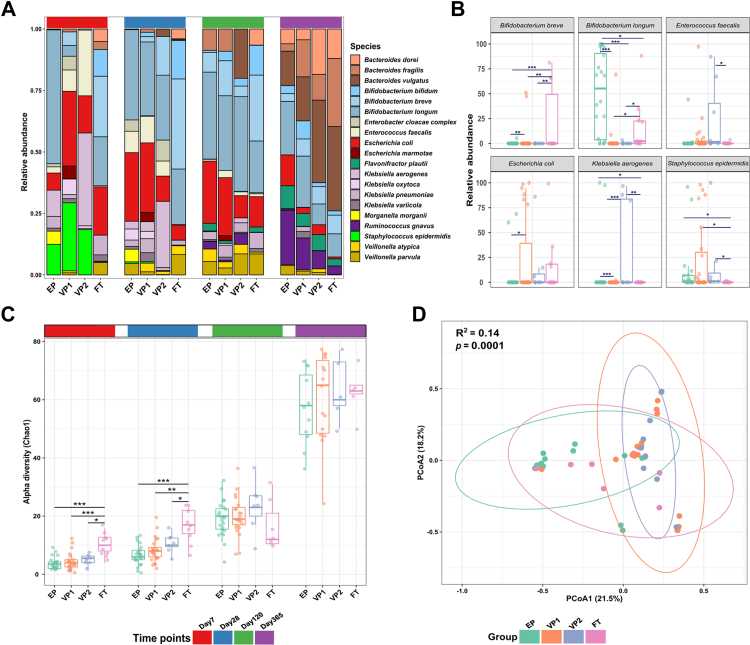
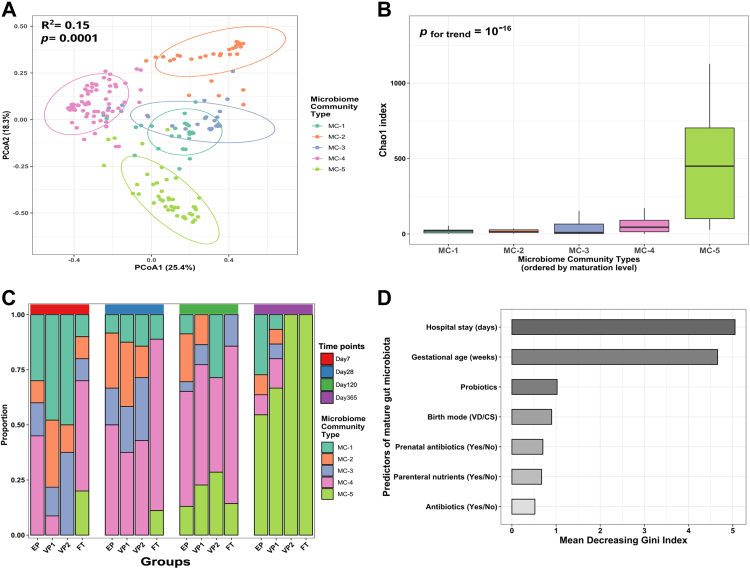
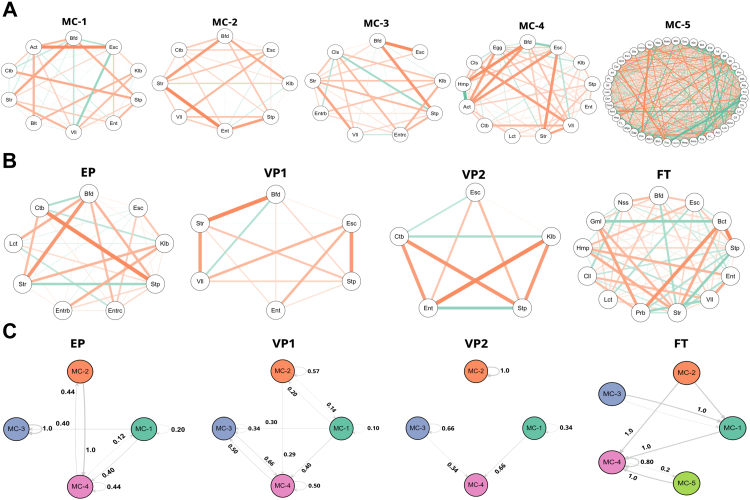
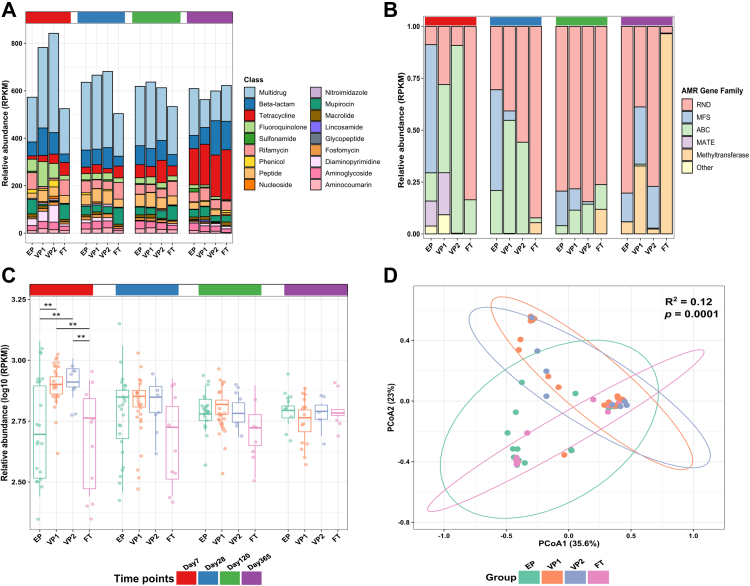
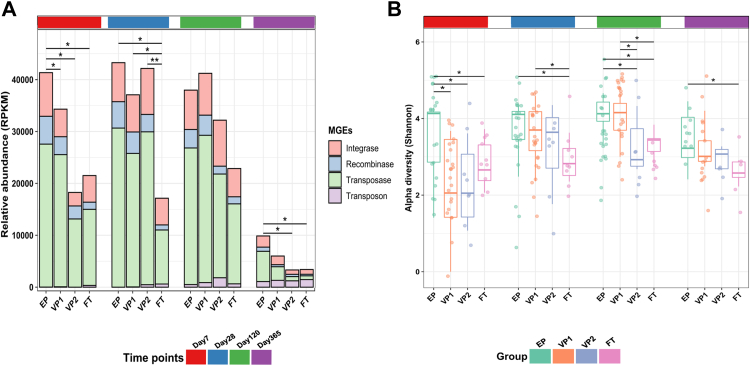
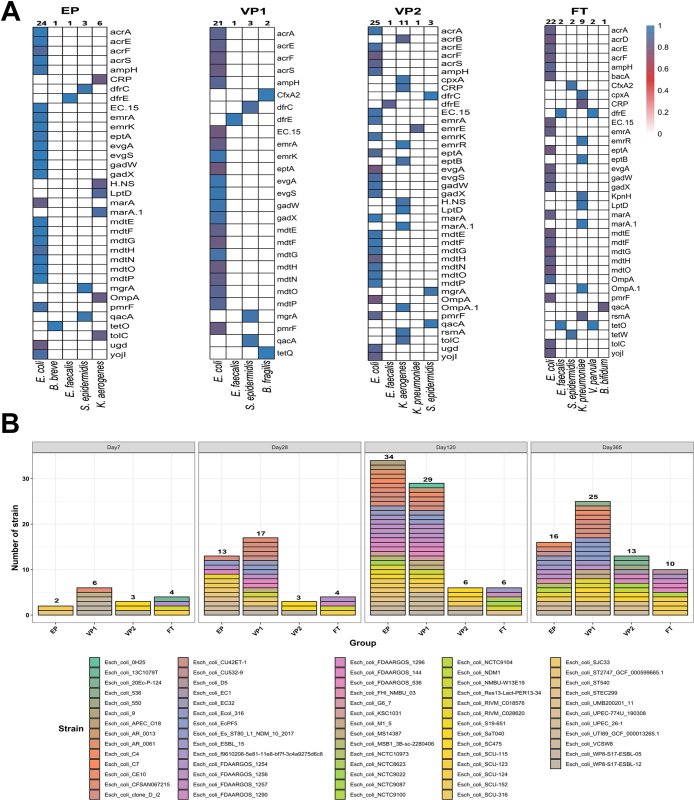
Findings: The top predictors of microbiota maturation were hospitalisation length and GA. Probiotic administration rendered the gut microbiota and resistome of extremely preterm infants more alike to term infants on day 7 and ameliorated GA-driven loss of microbiota interconnectivity and stability. GA, hospitalisation, and both microbiota-modifying treatments (antibiotics and probiotics) contributed to an elevated carriage of mobile genetic elements in preterm infants compared to term controls. Finally, Escherichia coli was associated with the highest number of antibiotic-resistance genes, followed by Klebsiella pneumoniae and Klebsiella aerogenes.

Interpretation: Prolonged hospitalisation, antibiotics, and probiotic intervention contribute to dynamic alterations in resistome and mobilome, gut microbiota characteristics relevant to infection risk.

Funding: Odd-Berg Group, Northern Norway Regional Health Authority.

Keywords: Extremely preterm infants; Gestational age; Gut microbiota; Mobilome; Probiotics; Resistome.


Conflict of interest statement

Declaration of interests The authors have declared that no competing interest exists.

Figures

Fig. 1
Fig. 1
Study design and sample processing workflow. Stool samples from extremely preterm (EP), very preterm (VP), and full-term (FT) infants were collected at four indicated time points and followed by DNA extraction, Illumina sequencing, and bioinformatics analyses. The four studied groups differed in gestational age, probiotic supplementation, antibiotic use, and its duration. ∗Median. GA = Gestational age; AB = Antibiotic.
Fig. 2
Fig. 2
Bacterial microbiota of infants with varying gestational age and receiving different microbiota-modifying treatments. (A) The relative abundance of 20 most abundant bacterial species in extremely preterm (EP = antibiotic-exposed and probiotic supplemented), very preterm (VP1 = antibiotic-exposed, VP2 = antibiotic naive), and full-term infants (FT = antibiotic naive), as inferred by MetaPhlAn3. (B) Despite large interindividual variability, the relative abundances of several bacterial species showed significant differences across groups on day 7, as estimated by DESeq2. The p values were computed using the Wald test. Adjusted p values (adj. p): ∗∗∗adj. p < 0.001; ∗∗adj. p < 0.01; ∗adj. p < 0.05. (C) Chao1 diversity comparison between the groups. Each point represents a sample. The horizontal box lines represent the first quartile, the median, and the third quartile. The p values were computed using the One-way ANOVA and adjusted using Tukey’s HSD post hoc test. Adjusted p values (adj. p): ∗∗∗adj. p < 0.001; ∗∗adj. p < 0.01; ∗adj. p < 0.05. (D) Principal coordinate analysis (PCoA) based on the Bray–Curtis dissimilarity matrix and PERMANOVA test showed a significant shift in the microbiota composition on day 7. Except for VP1 vs VP2 (p = 0.09), the microbiota composition in each group was significantly dissimilar. Each point represents the bacterial microbiota of an individual sample. Ellipses represent a 95-confidence interval.
Fig. 3
Fig. 3
The gut microbiota maturation of infants with varying gestational ages and receiving different microbiota-modifying treatments. (A) Five gut microbial community (MC) types were identified using the Dirichlet Multinomial Mixture modelling applied to all study samples. The Bray–Curtis dissimilarity matrix and PERMANOVA were used to investigate and test the association of MC types with beta diversity. Each point represents a sample, and the ellipses represent a 95-confidence interval. (B) Comparison of the MC types richness (Chao1). The horizontal box lines represent the first quartile, the median, and the third quartile (C). The distribution of MC types across the infant groups (extremely preterm EP - antibiotic-exposed and probiotic supplemented; very preterm VP1 - antibiotic-exposed and VP2 - antibiotic unexposed; full-term infants FT - antibiotic unexposed) and four time points. (D) Predictors of mature MC type (MC-4 and MC-5 vs MC-1, MC-2, and MC-3 combined) ranked by their relevance as determined by random-forest modelling using 1000 permutations and 500 trees. We categorised MC-4 and MC-5, enriched in Bifidobacterium and Bacteroides, respectively (Supplementary Fig. S5), as mature MC types because they emerged in full-term infants on day 7.
Fig. 4
Fig. 4
Early life microbial community interconnectivity and stability. Network analysis along the microbiota maturation trajectory (A) and different infant groups at day 7 (B). Each node represents one bacterial genus, and the connection represents Spearman’s correlation coefficient. The greater the Spearman’s correlation coefficient, the thicker the line connecting the genera. Aquamarine colour exhibits a positive correlation, whereas tangerine indicates a negative correlation. (C) Stability and the likelihood of transitioning amongst the microbial community (MC) types were assessed by Markov Chain modelling and compared in the different infant groups. Only the first two time points, covering the window of probiotic intervention, were considered in the analysis. Each node represents an MC type identified by the Dirichlet Multinomial Mixture model. Abbreviations: extremely preterm infants (EP), very preterm infants (VP), and full-term infants (FT). Abbreviations of bacterial genera can be found in Supplementary Table S5.
Fig. 5
Fig. 5
Resistome composition across different infant groups. (A) Relative abundance of antibiotic resistance genes (ARGs) in reads per kilobase per million mapped reads (RPKM) stratified by antibiotic classes. (B) Relative abundance of genes in RPKM that confer multidrug resistance (MDR) grouped by antimicrobial-resistant gene families. (C) Log10 of the relative abundance of ARGs in RPKM. Each point represents a sample. The horizontal box lines represent the first quartile, the median, and the third quartile. The p values were computed using the One-way ANOVA and adjusted using Tukey’s HSD post hoc test (∗∗adj. p < 0.01). (D) The Bray–Curtis dissimilarity matrix and PERMANOVA test showed a significant shift in the resistome composition on the day 7 timepoint. Except for infant group comparisons VP1 vs VP2 and EP vs FT (p = 0.423, and p = 0.337), the resistome composition in each group was significantly dissimilar from any other group. Each point represents the resistome of an individual sample. Ellipses represent 95 confidence intervals. Abbreviations: extremely preterm infants (EP), very preterm infants (VP), full-term infants (FT), resistance-nodulation-division (RND), major facilitator superfamily (MFS), ATP binding cassette (ABC), and Multidrug And Toxic compound Extrusion (MATE).
Fig. 6
Fig. 6
Mobile genetic elements (MGE) composition across different infant groups. (A) Relative abundance of MGEs in reads per kilobase per million mapped reads (RPKM). The relative abundance of the MGEs identified on day 7 in the EP infants was significantly higher than those identified for the other groups (Tukey’s HSD post hoc test; EP vs VP1 adj. p = 0.031; EP vs VP2 adj. p = 0.029; EP vs FT adj. p = 0.036). On day 28, the FT group had significantly lower MGEs abundance than the other groups (FT vs EP adj. p = 0.003; FT vs VP1 adj. p = 0.035; FT vs VP2 adj. p = 0.031). On day 120, there were no significant differences between groups. The MGEs levels plunged on day 365, with the significance between EP vs VP2 (adj. p = 0.031) and EP vs FT (adj. p = 0.033). (B) Shannon evenness index comparison between the groups. Each point represents a sample. The horizontal box lines represent the first quartile, the median, and the third Quartile. The p values were computed using the One-way ANOVA and adjusted using Tukey’s HSD post hoc test (∗adj. p < 0.05). Abbreviations: extremely preterm infants (EP), very preterm infants (VP), and full-term infants (FT).
Fig. 7
Fig. 7
The contribution of E. coli species to antibiotic resistance gene (ARG) load in infancy. (A) Co-occurrence patterns between ARGs and microbial taxa on day 7 across the infant groups. The heatmap legend represents Spearman’s correlation coefficient (we excluded Spearman’s correlation <0.8). (B) The numbers of E. coli strains identified by StrainGE in the four infant groups through four time points: days 7, 28, 120, and 365. Abbreviations: extremely preterm infants (EP), very preterm infants (VP), and full-term infants (FT).

References

    1. Walani S.R. Global burden of preterm birth. Int J Gynaecol Obstet. 2020;150(1):31–33. - PubMed
    1. Cao G., Liu J., Liu M. Global, regional, and national incidence and mortality of neonatal preterm birth, 1990-2019. JAMA Pediatr. 2022;176(8):787–796. - PMC - PubMed
    1. Perin J., Mulick A., Yeung D., et al. Global, regional, and national causes of under-5 mortality in 2000–19: an updated systematic analysis with implications for the sustainable development goals. Lancet Child Adolesc Health. 2022;6(2):106–115. - PMC - PubMed
    1. Kullberg R.F., Wiersinga W.J., Haak B.W. Gut microbiota and sepsis: from pathogenesis to novel treatments. Curr Opin Gastroenterol. 2021;37(6):578–585. - PubMed
    1. Healy D.B., Ryan C.A., Ross R.P., Stanton C., Dempsey E.M. Clinical implications of preterm infant gut microbiome development. Nat Microbiol. 2022;7(1):22–33. - PubMed

Publication types

Substances

LinkOut - more resources