. 2023 Jun;299(6):104823.
doi: 10.1016/j.jbc.2023.104823. Epub 2023 May 13.

Reduced APPL1 impairs osteogenic differentiation of mesenchymal stem cells by facilitating MGP expression to disrupt the BMP2 pathway in osteoporosis

Affiliations

Reduced APPL1 impairs osteogenic differentiation of mesenchymal stem cells by facilitating MGP expression to disrupt the BMP2 pathway in osteoporosis

Weiquan Yuan et al. J Biol Chem. 2023 Jun.

Abstract

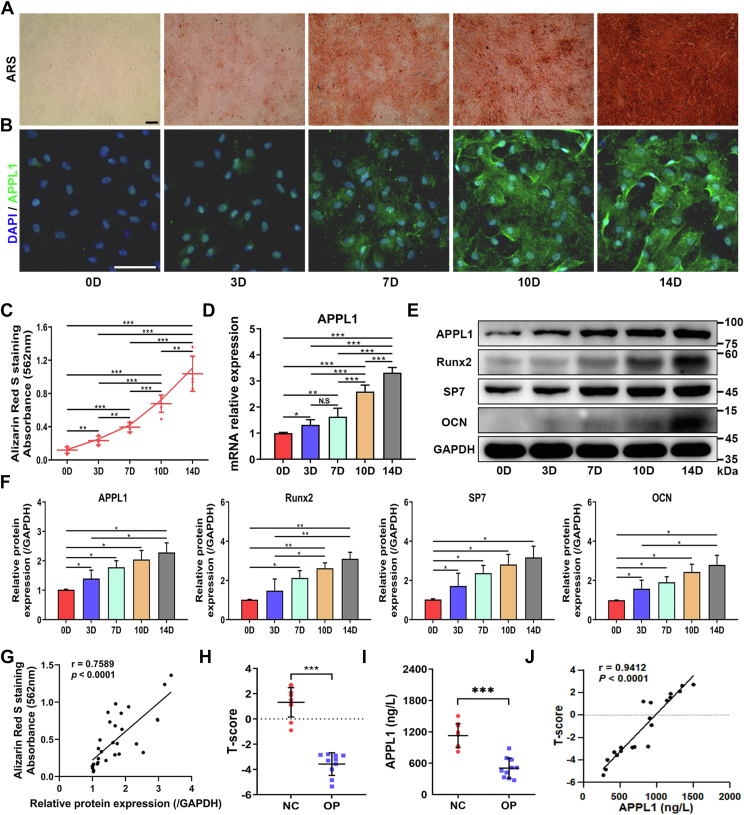
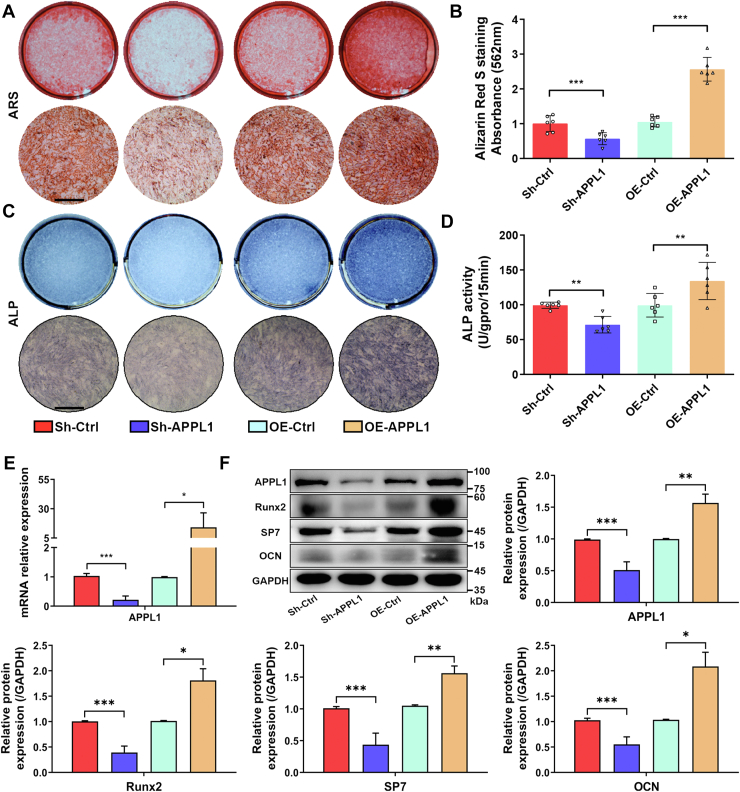
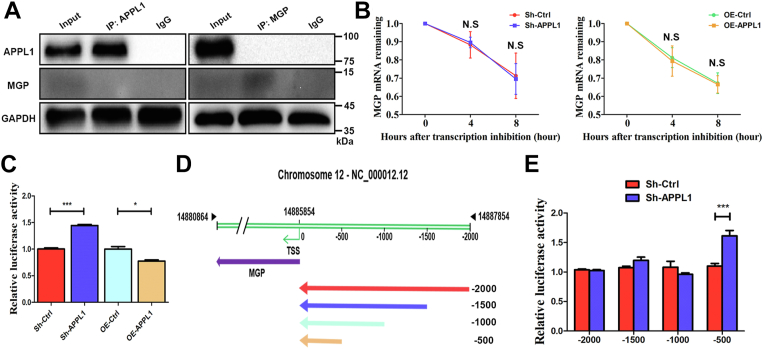
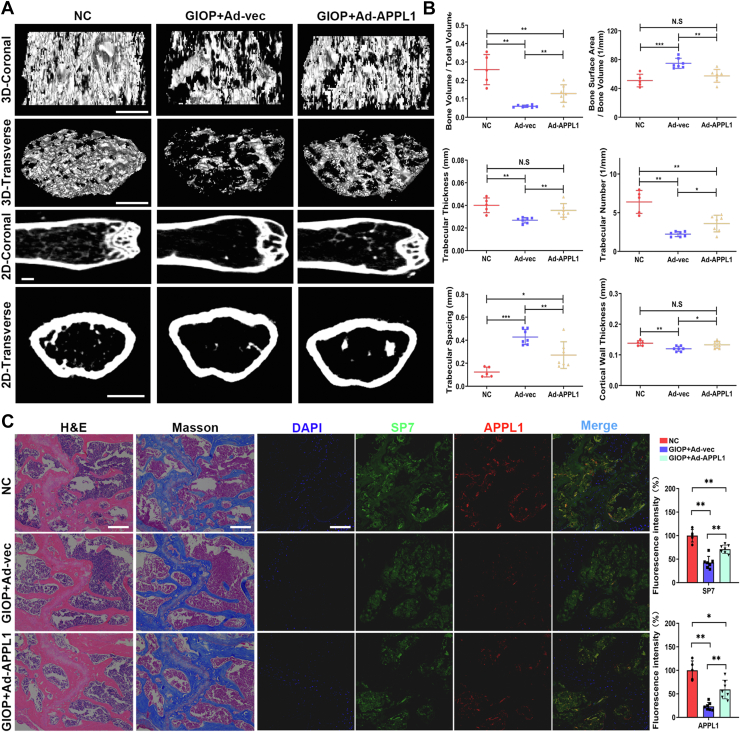
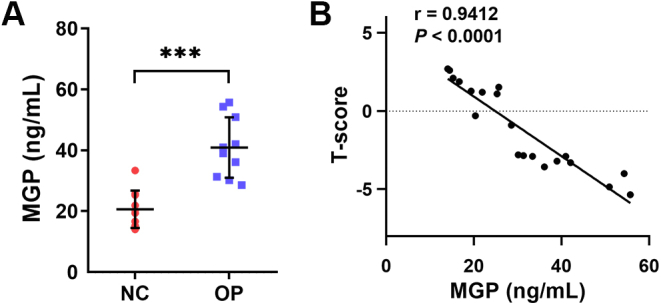
An imbalance of human mesenchymal stem cells (MSCs) adipogenic and osteogenic differentiation plays an important role in the pathogenesis of osteoporosis. Our previous study verified that Adaptor protein, phosphotyrosine interacting with PH domain and leucine zipper 1 (APPL1)/myoferlin deficiency promotes adipogenic differentiation of MSCs by blocking autophagic flux in osteoporosis. However, the function of APPL1 in the osteogenic differentiation of MSCs remains unclear. This study aimed to investigate the role of APPL1 in the osteogenic differentiation of MSCs in osteoporosis and the underlying regulatory mechanism. In this study, we demonstrated the downregulation of APPL1 expression in patients with osteoporosis and osteoporosis mice. The severity of clinical osteoporosis was negatively correlated with the expression of APPL1 in bone marrow MSCs. We found that APPL1 positively regulates the osteogenic differentiation of MSCs in vitro and in vivo. Moreover, RNA sequencing showed that the expression of MGP, an osteocalcin/matrix Gla family member, was significantly upregulated after APPL1 knockdown. Mechanistically, our study showed that reduced APPL1 impaired the osteogenic differentiation of mesenchymal stem cells by facilitating Matrix Gla protein expression to disrupt the BMP2 pathway in osteoporosis. We also evaluated the significance of APPL1 in promoting osteogenesis in a mouse model of osteoporosis. These results suggest that APPL1 may be an important target for the diagnosis and treatment of osteoporosis.

Keywords: APPL1; MGP; MSCs; osteogenic differentiation; osteoporosis.


Conflict of interest statement

Conflict of interest The authors declare that the research was conducted in the absence of any commercial or financial relationships that could be construed as a potential conflict of interest.

Figures

Figure 1
Figure 1
APPL1 expression is decreased in osteoporosis.A, sagittal view of the femur in the GIOP mouse model. B, representative micro-CT 3D reconstruction of trabecular bone in the proximal femur. C, midsection of the femur in the GIOP mouse model. D, measurements of BSA/BV, BV/TV, Tb.Th, Tb.N, and Tb.Sp in proximal femur trabecular bone and Ct.Th in the mid-femur after 8 weeks of intervention. E, left: H&E staining and Masson staining of bone tissue in NC and GIOP groups of mice, right: immunofluorescence staining and quantitative analyses of SP7 and APPL1 in bone tissue of NC and GIOP groups of mice. F and G, the mRNA and protein levels of APPL1 in the tibia of the negative control and GIOP groups were measured by qRT‒PCR and Western blotting (Data were normalized to GAPDH). The data are shown as the mean ± SD (n = 5 per group). ∗p < 0.05, ∗∗p < 0.01, ∗∗∗p < 0.001 compared with the NC group. Scale bar = 100 μm. APPL1, Adaptor protein, phosphotyrosine interacting with PH domain and leucine zipper 1; GIOP, glucocorticoid-induced osteoporosis; micro-CT, micro-computed tomography; NC, normal control.
Figure 2
Figure 2
APPL1 is upregulated during the osteogenic differentiation of MSCs.A and C, ARS staining and quantitative analyses of MSCs after osteogenic induction at different times. B, immunofluorescence staining of APPL1 during osteogenic differentiation of MSCs. D, the expression of APPL1 mRNA in MSCs at different osteogenic induction times was measured by qRT‒PCR. E and F, Western blotting was used to detect the expression of APPL1 and osteogenesis-associated marker proteins Runx2, SP7, and OCN at different osteogenic induction times in MSCs. G, Pearson correlation analysis showed that there was a correlation between APPL1 expression and ARS staining levels during osteogenic differentiation of MSCs. The data are shown as the mean ± SD (n = 6 per group). ∗p < 0.05, ∗∗p < 0.01, ∗∗∗p < 0.001, and N.S. indicates no significant difference. Scale bar = 100 μm. H, T-score differences between osteoporosis patients and healthy volunteers. I, the APPL1 concentration in MSCs lysates was detected by ELISA. J, Pearson correlation analysis showed that APPL1 expression was correlated with the severity of osteoporosis in different human MSCs. The data are shown as the mean ± SD (n = 10 per group). ∗∗∗p < 0.001 compared with the NC group. APPL1, Adaptor protein, phosphotyrosine interacting with PH domain and leucine zipper 1; ARS, alizarin red S; MSCs, mesenchymal stem cells.
Figure 3
Figure 3
APPL1 positively regulated the osteogenic differentiation of MSCs in vitro.A and B, ARS staining and quantitative analysis were performed after interference with APPL1 expression. C and D, ALP staining and activity observed after interference with APPL1 expression. E, relative mRNA expression of APPL1 after knockdown and overexpression of APPL1. F, APPL1, Runx2, SP7, and OCN were determined by Western blot after knockdown and overexpression of APPL1. The data are shown as the mean ± SD (n = 6 per group). ∗p < 0.05, ∗∗p < 0.01, ∗∗∗p < 0.001. Scale bar = 100 μm. ALP, alkaline phosphatase; APPL1, Adaptor protein, phosphotyrosine interacting with PH domain and leucine zipper 1; MSCs, mesenchymal stem cells.
Figure 4
Figure 4
MGP expression is increased after APPL1 knockdown in MSCs.A and B, cluster heatmap and volcano map for negative control and knockdown APPL1 treatment. C, Venn diagram of the negative control and APPL1 knockdown groups. D, the top 79 differentially expressed mRNAs identified by RNA sequencing. (n = 3 per group). FC ≥ 2,p ≤ 0.01. E and F, after knockdown and overexpression of APPL1, the expression of related mRNAs was measured by qRT‒PCR. The data are shown as the mean ± SD (n = 9 per group). ∗p < 0.05, ∗∗p < 0.01, ∗∗∗p < 0.001, and N.S. indicates no significant difference. APPL1, Adaptor protein, phosphotyrosine interacting with PH domain and leucine zipper 1; MGP, Matrix Gla protein; MSCs, mesenchymal stem cells.
Figure 5
Figure 5
MGP inhibited the osteogenic differentiation of MSCs by regulating the BMP2 pathway.A and B, ARS staining and quantitative analysis and ALP staining and activity measurements were performed after interference with MGP expression. C, protein levels of MGP, Runx2, and SP7 were determined by Western blot after knockdown and overexpression of MGP. D, MSCs lysates were immunoprecipitated with MGP, BMP2, or IgG antibodies. The interactions between the MGP and BMP2 proteins in MSCs were detected using Western blot analysis. E, immunofluorescence colocalization analysis of MGP and BMP2 in MSCs. F and G, activation levels of the Smad1/5/8, p38 MAPK, JNK, and ERK-1/2 signaling pathways in MSCs after interference with MGP expression were determined by Western blotting. The results of Western blotting were quantified as the intensity ratio of phosphorylated to nonphosphorylated proteins. The data are shown as the mean ± SD (n = 6 per group). ∗p < 0.05, ∗∗p < 0.01, ∗∗∗p < 0.001, and N.S. indicates no significant difference. Scale bar = 100 μm. ALP, alkaline phosphatase; ARS, alizarin red S; MGP, Matrix Gla protein; MSCs, mesenchymal stem cells.
Figure 6
Figure 6
MGP is a key downstream target of APPL1-mediated osteogenic differentiation of MSCs.AD, ARS staining and quantitative analysis and ALP staining and activity measurements were performed after interference with APPL1 and MGP expression. E and F, protein levels of APPL1, MGP, Runx2, and SP7 were determined by Western blot. G and H, immunofluorescence staining of APPL1 and SP7 after interference with APPL1 and MGP expression. The data are shown as the mean ± SD (n = 6 per group). ∗p < 0.05, ∗∗p < 0.01, ∗∗∗p < 0.001, and N.S. indicates no significant difference. Scale bar = 100 μm. APPL1, Adaptor protein, phosphotyrosine interacting with PH domain and leucine zipper 1; MGP, Matrix Gla protein; MSCs, mesenchymal stem cells.
Figure 7
Figure 7
APPL1 inhibited MGP expression by binding to the MGP promoter.A, MSCs lysates were immunoprecipitated with APPL1, MGP or IgG antibodies. The interactions between the APPL1 and MGP proteins in MSCs were detected using Western blot analysis. B, the RNA lifetime of MGP in MSCs transfected with knockdown or overexpressing APPL1 lentivirus was determined by monitoring transcript abundance after adding actinomycin D. C, the luciferase reporter vector subcloned with a 2.0-kb MGP promoter was transfected into 293T cells that were lentivirally transduced with scrambled or APPL1 shRNA and empty vector or APPL1 expression vector. After 24 h, luciferase activities were measured with Renilla for normalization. D, a series of 5′ deletions of the MGP promoter generated by PCR were subcloned into the pGL4.10 luciferase reporter vector. E, the different lengths of MGP promoter luciferase vectors were transiently transfected into 293T cells that were lentivirally transduced with scrambled or APPL1 shRNA. Luciferase activity was measured 24 h posttransfection with Renilla for normalization. The data are shown as the mean ± SD (n = 3 per group). ∗p < 0.05, ∗∗∗p < 0.001, and N.S. indicates no significant difference. APPL1, Adaptor protein, phosphotyrosine interacting with PH domain and leucine zipper 1; MGP, Matrix Gla protein; MSCs, mesenchymal stem cells.
Figure 8
Figure 8
APPL1 significantly reduced bone loss in a GIOP mouse model.A, representative micro-CT 2D and 3D reconstruction of trabecular bone. B, measurements of BSA/BV, BV/TV, Tb.Th, Tb.N, and Tb.Sp in proximal femur trabecular bone and Ct.Th in the mid-femur after 8 weeks of intervention. C, left: H&E staining and Masson staining of bone tissue in NC, GIOP+Ad-vec and GIOP+Ad-APPL1 groups of mice, right: immunofluorescence staining and quantitative analyses of SP7 and APPL1 in bone tissue of NC, GIOP+Ad-vec and GIOP+Ad-APPL1 groups of mice. The data are shown as the mean ± SD (NC group, n = 5; GIOP+Ad-vec group, n = 7; GIOP+Ad-APPL1 group, n = 7). ∗p < 0.05, ∗∗p < 0.01, ∗∗∗p < 0.001, and N.S. indicates no significant difference. Scale bar = 100 μm. APPL1, Adaptor protein, phosphotyrosine interacting with PH domain and leucine zipper 1; GIOP, glucocorticoid-induced osteoporosis; micro-CT, micro-computed tomography; NC, normal control.
Supporting Figure S1
Phenotypic identification and trilineage differentiation potential of MSCs.A, the morphology of MSCs. B and C, MSCs were positive for CD73, CD90, and CD105 but negative for HLA-DR, CD14, CD34, and CD45. DG, the MSCs were differentiated into osteoblasts (ALP staining after 10 days; ARS staining after 14 days), adipocytes (ORO staining after 14 days) and chondrocytes (Alcian blue staining after 21 days). The data are shown as the mean ± SD (n = 6 per group). Scale bar = 50 μm.
Supporting Figure S2
Bioinformatic analysis of RNA sequencing data.A, GO analysis of the molecular function terms identified by RNA sequencing. B, KEGG pathway analysis after APPL1 knockdown. (n = 3 per group).
Supporting Figure S3
Increased serum MGP levels in patients with osteoporosis.A, the concentration of MGP in serum was determined by ELISA. B, Pearson correlation analysis showed that serum MGP concentration was negatively correlated with T-score of osteoporosis. The data are shown as the mean ± SD (n = 10 per group). ∗∗∗p < 0.001 compared with the NC group.
Supporting Figure S4
APPL1 regulates osteogenic differentiation of MSCs through BMP2.A and B, ARS staining and quantitative analyses, ALP staining and activity measurements. The data are shown as the mean ± SD (n = 6 per group). ∗∗∗p < 0.001. Scale bar = 100 μm.

References

    1. Compston J.E., McClung M.R., Leslie W.D. Osteoporosis. Lancet. 2019;393:364–376. - PubMed
    1. Reginster J.Y., Burlet N. Osteoporosis: a still increasing prevalence. Bone. 2006;38:S4–S9. - PubMed
    1. Muschitz C., Hummer M., Grillari J., Hlava A., Birner A.H., Hemetsberger M., et al. Epidemiology and economic burden of fragility fractures in Austria. Osteoporos. Int. 2022;33:637–647. - PMC - PubMed
    1. Song S., Guo Y., Yang Y., Fu D. Advances in pathogenesis and therapeutic strategies for osteoporosis. Pharmacol. Ther. 2022;237 - PubMed
    1. Xian L., Wu X., Pang L., Lou M., Rosen C.J., Qiu T., et al. Matrix IGF-1 maintains bone mass by activation of mTOR in mesenchymal stem cells. Nat. Med. 2012;18:1095–1101. - PMC - PubMed

Publication types

MeSH terms