

Type 2 diabetes alters the viscoelastic behavior and macromolecular composition of vertebra
- PMID: 37187573
- PMCID: PMC10176031
- DOI: 10.1016/j.bonr.2023.101680
Type 2 diabetes alters the viscoelastic behavior and macromolecular composition of vertebra
Abstract
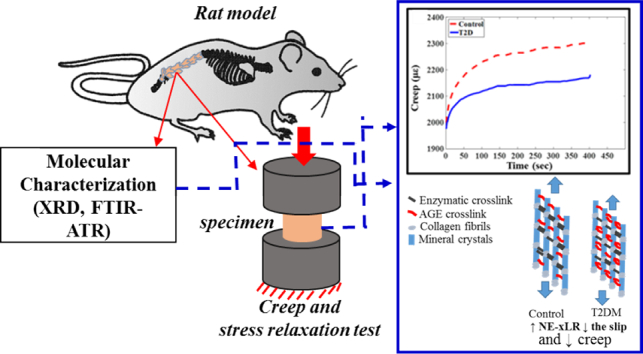
Type 2 diabetes (T2D) affects the functional behavior of vertebra bone by altering its structural and mechanical properties. The vertebral bones are responsible to carry the body weight and it remains under prolonged constant load which results to viscoelastic deformation. The effect of T2D on the viscoelastic behavior of vertebral bone is not well explored yet. In this study, the effects of T2D on the creep and stress relaxation behavior of vertebral bone are investigated. Also, this study established a correlation between T2D associated alteration in macromolecular structure and viscoelastic behavior of vertebra. In this study T2D female rat SD model was used. The obtained results demonstrated a significant reduction in the amount of creep strain (p ≤ 0.05) and stress relaxation (p ≤ 0.01) in T2D specimens than the control. Also, the creep rate was found significantly lower in T2D specimens. On the other hand, molecular structural parameters such as mineral-to-matrix ratio (control vs T2D: 2.93 ± 0.78 vs 3.72 ± 0.53; p = 0.02), and non-enzymatic cross link ratio (NE-xL) (control vs T2D: 1.53 ± 0.07 vs 3.84 ± 0.20; p = 0.01) were found significantly altered in T2D specimens. Pearson linear correlation tests show a significant correlation; between creep rate and NE-xL (r = -0.94, p < 0.01), and between stress relaxation and NE-xL (r = -0.946, p < 0.01). Overall this study explored the understanding about the disease associated alteration in viscoelastic response of vertebra and its correlation with macromolecular composition which can help to understand the disease related impaired functioning of the vertebrae body.
Keywords: ATR-FTIR; Creep; Molecular structure; Stress relaxation; Vertebral body; XRD.
© 2023 Published by Elsevier Inc.
Conflict of interest statement
The authors declare that they have no known competing financial interests or personal relationships that could have appeared to influence the work reported in this paper.
Figures


References
-
- Anekstein Y., Smorgick Y., Lotan R., Agar G., Shalmon E., Floman Y., et al. Diabetes mellitus as a risk factor for the development of lumbar spinal stenosis. Israel Med. Assoc. J. 2010;12(1):16. - PubMed
-
- Browne J.A., Cook C., Pietrobon R., Bethel M.A., Richardson W.J. Diabetes and early postoperative outcomes following lumbar fusion. Spine (Phila Pa 1976) 2007;32(20):2214–2219. - PubMed
LinkOut - more resources
Full Text Sources
Miscellaneous
