. 2023 Apr 28:14:1143875.
doi: 10.3389/fimmu.2023.1143875. eCollection 2023.

Changes in HCMV immune cell frequency and phenotype are associated with chronic lung allograft dysfunction

Affiliations

Changes in HCMV immune cell frequency and phenotype are associated with chronic lung allograft dysfunction

Amélie Rousselière et al. Front Immunol. .

Abstract

Background: Human cytomegalovirus (HCMV) infection is common and often severe in lung transplant recipients (LTRs), and it is a risk factor associated with chronic lung allograft dysfunction (CLAD). The complex interplay between HCMV and allograft rejection is still unclear. Currently, no treatment is available to reverse CLAD after diagnosis, and the identification of reliable biomarkers that can predict the early development of CLAD is needed. This study investigated the HCMV immunity in LTRs who will develop CLAD.

Methods: This study quantified and phenotyped conventional (HLA-A2pp65) and HLA-E-restricted (HLA-EUL40) anti-HCMV CD8+ T (CD8 T) cell responses induced by infection in LTRs developing CLAD or maintaining a stable allograft. The homeostasis of immune subsets (B, CD4T, CD8 T, NK, and γδT cells) post-primary infection associated with CLAD was also investigated.

Results: At M18 post-transplantation, HLA-EUL40 CD8 T responses were less frequently found in HCMV+ LTRs (21.7%) developing CLAD (CLAD) than in LTRs (55%) keeping a functional graft (STABLE). In contrast, HLA-A2pp65 CD8 T was equally detected in 45% of STABLE and 47.8% of CLAD LTRs. The frequency of HLA-EUL40 and HLA-A2pp65 CD8 T among blood CD8 T cells shows lower median values in CLAD LTRs. Immunophenotype reveals an altered expression profile for HLA-EUL40 CD8 T in CLAD patients with a decreased expression for CD56 and the acquisition of PD-1. In STABLE LTRs, HCMV primary infection causes a decrease in B cells and inflation of CD8 T, CD57+/NKG2C+ NK, and δ2-γδT cells. In CLAD LTRs, the regulation of B, total CD8 T, and δ2+γδT cells is maintained, but total NK, CD57+/NKG2C+ NK, and δ2-γδT subsets are markedly reduced, while CD57 is overexpressed across T lymphocytes.

Conclusions: CLAD is associated with significant changes in anti-HCMV immune cell responses. Our findings propose that the presence of dysfunctional HCMV-specific HLA-E-restricted CD8 T cells together with post-infection changes in the immune cell distribution affecting NK and γδT cells defines an early immune signature for CLAD in HCMV+ LTRs. Such a signature may be of interest for the monitoring of LTRs and may allow an early stratification of LTRs at risk of CLAD.

Keywords: CD8 T cells; CMV; HCMV immunity; HCMV infection; HLA-E; UL40; chronic lung allograft dysfunction; transplantation.


Conflict of interest statement

The authors declare that the research was conducted in the absence of any commercial or financial relationships that could be construed as a potential conflict of interest.

Figures

Figure 1
Figure 1
Flowchart representing the design of the study and showing the two groups of lung transplant recipients (LTRs) (group 1 and group 2) included and the samples used for the investigations.
Figure 2
Figure 2
Detection and frequency of HLA-A2pp65 and HLA-E/UL40 human cytomegalovirus (HCMV)-specific CD8 T cells in chronic lung allograft dysfunction (CLAD) versus STABLE LTRs. (A) Pie charts indicating the percentages of HCMV+ LTRs with HCMV-specific CD8 T cells detected at M18 post-transplantation. A single PBMC sample per STABLE (in blue, n = 32) and CLAD (in red, n = 31) LTRs was used for the concomitant detection of HLA-A2pp65 and HLA-EUL40 CD8 T cells. For the detection of HLA-EUL40 CD8 T cells, two HLA-E tetramers loaded with two different peptides (VMAPRTLLL and VMAPRTLIL) corresponding to the most frequent UL40 variants were used in parallel experiments. The percentages of hosts with at least one type of CD8 T-cell response (A2pp65 or EUL40, left panel) and at least one or two EUL40 CD8 T-cell responses (central panel) with only an A2pp65 response or with both A2pp65 and EUL40 CD8 T-cell responses (right panel) are shown. (B) Schematic representation illustrating the patterns of peptide specificities for the anti-HCMV CD8 T cells detected in the STABLE and CLAD HCMV+ hosts. In both groups (STABLE and CLAD), 17 out of the 35 LTRs were found to possess at least one HCMV-specific CD8 T response (black dots). LTRs with no CD8 T responses detected are not represented. (C) Frequency distribution of HCMV-specific CD8 T cells among the total blood CD8 T cells in STABLE and CLAD LTRs. Scatter plots reporting on the frequency of EUL40 and A2pp65 CD8 T cells in blood samples from LTRs with at least one CD8 T response (STABLE, n = 17 LTRs and CLAD, n = 17 LTRs). Data are expressed as the percentages of total blood CD8 T cells for each LTR. Medians and IQRs are shown and median values are indicated above the histograms. Each dot corresponds to a single CD8 T-cell subset. Statistical analysis was performed using the Mann–Whitney U test.
Figure 3
Figure 3
Immunophenotype of HLA-EUL40 and HLA-A2pp65 memory CD8 T cells in CLAD versus STABLE LTRs. Immunostaining was performed after a preliminary step of CD94 blocking and by using a panel of mAbs for 11 cell surface markers and HLA tetramer complexes. After fluorescence acquisition, HLA tet+ CD8 T populations were selected as CD3+CD8+TCRγδ tetramer+ T cells and gated as indicated in Figure S2 to determine the expression of various markers. Analyses are shown in box plots with median and interquartile values. Each dot corresponds to a single, independent tet+ CD8 T-cell response including A2pp65 tet+ responses from STABLE (n = 5) and CLAD (n = 8) LTRs and EUL40 from STABLE (n = 14) and CLAD (n = 7) LTRs. (A) Expression of CD56, PD-1, CD57, 2B4, KLRG1, and CX3CR1 on EUL40 and A2pp65 CD8 T cells from STABLE and CLAD LTRs. Results are expressed as percentages of expressing cells among the total tet+ CD8 T cells. (B) Differentiation stage and expression of TCR co-receptors (CD3, CD8, CD45RA). Percentages of terminally differentiated CD8 T (TEMRA CD45RA+/CCR7) cells among the total tet+ CD8 T populations. Comparative expression levels for CD3, CD8, and CD45RA on EUL40 and A2pp65 CD8 T cells from STABLE and CLAD LTRs. Data shown are the mean of fluorescence intensity (MFI). (A, B) Statistical analysis was performed using the Mann–Whitney U test; p-values: * for p < 0.05, ** for p < 0.01, *** for p < 0.005, and **** for p < 0.001.
Figure 4
Figure 4
Distinctive signature of CLAD on the immunophenotype of memory EUL40 CD8 T cells. Spectral flow cytometry data were analyzed using a gating strategy depicted in Supplementary Figure S2 to identify tet+ CD8 T cells. Next, tet+ CD8 T cells were subgated to select CD3+TCRγδCD8+tet+ TEMRA (CD45RA+CCR7) before clustering analysis. (A) 2D opt-SNE visualization of spectral cytometry data showing immunophenotypic patterns in pooled tet+ CD8 TEMRA populations (n = 18, consisting of nine EUL40 T subsets and nine A2pp65 T subsets). Nine clusters were identified based on the expression of CD57, CD56, CX3CR1, KLRG1, 2B4, and PD-1 as indicated. (B) 2D opt-SNE visualization of immunophenotypic patterns in A2pp65 versus EUL40 tet+ CD8 TEMRA populations (n = 9 for EUL40 T subsets and n = 9 for A2pp65 T subsets). (C) 2D opt-SNE visualization of immunophenotypic patterns in A2pp65 and EUL40 tet+ CD8 TEMRA populations from CLAD versus STABLE LTRs (n = 9 for EUL40 T subsets and n = 9 for A2pp65 T subsets).
Figure 5
Figure 5
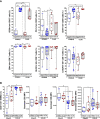
Signature of HCMV infection and signature of CLAD on the distribution of immune subsets in LTRs. (A) Visualization (opt-SNE) of the relative abundance of the seven main lymphocyte populations on samples from LTRs (STABLE and CLAD samples embedded) harvested before (n = 17) and after (n = 40) HCMV infection (left panel). Lymphocyte populations including B, NK, CD4CD8 T, CD4+ T, CD8+ αβT, δ2γδT, and δ2+γδT cells were identified using manual assignation based on phenotype markers ( Figure S5 ). (B) Frequencies (% total) of the seven main lymphocyte populations identified (right panel). (C) Visualization (opt-SNE) of the relative abundance of the seven main lymphocyte populations in samples harvested after HCMV infection from either the STABLE (n = 28 samples from 13 LTRs) or CLAD (n = 12 samples from 5 LTRs) LTRs (left panel). (D) Frequencies (% total) of the seven main lymphocyte populations identified in CLAD versus STABLE LTRs (right panel). (A, B) Results are shown in whisker plots with median and interquartile values, and each point corresponds to an individual LTR. The groups were compared using the Mann–Whitney U test; p-values are indicated.
Figure 6
Figure 6
Relative distribution of adaptive/memory NK cell subsets and CD57 level post-HCMV infection in CLAD versus STABLE LTRs. (A) Spectral flow cytometry data were analyzed to identify NK cell subsets using manual gating. The two main populations of CD3CD16+CD56dim and CD3CD16+CD56bright NK cells were first segregated and further investigated for the expression and co-expression of the CD57 and NKG2C markers. This analysis included samples harvested before (open labels) and after (closed labels) HCMV infection for all LTRs (n = 17 samples before and n = 40 samples after the infection, black labels), STABLE LTRs (n = 13 samples before and n = 28 samples after the infection, blue labels), and CLAD LTRs (n = 4 samples before and n = 12 samples after the infection, red labels). Results are shown as box blots with median and interquartile values; each point represents a single sample. The groups were compared using the Mann–Whitney U test; p-values: * for p < 0.05, ** for p < 0.01, *** for p < 0.005, and **** for p < 0.001. (B) Visualization (opt-SNE) of the relative abundance of the seven main lymphocyte populations on samples and overall CD57 expression level from all LTRs (STABLE and CLAD samples embedded) harvested before (n = 17) and after (n = 40) HCMV infection (left panel) and (right panel) in samples harvested after HCMV infection from either the STABLE (n = 28 samples from 13 LTRs) or CLAD (n = 12 samples from 5 LTRs) LTRs (left panel). Lymphocyte populations including B, NK, CD4CD8 T, CD4+ T, CD8+ αβT, δ2γδT, and δ2+γδT cells were identified using manual assignation based on phenotype markers ( Figure S5 ).
Figure 7
Figure 7
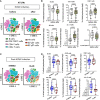
Impact of EUL40 CD8 T cells on the distribution of immune subsets post-infection in STABLE LTRs. (A) Visualization (opt-SNE) of the relative abundance of the seven main lymphocyte populations on samples with (n = 11) or without (n = 17) EUL40 CD8 T detected from STABLE LTRs harvested after HCMV infection. Lymphocyte populations including B, NK, CD4CD8 T, CD4+ T, CD8+ αβT, δ2γδT, and δ2+γδT cells were identified using manual assignation based on phenotype markers. (B) Frequencies (% total) of the seven main lymphocyte populations identified in samples harvested after HCMV infection from STABLE LTRs with or without EUL40 CD8 T detected. Results are shown in whisker plots with median and interquartile values, and each point corresponds to an individual sample. The groups were compared using the Mann–Whitney U test; p-values are indicated.

References

    1. Chambers DC, Cherikh WS, Goldfarb SB, Hayes D, Jr., Kucheryavaya AY, Toll AE, et al. . The international thoracic organ transplant registry of the international society for heart and lung transplantation: thirty-fifth adult lung and heart-lung transplant report-2018; focus theme: multiorgan transplantation. J Heart Lung Transplant (2018) 37(10):1169–83. doi: 10.1016/j.healun.2018.07.020 - DOI - PubMed
    1. Chambers DC, Yusen RD, Cherikh WS, Goldfarb SB, Kucheryavaya AY, Khusch K, et al. . The registry of the international society for heart and lung transplantation: thirty-fourth adult lung and heart-lung transplantation report-2017; focus theme: allograft ischemic time. J Heart Lung Transplant (2017) 36(10):1047–59. doi: 10.1016/j.healun.2017.07.016 - DOI - PubMed
    1. Verleden SE, Vasilescu DM, Willems S, Ruttens D, Vos R, Vandermeulen E, et al. . The site and nature of airway obstruction after lung transplantation. Am J Respir Crit Care Med (2014) 189(3):292–300. doi: 10.1164/rccm.201310-1894OC - DOI - PubMed
    1. Kulkarni HS, Cherikh WS, Chambers DC, Garcia VC, Hachem RR, Kreisel D, et al. . Bronchiolitis obliterans syndrome-free survival after lung transplantation: an international society for heart and lung transplantation thoracic transplant registry analysis. J Heart Lung Transplant (2019) 38(1):5–16. doi: 10.1016/j.healun.2018.09.016 - DOI - PMC - PubMed
    1. Royer PJ, Olivera-Botello G, Koutsokera A, Aubert JD, Bernasconi E, Tissot A, et al. . Chronic lung allograft dysfunction: a systematic review of mechanisms. Transplantation (2016) 100(9):1803–14. doi: 10.1097/TP.0000000000001215 - DOI - PubMed

Publication types